Week 4 Challenge
AIM:
- Nernst equation for fuel cell and parameters affecting the reaction in a fuel cell.
- Location of 3 power points/regions in polarization curve of fuel cell.
- Best operating point/region.
NERNST EQUATION FOR FUEL CELL AND PARAMETERS AFFECTING THE REACTION IN A FUEL CELL.
In electrochemistry, the Nernst equation is an equation that relates the reduction potential of an electrochemical reaction (half-cell or full cell reaction) to the standard electrode potential, temperature, and activities (often approximated by concentrations) of the chemical species undergoing reduction and oxidation. It was named after Walther Nernst, a German physical chemist who formulated the equation.
In fuel cell studies Nernst equation can be defined in following ways:
- The Nernst equation provides a relationship between the standard potential( )for the cell reaction and the open circuit voltage. That is to say, once the standard potential is known for the desired temperature (indicated by a subscript T), the open circuit voltage can be determined at other partial pressures of reactants and products at that temperature.
- The Nernst Equation in fuel cell provides an expression for the reversible thermodynamic potential, also known as the equilibrium voltage or the open-circuit electromotive force (EMF), of the fuel cell.
- Nernst equations are the equations which give an EMF of a certain reaction in terms of product and/or reactant activity. The EMF calculated from such equations is known as the ‘Nernst voltage’ and in fuel cell studies the calculated value is the reversible cell voltage that would exist at a given temperature and pressure.
Equation below is the general form of the Nernst equation for the overall cell reaction in fuel cell and it can be used to determine the open circuit voltage of any fuel cell:
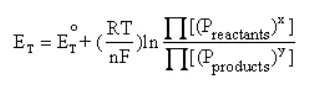
where:
= open circuit voltage
= standard potential of the reaction
F = Faraday’s number, 96487 C/equiv
R = universal gas constant, 8.314 J/ °K-mol
T = absolute temperature of cell, °K
 = partial pressures or activity of the species involved
n = the number of electrons involved (equiv/mol)
x, y = stoichiometric coefficients
The open circuit voltage ET of the cell by convention is measured as the potential difference between the potential drop at the cathode and the potential drop at the anode at some temperature T.
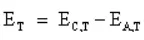
For example, if we use the Nernst equation (first Equation stated) for the oxygen and hydrogen reaction that occurs at the cathode and anode of a PEM fuel cell, respectively, and then take the difference using second Equation, where we let  , we can see that what we get is the Nernst equation for the overall cell reaction of the PEM fuel cell which is equal to the Nernst equation if we simply applied the overall cell reaction.
PARAMETERS AFFECTING THE REACTION IN A FUEL CELL.
The performance of a PEMFC can be affected by many reasons. Some of them are:
- Load current
- Temperature
- Relative humidity
- Membrane thickness
- Membrane-active area
- Electrode active area
- Corrosion, Purity, Pressure, and concentration of hydrogen fuel
- Maintenance of water inside the cell
- Pressure in the electrode (particularly on both side of the membrane)
If the fuel cell is desingned by taking care of all the above mentioned parameters, FCs operation will be optimal. Below are the ways by which parameters can affect fuel cell reactions:
- Activation, ohmic and concentration losses make the fuel cell voltage less than before.
- Humid condition and thermal condition are two significant factors for PEMFC operation. The change in the temperature of a fuel cell affects the electrochemical reaction, proton exchange, and water production.
- The bipolar plate has two sides. On one side there is a gas flow path and on the other side, external water flow is used for temperature maintenance in the fuel cell.
- Rising current density accelerates the reaction process. Besides, the heat production in the fuel cell is proportional to the rate of the reaction process. In the outer part of the plate, the proton exchange membrane becomes dried because of the rising temperature. Additionally, the density of the electron flow rate becomes lower over time in the fuel cell.
- The density of the electron flow is higher when the supplied gas is enough.
- The current distribution is also an important factor and it is inversely proportional to the density of electron flow rate. The rising reactant flow rate creates a uniform current flow.
- Inappropriate thermal energy will decrease the performance of the proton exchange membrane.
LOCATION OF 3 POWER VALUES/REGIONS IN POLARIZATION CURVE OF FUEL CELL:
In fuel cell working as current increases, the voltage reduces due to the internal resistance, over-potentials, and concentration effects. Provided that excess fuel is supplied, the voltage decreases approximately linearly with current. The losses in fuel cells are related to the power output. As more current is drawn from a cell, the losses increase. This can be seen as the cell voltage drops from the open circuit voltage with increasing current.
We have three power values here 15, 3, 27 (all in W/cm^2) . Figure below represents the votage current relationship along with losses region in fuel cell.
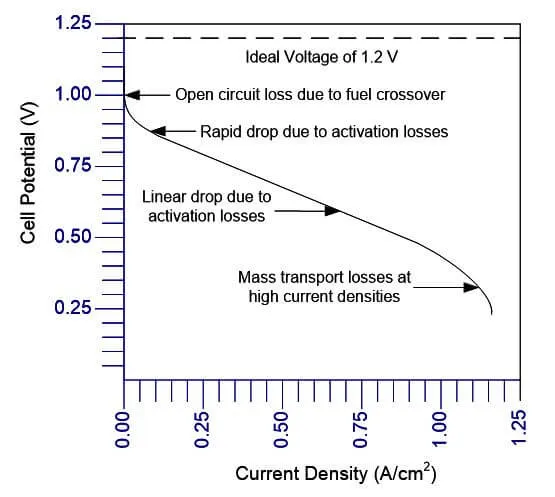
There are three distinct regions of a fuel cell polarization curve:
- At low power densities, the cell potential drops due to activation polarization.
- At moderate current densities, the cell potential decreases linearly with current due to ohmic losses.
- At high current densities, the cell potential drop departs from the linear relationship with current density due to concentration polarization (mass transport losses).
According to this regions in polarization curve the power value 3 W/cm^2 should lie in low power density region (cause it is the lowest power value) and 15 W/cm^2 should lie in moderate current densities region and 27 W/cm^2 should lie in high current densities region. We will try to locate this areas in power-Volatge current curves. The typical fig for same is shown below:
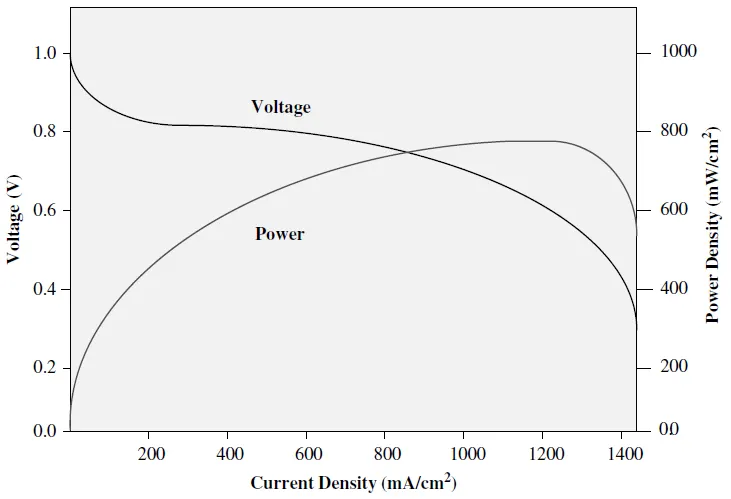
To locate the power values a zonal regions have been shown in the figure below:
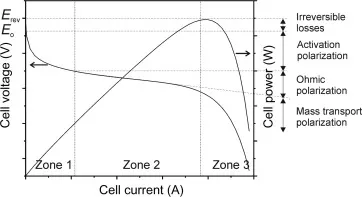
From what we have stated above, the three power values will lie somewhere in regions as given below:
ZONE 1: 3 W/cm^2 (At low power densities)
ZONE 2: 15 W/cm^2 (At moderate current densities)
ZONE 3: 27 W/cm^2 (At high current densities)
BEST OPERATING POINT/REGION.
Now one may think that zone 3 should be the best operating point as it gives the highest power. But that is not the case here. We need high voltage levels or value for the efficent operation of system (considering EV application). But at zone 3 the voltage we get is very less and the losses are more. Now we know that we want high voltages for efficient operation. So Zone 1 seems to have high volatge and it should be with one best opearating point. But even Zone 1 isnt the best cause it has the low power density and thus might give high voltage but not enough power to drive the system.
Now we are left wit zone 2. And yes the intersection point in zone 2 is the best operating point/region for the fuel cell as we get decent volatge and current in that region. Though power available as compare to zone 3.
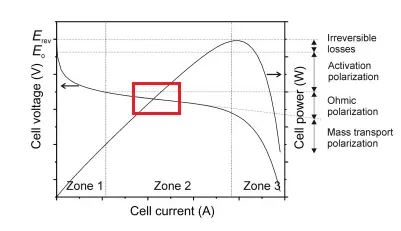
The intersection point shown in red box in zone 2 is the sweet spot for fuel cell to operate at high power.