Week-4 : Basic Calibration of Single cylinder CI-Engine
Q-1 Comparison of SI and CI cycle engines is as follow:
Given comparison is for the same bore x stroke of the engine.
For the same size, the CI engine has better performance than the SI engine. CI engine has higher pressure during compression as shown in graphs and also in CI cycle pressure will rise even more after the start of injection while in SI engine won't be pressure rise because of no injection.
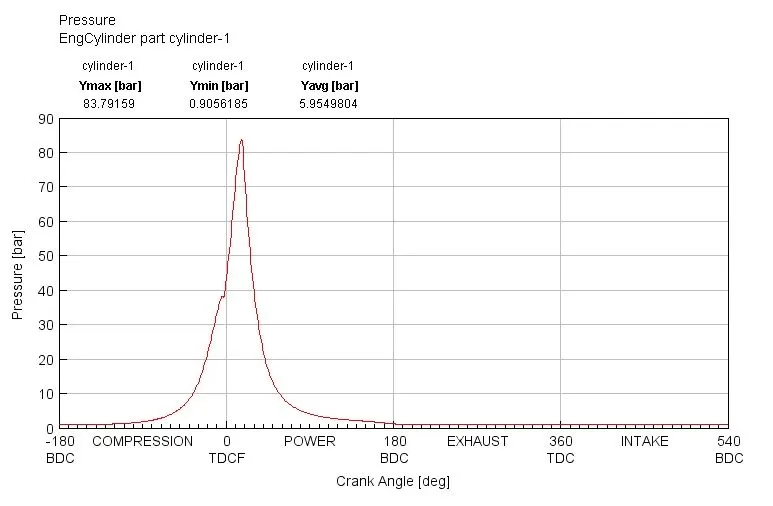
Figure - CI engine pressure
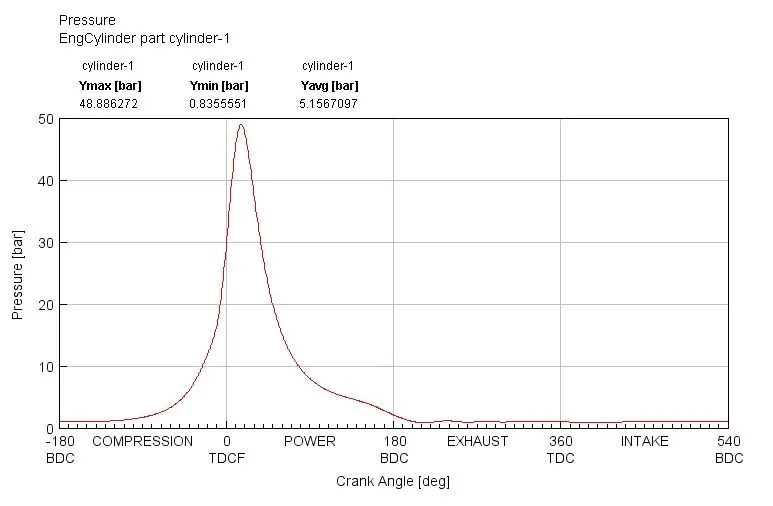
Figure - SI engine pressure
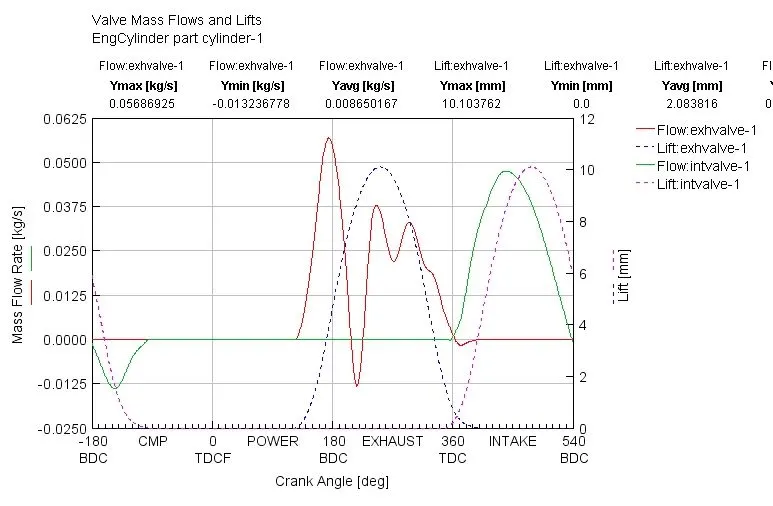
Figure - CI engine valve lifts & mass flow rate
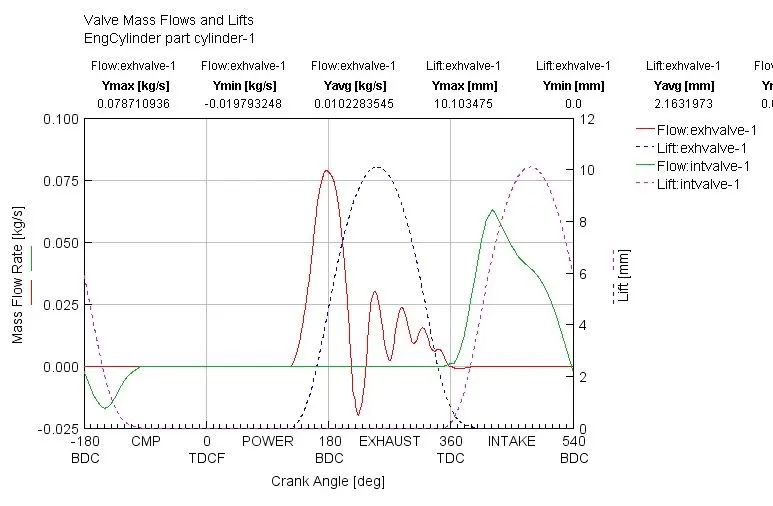
Figure - SI engine valve lifts & mass flow rate
From the above graphs, it is seen that in CI during there is a sudden loss of flow during exhaust while in SI during intake sudden change in flow happens. it is also observed in the CI engine max flow will be higher than the max flow rate limit of the exhaust valve while in the SI engine max flow limit is close to the flow rate limit of the valve during exhaust stroke which may be because of higher pressure. but also, the SI engine has a higher mass flow rate compared to the CI engine.
Also, there is a difference in Brake power, brake torque, and brake-specific fuel consumption. Diesel engine brake efficiency is higher compare to SI engine. In emission, the CI engine has higher NOx emission. While SI engine has higher CO2 emission. HC rate sims to be the same even if the diesel engine is set to turbocharged condition.
Q-2 - Diesel model information
Bore x stroke - 86 x 86
Compression ratio - 16.5 to 19.5
Iitial condition - Pressure 2.5 bar & Temperature 350K
- BSFC
- BSFC is reduced with increasing compression ratio but the reduction is very low (3.5 g/kWh).
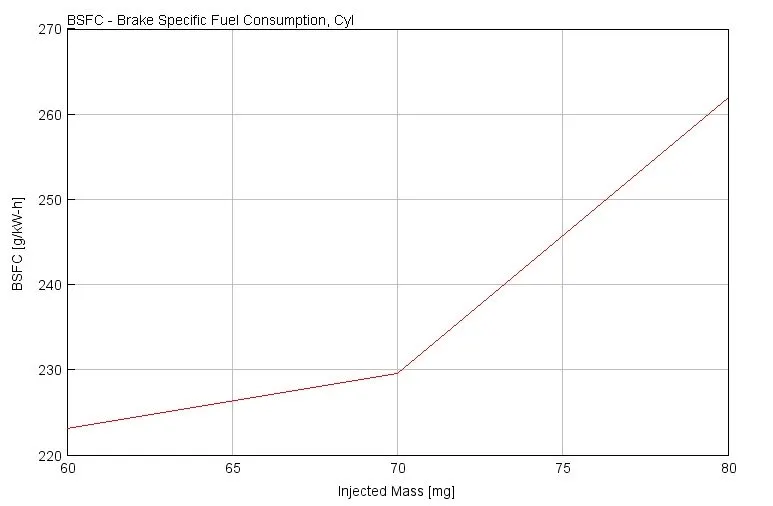
- BSFC increases with an increase in fuel rate at the same RPM, change is high. From 223.14 g/kWh (60mg) to 262 g/kWh (80mg).
- It is noticeable that change in speed doesn't have much effect on BSFC even if the fuel supply rate is constant for all-speed (1800 to 2400 rpm)
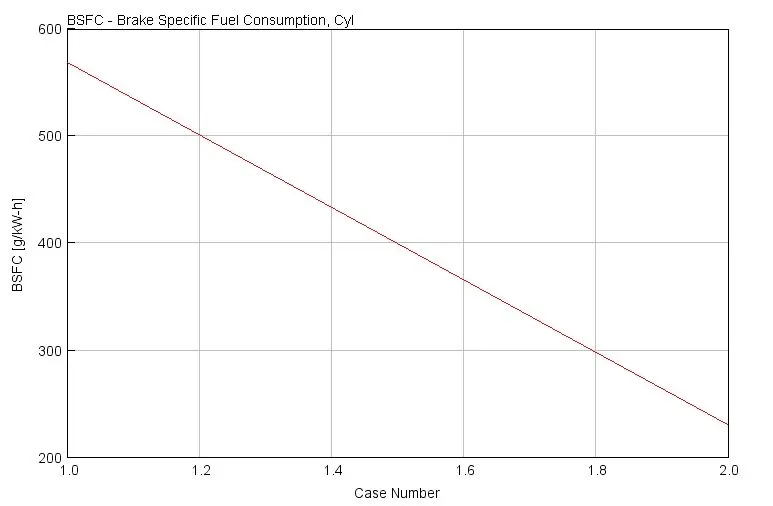
- for change in atmospheric & initial pressure (1 to 2.5 bar) and temperature (298 K to 350 K), BSFC changed drastically from 569.14 to 229.54 g/kWh
- Changing injection duration by 10 deg changed BSFC less than 1%.
- Retarded injection timing (10 deg) increased BSFC for same rpm & referenced condition case. The increase was up to 50 deg.
- Exhaust Temperature
- For exhaust temperature, the average temperature reduction is 17 K when the compression ratio increased from 16.5 to 19.5
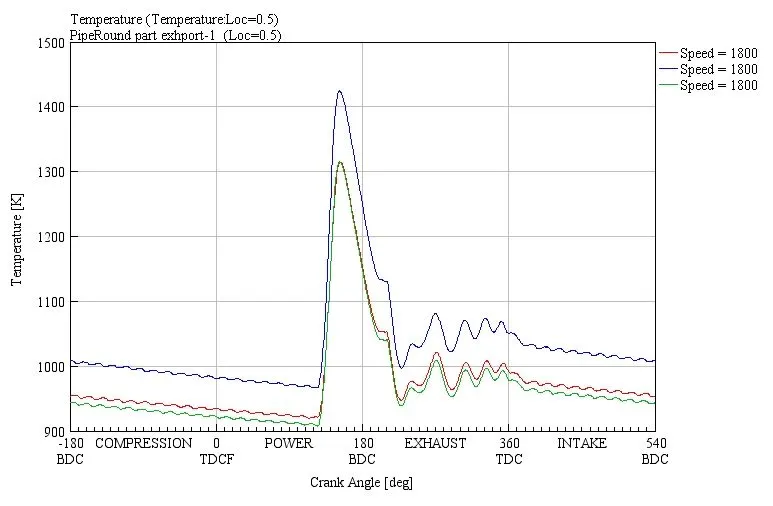
- For fuel injection of 60mg & 80mg, exhaust port temperature is the same but it rises for case 70mg.
- for 1800 to 2400 rpm speed range, exhaust temperature graphs are also similar. even pick temperature value is very close to each other.
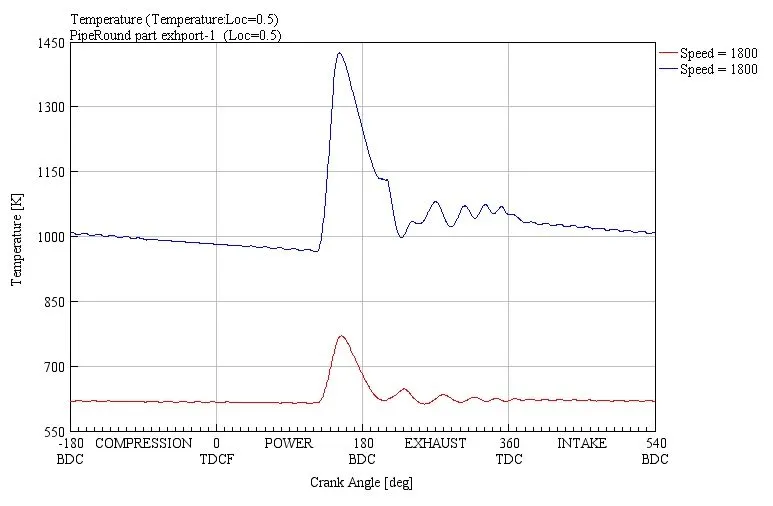
- for change in atmospheric & initial pressure (1 to 2.5 bar) and temperature (298 K to 350 K), Exhaust temperature graph has variation, for atmospheric condition rise in graph is very low while for force aspiration condition rise in temperature very sudden and high during power stroke.
- Injection duration changes don't have an effect on exhaust temperature. for attended changes, it remained within the 2 deg range.
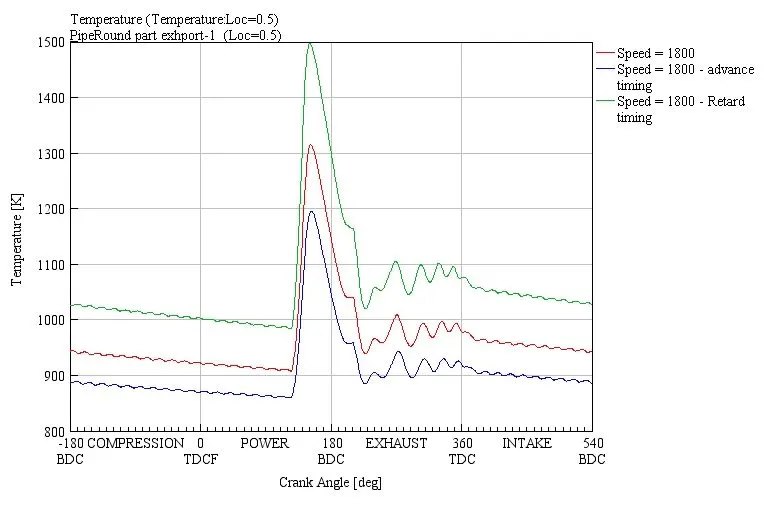
- Injection timing has shown a noticeable change in exhaust temperature with a range of 100 deg for both advanced and retard injection timing.
- A/F ratio
- When the compression ratio changes between 16.5 to 19.5 change in the Air-Fuel ratio (AFR) is negligible, it drops from 12.39 to 12.37.
- AFR reduces if the fuel rate is increased.
- Similar, to BSFC it doesn't much change in AFR for the given speed range.
- for change in atmospheric & initial pressure (1 to 2.5 bar) and temperature (298 K to 350 K), AFR increased from 5.25 to 12.39 (more than double)
- Injection duration doesn't have any effect on AFR.
- AFR doesn't show changes with injection timing
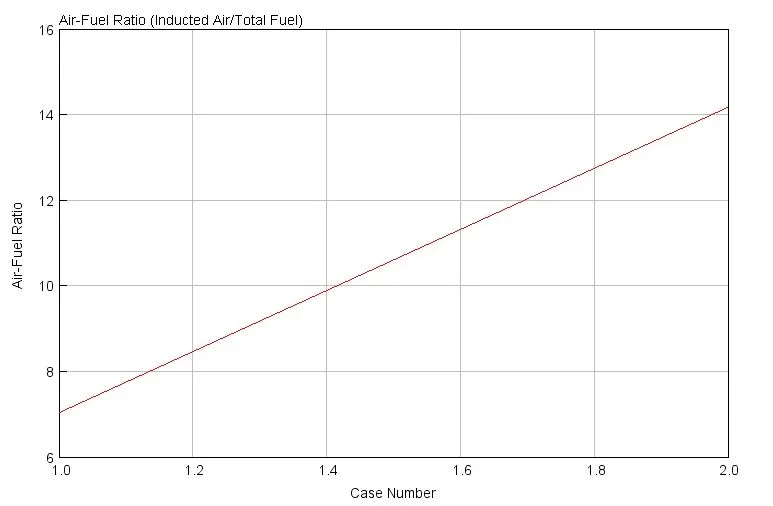
Q-3 - Performance change when MFR is 50.
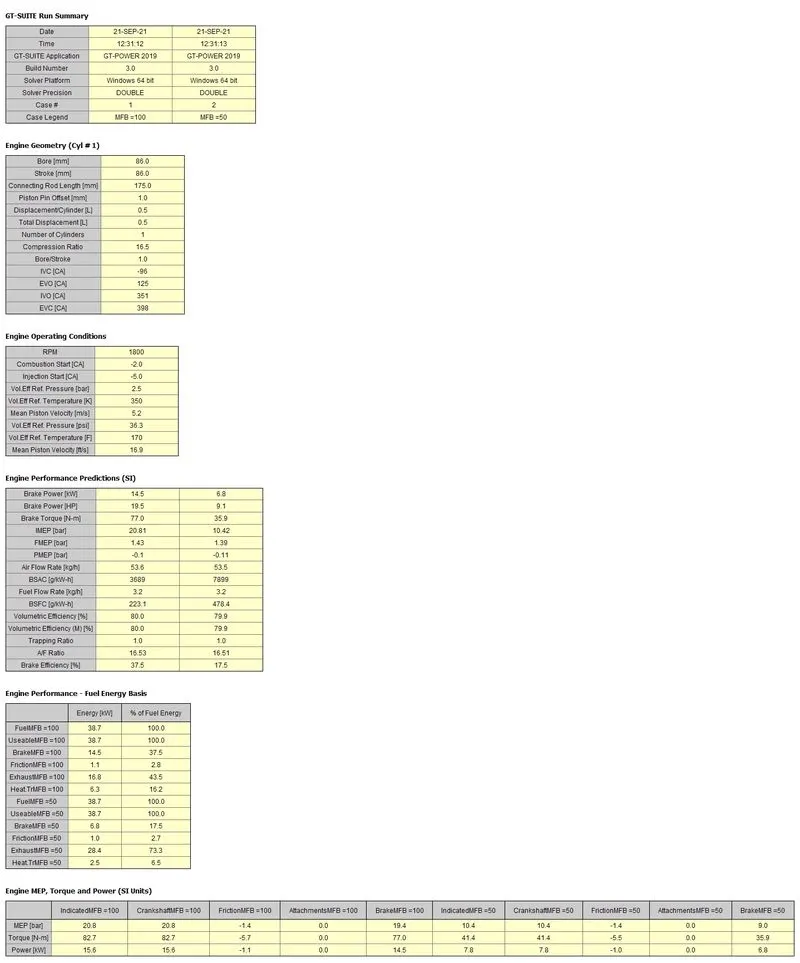
- In performance table it is clear when Fraction of Mass Burn (MFB) is 50, Brake Power, Brake Torque & Efficiency reduce by 50%. Air Flow rate, Vol. efficiency and similarly other outcomes which do not vary by combustion remains same.
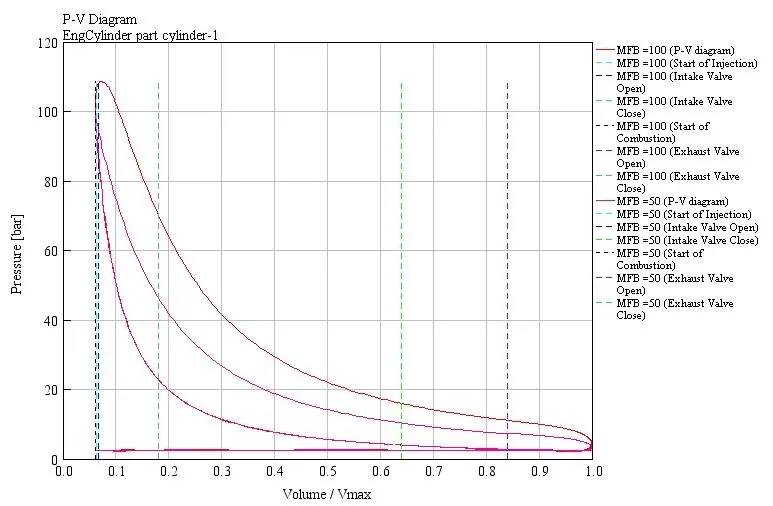
- From the graph, It is observed that Pressure inside cylinder during MFB 50 reduced compare to MFB 100 during Power/Working stroke since MFB 50 has less fuel to burn, workdone will be less as well.
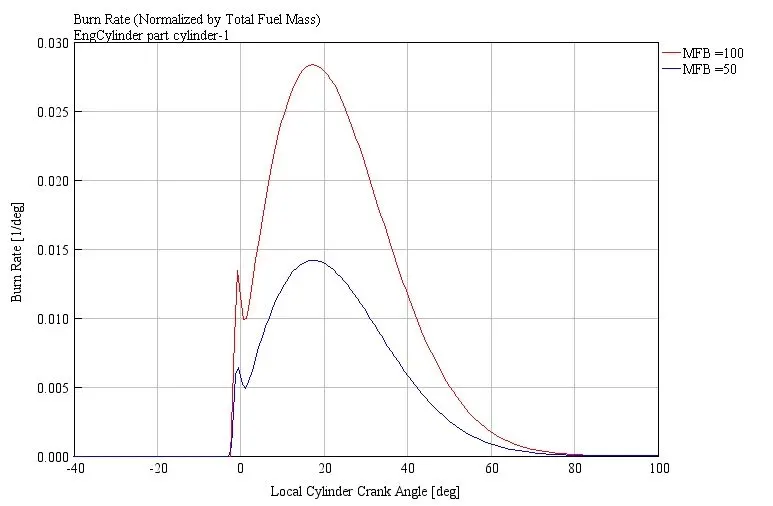
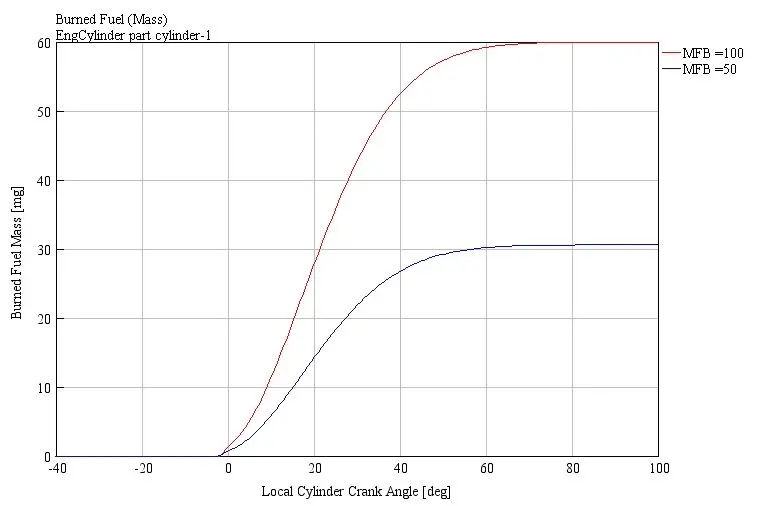
- above 2 graphs, States the reason for the reduction in pressure (work done) as said less fuel burn will lead to less power which is shown in these 2 graphs.
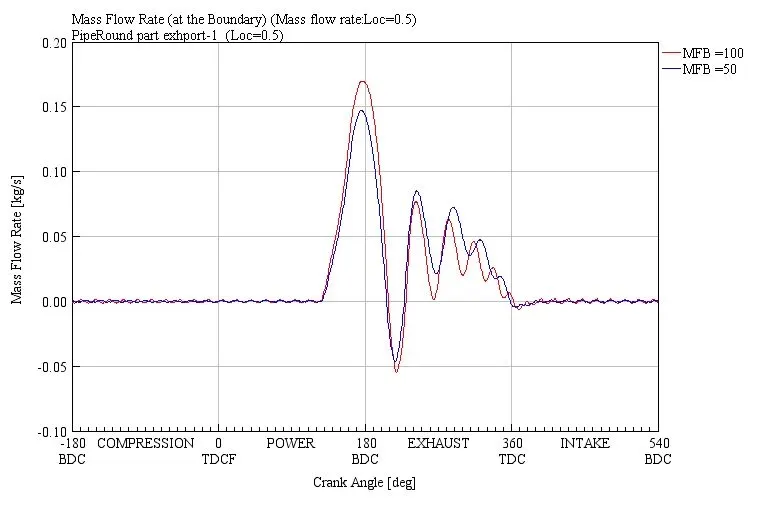
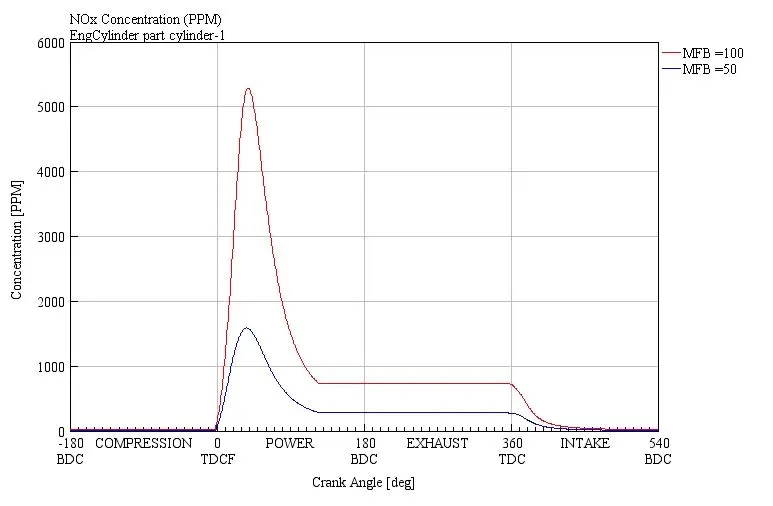
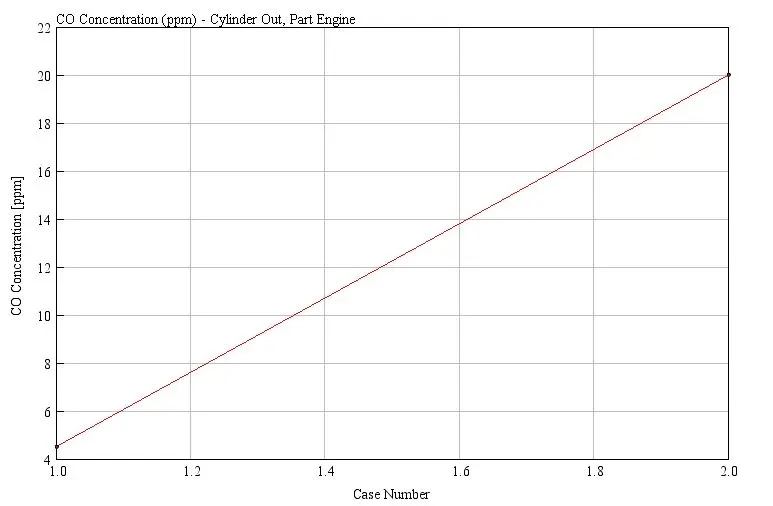
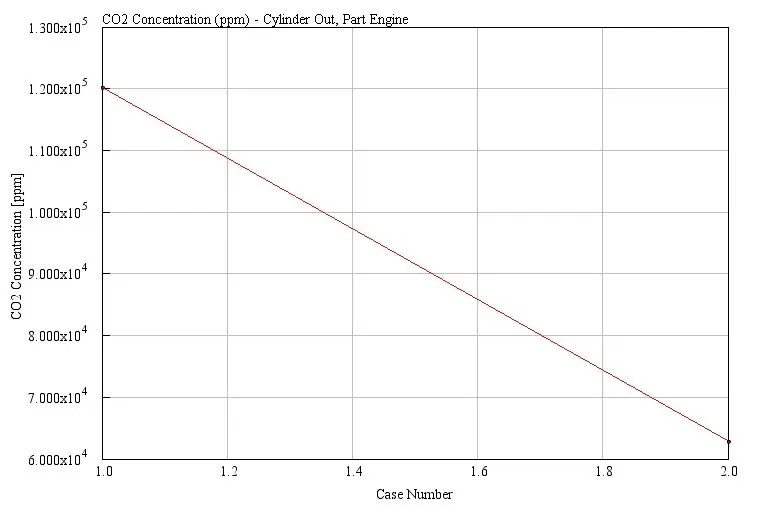
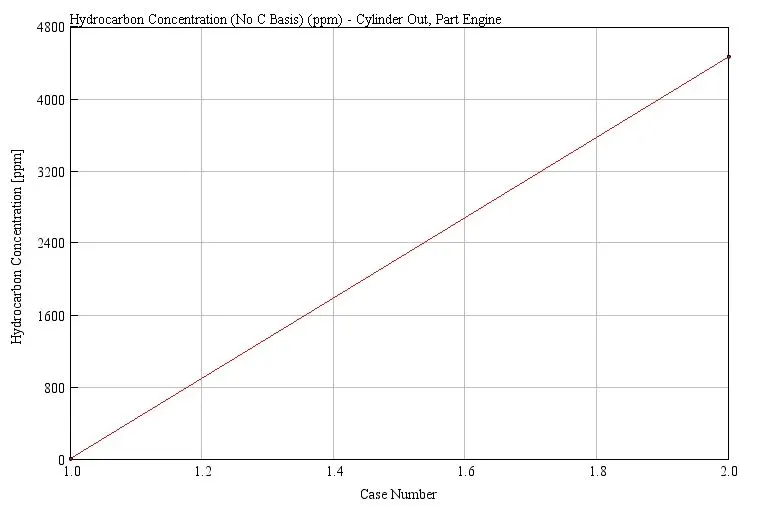
- In terms of emission, results are sims unrealistic according to norms. For MFB observation, at 50% NOx reduced by more than 50% compare to MFB 100. CO concentration increased up to 5 times and CO2 reduced y 50%. also, Hydrocarbons increased drastically.