Week - 4
Q1. Implement control logic of a "washing machine" using Stateflow as per given sequence:
- If the power supply is available, the system gets activated
- If the Water supply is not available, stop the process & indicate through the LED
- The soaking time should be 200 seconds, followed by a washing time of 100 seconds.
- Then rinsing happens for the next 20s & dryer runs for 50s
After all the processes have been completed, turn ON the finished LED.
Ans.
The objective is to implement the control logic for a washing machine using Stateflow. The control logic follows a sequence of steps based on power and water supply availability, executing soaking, washing, rinsing, and drying processes. LEDs indicate the status; a finished LED is turned ON when all processes are completed.
Stateflow Model:
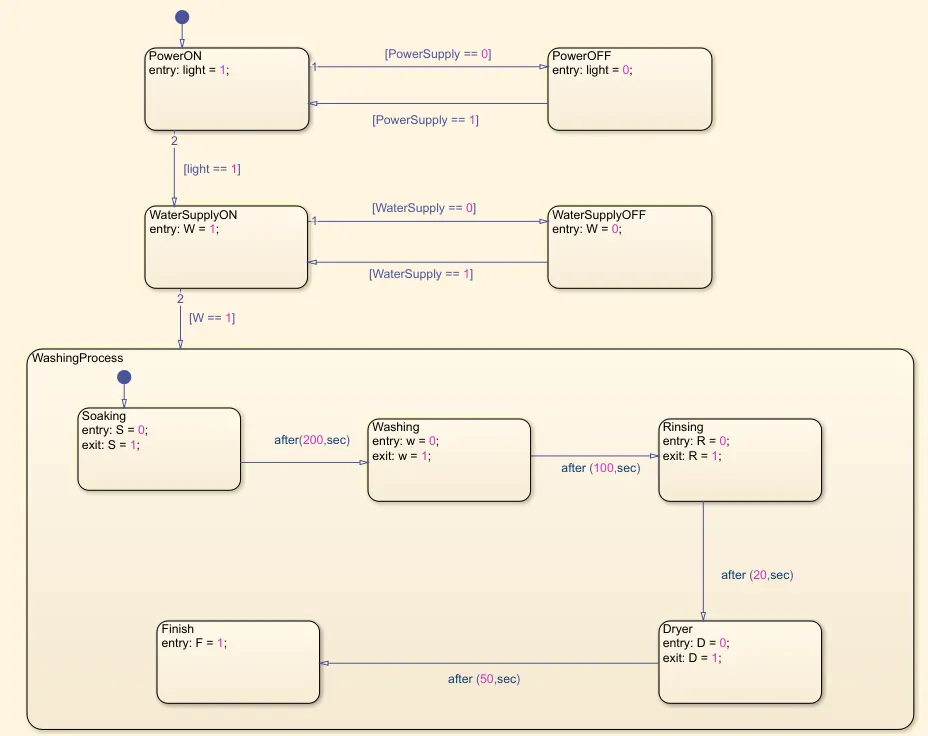
1. Power Available State:
- Transitions to this state when power supply becomes available.
- Checks for water supply.
2. Water Available State:
- Transitions to this state when power supply becomes available.
- Checks for water supply
3. Soaking State:
- Represents the soaking processes for 200 seconds.
- Transitions to the Washing State.
4. Washing State:
- Represents the washing process for 100 seconds.
- Transitions to the Rinsing state.
5. Rinsing State:
- Represents the rinsing process for 20 seconds.
- Transitions to the Finished state.
6. Drying State:
- Represents the drying process for 50 seconds.
- Transitions to the Finished state.
7. Finished State:
- Represents the completion of all processes.
- Turns ON the finished LED.
Control Logic
- The control logic is implemented using the Stateflow charts, where states represent different stages of the washing machine operation, and transitions define the sequence of events.
- LEDs are controlled based on the current state, indicating the washing machine's status.
Simulation
- The Stateflow model was simulated to verify the control logic's correctness and observe the transition and state changes.
- The system progresses through the defined sequence during the simulation based on power and water supply availability.
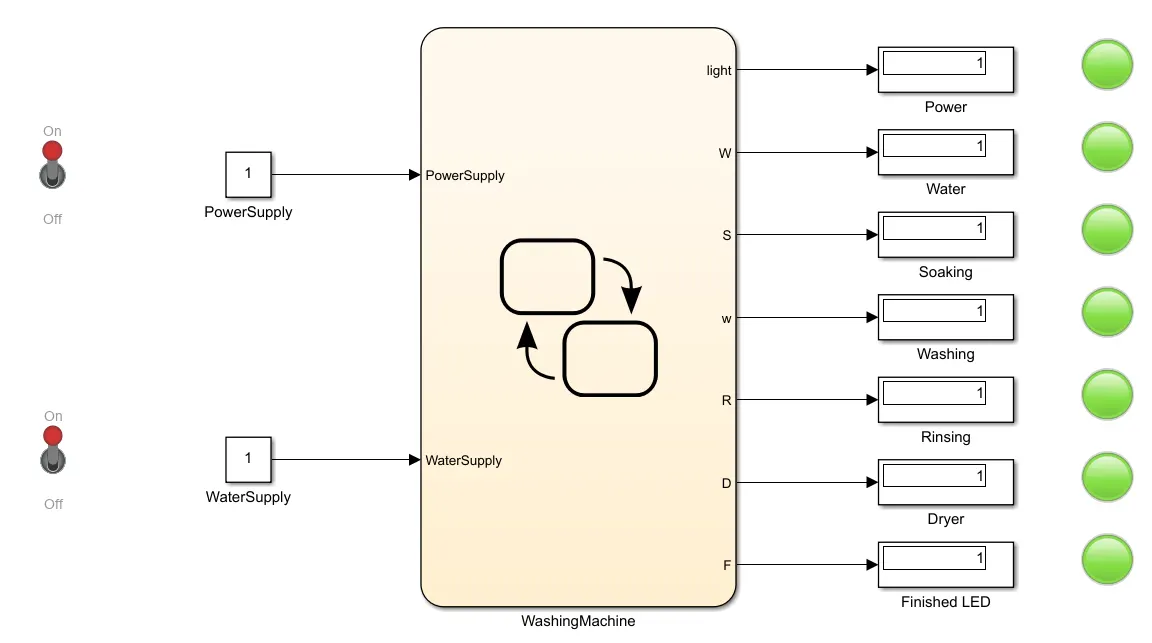
WashingMachine Subsystem
Conclusion
The Stateflow model successfully implements the control logic for a washing machine, managing the sequence of processes, including soaking, washing, rinsing, and drying. LEDs indicate the status at each stage, and a finished LED is turned ON upon completing all processes.
Q2. Make a Simulink chart for the "Gear shift" logic as per the below conditions:
Speed Range(kmph) Gear
0 to 15 1
16 to 25 2
26 to 40 3
41 to 60 4
Above 61 5
Give speed input while the simulation is running & display the gear number.
Ans.
The objective is to implement a gear-shift logic using Simulink, which determines the gear based on the speed range. The conditions for gear shifting were defined as per the provided speed ranges, and the Simulink model was configured to take speed as input during simulation, displaying the corresponding gear number.
Simulink Model
Chart Configuration:
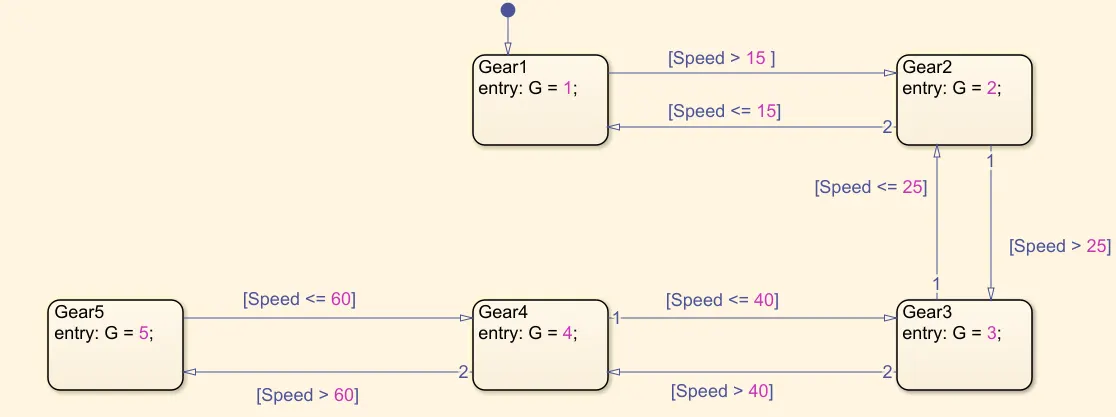
- A Stateflow chart was created in Simulink to implement the gear shift logic.
- The chart consists of states representing different speed ranges and transitions between these states based on the current speed input.
Speed Input:
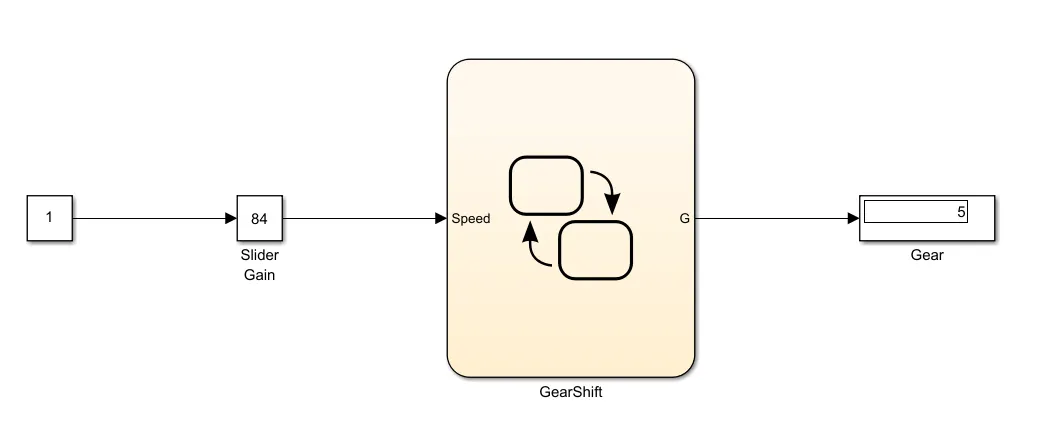
- A Slider block was added to the Simulink model to provide a variable speed input during simulation.
- A Speed input is connected to the Stateflow chart to feed the speed information to the gear shift logic.
Chart States and Transitions:
- Gear1 State (0 to 15 kmph):
- Represents the speed range of 0 to 15 kmph.
- Transitions to Gear 2 state when the speed exceeds 15 kmph.
- Gear2 State (16 to 25 kmph):
- Represents the speed range of 16 to 25 kmph.
- Transitions to Gear 3 state when the speed exceeds 25 kmph.
- Gear3 State (26 to 40 kmph):
- Represents the speed range of 26 to 40 kmph.
- Transitions to Gear 5 state when the speed exceeds 60 kmph.
- Gear4 State (41 to 60 kmph):
- Represents the speed range of 41 to 60 kmph.
- Transitions to gear 5 state when the speed exceeds 60 kmph.
- Gear5 State (Above 61 kmph):
- Represents speeds above 61 kmph.
- No further transitions, as this is the highest gear.
Displaying Gear Number:
The current gear number is displayed as an output from the Stateflow chart. This information can be visualized during simulation using a display block or a scope.
Simulation:
- The Simulink model was simulated with varying speed inputs to observe the transitions between different gear states.
- The output displayed the corresponding gear number based on the current speed.
Conclusion:
The Simulink model successfully implements the gear shift logic based on the provided speed ranges. The chart transitions between gear states, and the displayed output indicates the current gear number corresponding to the input speed.