Week - 4
Aim:
To implement a stateflow chart depicting a control logic of a 'washing machine' as per given sequence:
- If the power supply is available, the system gets activated
- If the Water supply is not available, stop the process & indicate through LED
- Soaking time should be 200s followed by Washing time of 100s.
- Then rinsing happens for next 20s & dryer runs for 50s
After all the processes have completed turn on the finished LED
Process :
1. Firstly we have to set the stateflow starting with the state 'Supply' which is governing the next state by the condition supply==1, which if is supply==0, does not proceed forward.( Thus signifying the power supply for the machine).
2. Secondly, we have to set the second state as 'Water', governing the next state by the condition water==1, which if is water==0, does not proceed forward.( Thus signifying the water supply for the machine).
3. This completes our stateflow chart start, as the chart is now dependent on the binary input that we provide to it at the beginning, thus having the control of the stateflow as per desired. This is actually an error i faced while simulating and modelling the chart, as the chart did not stop for the power supply or water supply input to be given and ran as and when the model was simulated.
4. Next, we will define the rest of the states soaking, washing, rinsing, drying and finish, by separating them with the after condition and specifying the number of seconds by which of these states are to be separated and assign a binary 1 value to each of the variables A,B,C,D and E which define each of these states started up whenever that state is reached. We are going to set A,B,C, and D as 0 when state finish is reached, so that only finish variable is turned to value 1 and suggesting the rest of the processes are completed.
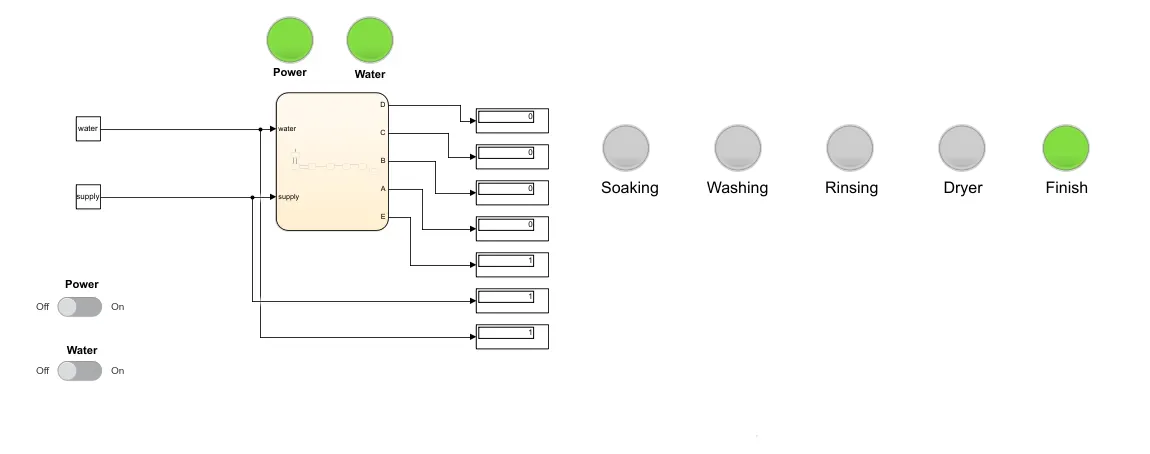
5. We, are going to set the values of supply and water as input data in the symbol pane and the rest of our variables as output data and assign the state variables to displays.
6. The supply and water will be switched on and off by slider switch outside the chart and the input of supply and water will be rerouted to their respective display block showcasing the binary value of the same.
7. The same routing of the outputs of the chart will be done to different display blocks respectively.
8. Finally, all the display blocks shall be connected to different lamps connected to each display block glowing green when process starts or is happening and no glow if the process is yet to be started.
9. The lamps for supply and water, shall be turned red when off thus showing the importance of starting the switch for the process to begin.
Aim :
Make a Simulink chart for the “Gear shift” logic as per below conditions:
Speed Range(kmph) Gear
0 to 15 1
16 to 25 2
26 to 40 3
41 to 60 4
Above 61 5
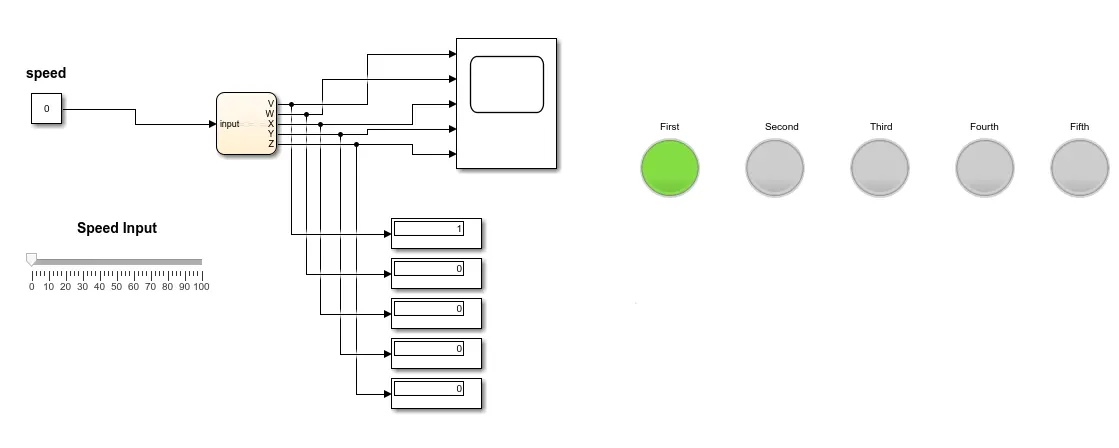
Give speed input while the simulation is running & display the gear number.
Process :
1. The stateflow here will have one input which will be supplied through a constant block, and is governed by a slider gain or slider which is set between inputs 0-100 .
2. The stateflow will be 5 states depicting the gears and the range for the gears will be given by applying the condition as input more or less (< or >) than the value for the stateflow to return to the same gear or the next or the previous gear depending upon the range of the gear.
3. The states shall have 2 links between them, one going away and one toward the preceeding state from the next state, thus giving the condition of acceleration and decelaration as and when the input rises or decreases.
4. In each of these states, a variable is defined and set to value one which are also going to be the outputs of the chart and will be later connected to different display blocks and these displays are connected to respective lamps to showcase the state being processed or in this case the gear.