Project 1 - Parsing NASA thermodynamic data
Intro to the dataset :
NASA came up with polynomials that can be used to evaluate thermodynamic properties such as Cp, H and S. They have also documented the co-efficients that are required to evaluate these polynomials for the 53 species.
The coefficients accompanied with the species also contain the specified low, mid and high temperature ranges, wherein our 14 coefficients for each species individually come into picture.
The first set of 7 coefficients that are supplied below the name of the particular species shall help us determine the Cp, H and S value for the low to mid temperature range and the next 7 coefficients similarly help us to calculate these terms for the mid to high temperature range.
The formulae are shown below.
Here R is the universal gas constant, T is the temperature
Using the same set of formulas, by substituting the corresponding value of the 1-7 coefficients with the next set 8-14 coefficients, we will be able to output our desired parameters.
Aim :
1. Write a function that extracts the 14 co-efficients and calculates the enthalpy, entropy and specific heats for all the species in the data file. Also use the LOCAL TEMPERATURE RANGES which is unique for each individual species, not the GLOBAL TEMPERATURE RANGE.
2. Calculate the molecular weight of each species and display it in the command window.
3. Plot the Cp, Enthalpy and Entropy for the local temperature range (low temperature : high temperature) specific for each species.
4. Save the plots as images with appropriate names and dump them in separate folders for each species with suitable name. All these should be generated automatically.
5. The main program that you will submit will just take the "THERMO.dat" file as an input and generate Cp, H and S plots.
6. Please write a detailed report to describe your logic.
Required dataset :
https://drive.google.com/file/d/1AikCHDlz9s_fu8whE81qee_GD4AyYpCP/view?usp=sharing
Basic Procedure to begin with :
In the following code which is called as file parsing, we basically choose to read or write the file depending upon what our point of application needs. Therefore, as this code requires us to only take the inputs from the main dataset rather than us inputting any particular values to our code ourselves as string values and manipulate these values as per our calculations and code requiremens demand, we shall be using some parsing commands with respect to extracting the coefficients and the temperature ranges.
Initially, we will take these local temperature values for the species and the coefficient values and then use them to formulate the Cp, H and S and plot each of them with respect to temperature.
After this, we shall introduce a few commands to help the code create a folder into a defined target directory where it shall save the plots we created, into each folder titled with the name of the respective species.
Upto this point, if we see, we also need to calculate the molecular weight of each species as well, which has to take place during the same loop iteration as the parametric calculation and plot commands.
Therefore, our initial step shall be to be create a for loop and place all these commands into one for loop and by subdividing the for loop into multiple for loops (if needed) to complete our objectives.
The file parsing program :
clear all
close all
clc

% Defining the value for the gas constant
R = 8.314;

% fopen to begin parsing the datafile by specifying the name
f2 = fopen('THERMO.dat','r')

% To skip the initial 5 lines of the datafile
for i=1:5
    fgetl(f2);
end

    % For parsing the 53 species
for i = 1:53
    % Assigning the first line to extract the species name and local
    % temperature ranges
    tline = fgetl(f2);
    B = strsplit(tline,'  ');
    % Extracting the temp range from the right in order to simplify the iterations

    high_temp(i) = B(end-2);
    mid_temp(i) = B(end-1);
    low_temp(i) = B(end-3);

    % Storing the string values as numerical values for further
    % operations/calculations to be possible
    HIGH_temp(i) = str2num(high_temp{i});
    MID_temp(i) = str2num(mid_temp{i});
    LOW_temp(i) = str2num(low_temp{i});

    % We use T(linspace) to ease out the further calculation part and the automatic
    % assignment of T value as input for our smoother code operation

    T = linspace(LOW_temp(i),HIGH_temp(i),150);
        U = fgetl(f2);
        % Using findstr to navigate the extraction of the coefficient
        % through the character "E"
        V = findstr(U,'E');
        W = fgetl(f2);
        X = findstr(W,'E');
        Y = fgetl(f2);
        Z = findstr(Y,'E');

        % Assignment of the coefficient values to variables
             a1 = str2num(U(1:V(1)+3));
             a2 = str2num(U(V(1)+4:V(2)+3));
             a3 = str2num(U(V(2)+4:V(3)+3));
             a4 = str2num(U(V(3)+4:V(4)+3));
             a5 = str2num(U(V(4)+4:V(5)+3));
             a6 = str2num(W(1:X(1)+3));
             a7 = str2num(W(X(1)+4:X(2)+3));
             a8 = str2num(W(X(2)+4:X(3)+3));
             a9 = str2num(W(X(3)+4:X(4)+3));
             a10 = str2num(W(X(4)+4:X(5)+3));
             a11 = str2num(Y(1:Z(1)+3));
             a12 = str2num(Y(Z(1)+4:Z(2)+3));
             a13 = str2num(Y(Z(2)+4:Z(3)+3));
             a14 = str2num(Y(Z(3)+4:Z(4)+3));

              if T <  MID_temp(i)
              Cp =  R*(a8 + a9.*T + a10.*T^2 + a11.*T^3 + a12.*T^4);
              H = (a8 + a9.*T/2 +(a10.*T.^2)/3 +(a11.*T.^3)/4 + (a12.*T.^4)/5 +a13./T)*R.*T;
              S = (a8.*log(T) + a9.*T + (a10.*T.^2)/2+ (a11.*T.^3)/3 + (a12.*T.^4)/4 + a14)*R;

              else
                  Cp =  R*(a1 + a2.*T + a3.*T.^2 + a4.*T.^3 + a5.*T.^4);
              H = (a1 + (a2.*T)/2 +(a3.*T.^2)/3 +(a4.*T.^3)/4 + (a5.*T.^4)/5 +a6./T)*R.*T;
              S = (a1.*log(T) + a2.*T + (a3.*T.^2)/2+ (a4.*T.^3)/3 + (a5.*T.^4)/4 + a7)*R;

              end
              % Calling the cell containing the species name and converting
              % the cell value to matrix values
              str = cell2mat(B(1));
              % Introducing the element intials for string comparison and
              % their weights for molecular weight calc.
              s = ["H" "O" "C" "N" "A"];
              Mol_wt = [1,16,12,14,40];
              Mol_mass=0;
              for j=1:length(str)
                  for k=1:length(Mol_wt)
                      if  strcmp(str(j),s(k))
                        Mol_mass = Mol_mass + Mol_wt(k);
                        position = k;
                        end
                      end
                     % To add up the molecular weight of multiple atoms present in
                     % the species
                      number = str2double(str(j));
                      if number > 1
                         Mol_mass = Mol_mass + Mol_wt(position)*(number-1);

                  end

              end
              % For outputing the molecular weight of the species
              sprintf("The molar mass of %s is %d g/mol",str,Mol_mass)
              % Creating the folder in the specified directory
              targetdirectory = 'C:\Users\User\Desktop\';
              foldername = fullfile(targetdirectory, sprintf('%s',str));
              mkdir(foldername);

              %Going in to the folder of the species to save the plots
              cd(foldername)


              figure(1)
              plot(T,Cp)
              title(['Specific heat vs temperature plot for ',str])
              xlabel('Temperature')
              ylabel('Specific heat')
              saveas(gcf, 'Cp.png');

              figure(2)
              plot(T,H)
              title(['Enthalpy vs temperature plot for ',str])
              xlabel('Temperature')
              ylabel('Enthalpy')
              saveas(gcf, 'H.png');

              figure(3)
              plot(T,S)
              title(['Entropy vs temperature plot for ',str])
              xlabel('Temperature')
              ylabel('Entropy')
              saveas(gcf, 'S.png');
              cd ..
end
Explaining the file parsing commands :
fopen = This command helps us to navigate into the main datafile that has our needed inputs considering that the datafile is in the same folder as our main code. f2 is the variable that works as a file handle and should always be a positive value to validate that the file reading has been done right! As for the 'r' written in the fopen command, we have 2 options to either write into or read from the file. Thus, 'w' or 'r'.
fgetl(f2) = This command lets us parse the file line by line and does not have any parameter to call the immediate needed line or set of values(string). Therefore, as the fgetl command assigns a new line each time, we thus use it to parse each value line by line. Initial 5 lines containing the intro part of the datafile are of no use in our code and hence we create a for loop to skip the intial 5 lines. f2 as specified works as a file handle by pointing to our main file.
strsplit = As we see, we have saved our 6th line (after skipping first 5 lines and running the first iteration) as tline and we use strsplit to split the string on the basis of the input ' ' which is nothing but the spaces between the values of the string (the base splitter can be anything else depending on how or where you would want to split the string). As our first line in the iteration shall contain the temperature ranges and the species name, we further use this assignment values (B) to extract our temperatures and also the species name.
str2num = This command is mainly used to change the unoperatable string values to operational numerical values for further calculations. As in this case, the temperature values.
Next, we use the T=linspace for our code to take in the temperatures automatically through linspace thus giving us a complete plot or calculation for almost every interval of T from low temp to high temp.
findstr = Next, in order to extract the coefficients from the next 3 set of lines, we have used fgetl first to get the line, we then have used findstr, which basically takes in two inputs, one being the str value and the other the value or char to be found. Once executed, findstr returns the positions of the value or char specified ("E" in this case), and thus we can extract our coefficients from the three set of lines.
Having extracted the coefficients, we first store them into different variables named upon the coefficient number, and hence take the use of the findstr handle variables to return the value of these variables and also convert them by using str2num for further calculations.
Using these set of values, we now create a for loop, with an underlying if else statement bifurcating the two calculation formula on the basis of the temperature being assigned to T being lower or higher than mid temp. That allows the program to understand which set of 7 coefficients need to be considered for the calculation.
After the calculation we now consider the calculation of the molecular weights of the species for which first, we have to get the individual molecular weight of each atom present in our species which will be then summed up to give our final molecular weight of the species. To do this we have created an array of the atoms and corresponding weights into an other similar dimensioned array.
Further we use, cell2mat command to convert a cell value to a mat value just to be able to separate the individual characters in the species for easy identification. We extract the data from B(1) as shown in the code, as it contains the name of the species being the first value from the first line on the species string.
Now, we use a command called strcmp which compares two inputed strings or more if needed, to return the value in logical format (0 or 1) based on whether or not the original string contains the other input value or not.
To make the use of this, we first formulate a for loop for the full length of the species,so that each value in the species string can be used for comparison, and next we another for loop allows the strcmp to take in all the 5 atoms specified, each one at a time for comparison, to check each value of string perfectly.
We then, on the basis of if statement on the logical output of the strcmp, determine whether the weight of each atom must be added to the molecular weight of the species or not. If an atom is present, we save the corresponding value of the atom in the array 's' as position.
In the next loop, we shall check for numbers in the species, for adding up more weight into the molecular weight of the species if there are more than 1 atoms in the species which are not specified as alphabetical values.
Therefore we use str2double here, as str2double is a much better option over str2num as it allows to take more optioins and works on every kind of variable be it char, cell etc an also returns the desired set of values in contrast to str2num.
Using str2double, we first store the returned value into variable 'number', and set an if statement. Then we input the molecular weight calculation command, such that the molecular weight of the immediate preceeding the atom in the species is used, by using 'position' to not disturb the iteration variable and multiply it by (number-1) to compensate for the already calculated atom preceeding the number in the species.
Next, I have used sprintf to print our value of species and molar mass of the species using %s and %d in the command window. In contrast we also have fprintf but that is used in order to write into the file and not onto the output screen.
The next set of commands are :
targetdirectory : To specify which directory needs to be pointed for the code to create a folder
foldername : This helps the code to take in the value of the name of the folder hence created by using %s which is our species name and assigns it to foldername.
mkdir(foldername) creates the folder with the name 'foldername' ( in our case '%s') and cd(foldername) allows the code to go into the newly created folder.
Next, we input commands for our plots of specific heat vs temperature, enthallp vs temperature, and entropy vs temperature. We use the saveas command next, to save the current figure titled either Cp.png or H.png or S.png which creates a png file of it saves it into the current directory.
Errors faced :
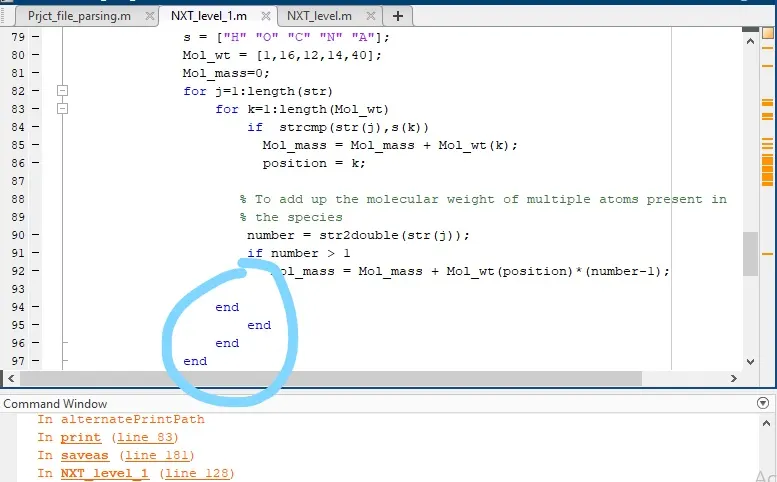
This error caused the program to output the wrong molar mass for the species by having ignored the numerical values in the species because of improper usage of end commands.
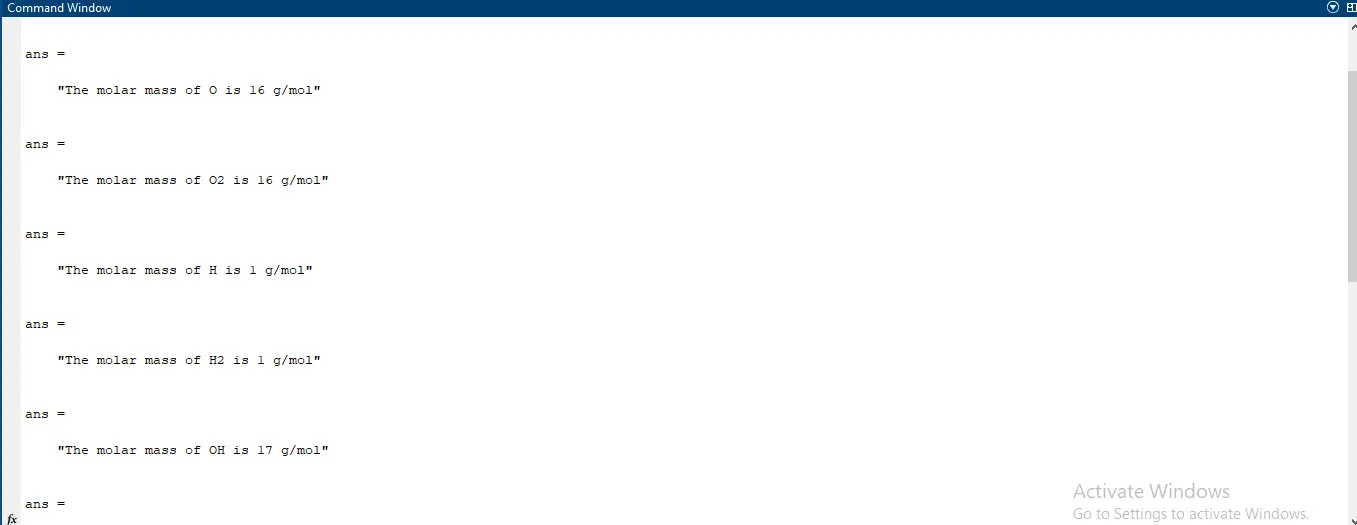
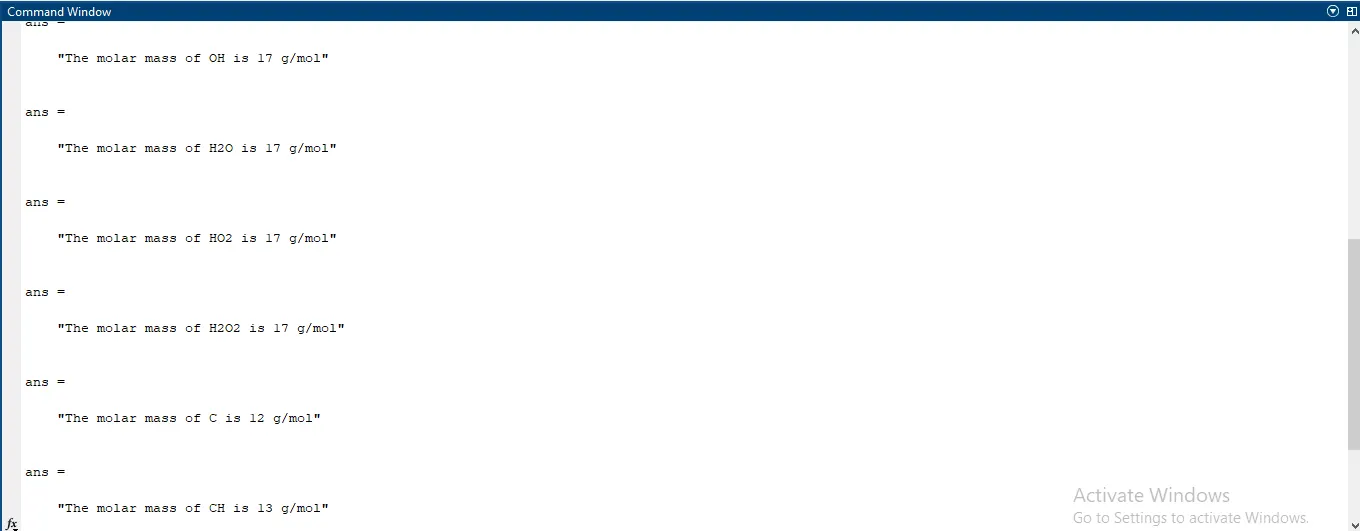
Error 2:
Used the for loop for Temperature and hence got just single calculations of each parameters Cp, H and S recorded. Therefore no plot could be created.
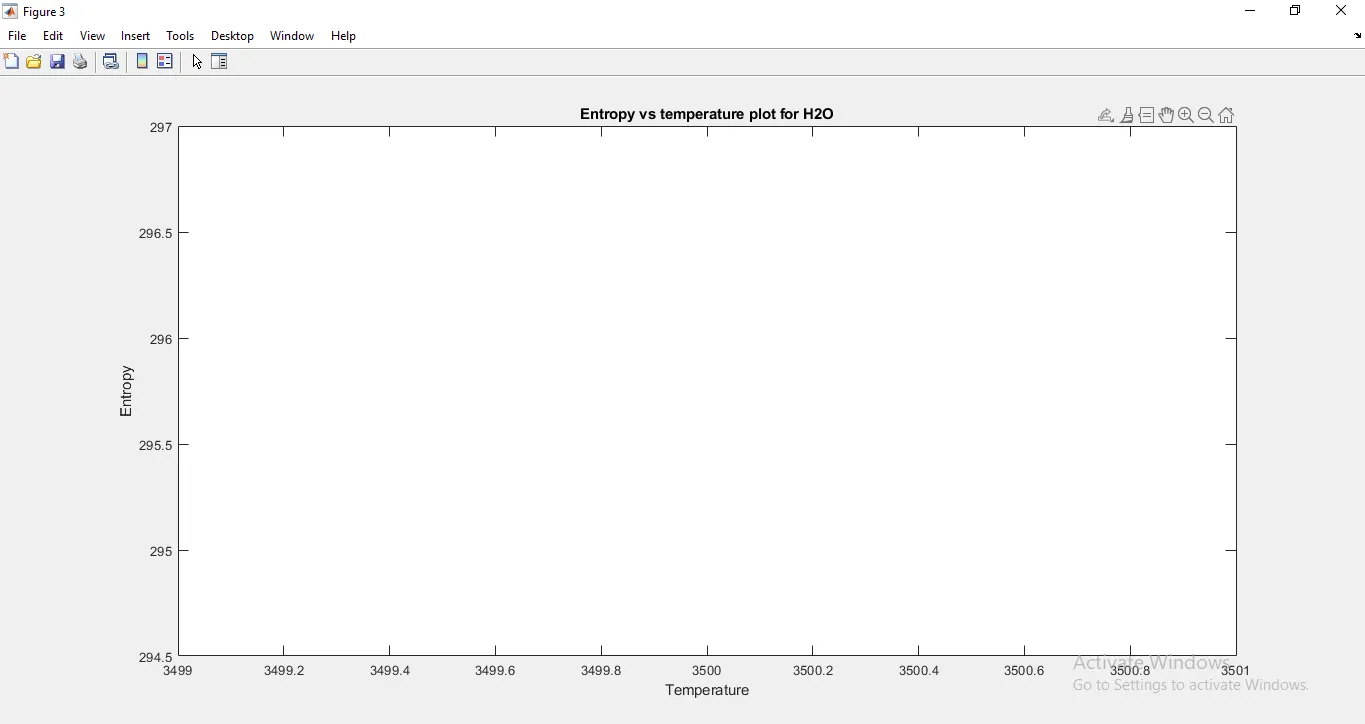
Error 3 :
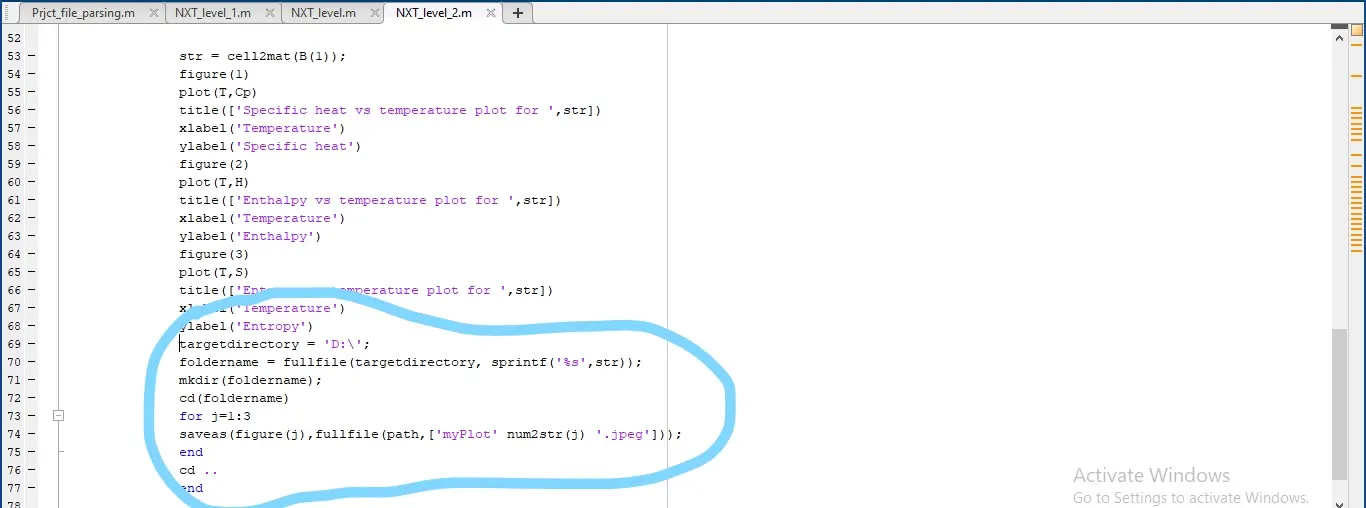
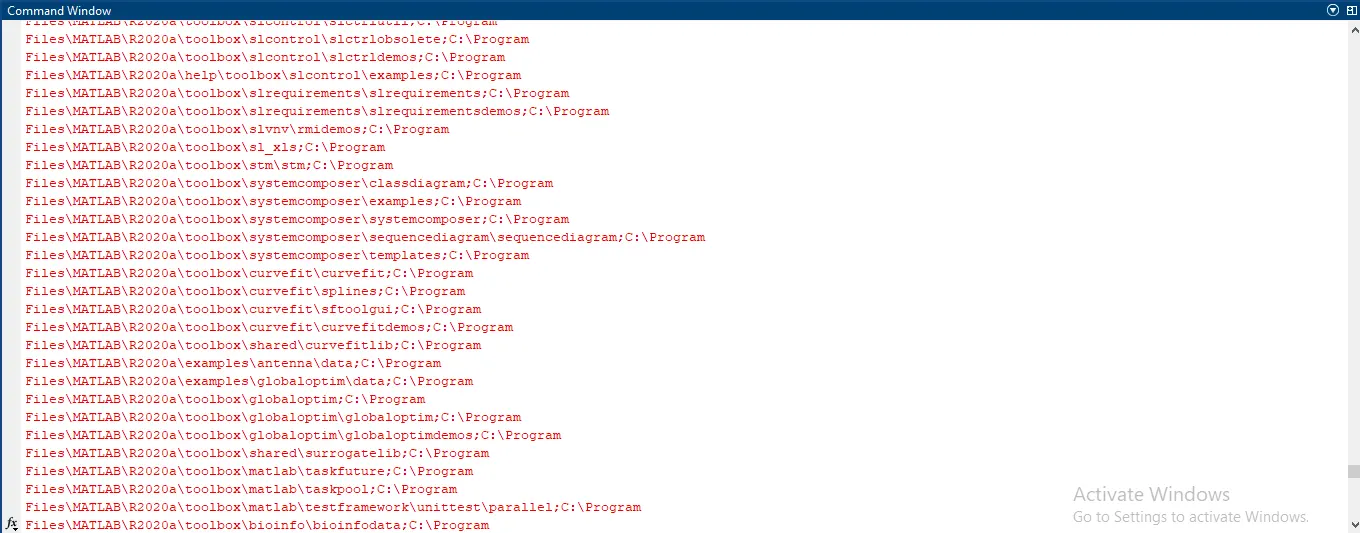
Using the improper command for saving the plots into the folder gave the following error and caused the program to stop abruptly.
Conclusion :
Therefore, after doing this program, i came to know how some unused commands can be used for file parsing and how without giving any parametric inputs, we can just read from a pre-existing file and manipulate the content to our specifications. The concept and commands to create a folder, and save files into the foler by even manipulating the title name was also seen. We could understand from our application as to how str2num contrasts with str2doublw command. Finally while making the plots for Cp, H and S we see the use of two sets of coefficients which specifies the use of splitwise method for best fit operation, and thus giving us a better idea to achieve a more conditioned and better output.
References :
https://www.webqc.org/molecular-weight-of-CH2CHO.html
https://in.mathworks.com/help/matlab/ref/fprintf.html
https://in.mathworks.com/help/matlab/ref/sprintf.html
https://in.mathworks.com/matlabcentral/answers/80765-how-to-split-letters-in-a-word-into-an-array
https://in.mathworks.com/matlabcentral/answers/73306-save-figures-to-one-folder