Week - 4
1.To implement the control logic of a washing machine using stateflow in simulink.
a.if the power supply is available,the system gets activated.
b.if the water supply is not available,stop the process &indicate through LED.
c.soaking time should be 200s followed by washing time of100s.
d.then rinsing happens for next 20s & dryer runs for 50s.
After all the processes have completed turn on the finished LED.
SIMULINK MODEL :
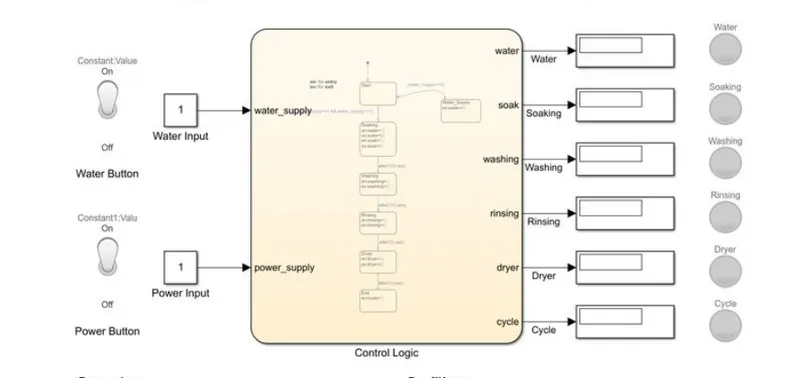
BLOCKS USED IN THE MODEL ARE :
Switch,Constant,Charts,Display and Lamp .
Parameters :
1.value '1' means there is input of 1.
2.value '0' means there is no input.
Conditions :
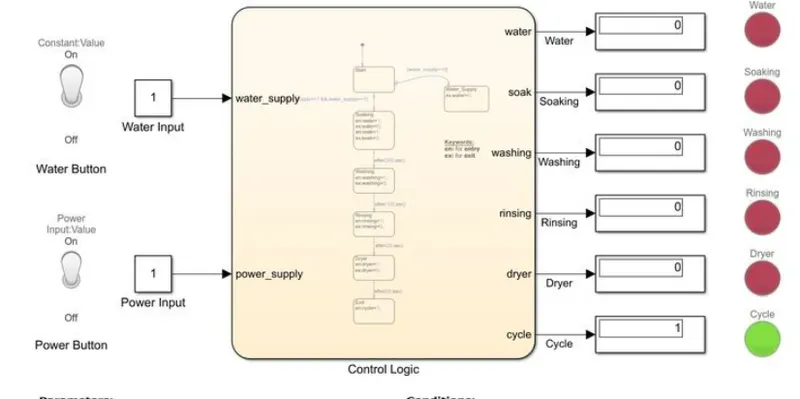
1.When lamp shows green,then the task is in progress.
2.When the lamp shows red, the task ends.
Chart blocks :
Sequence of operations required for washing -
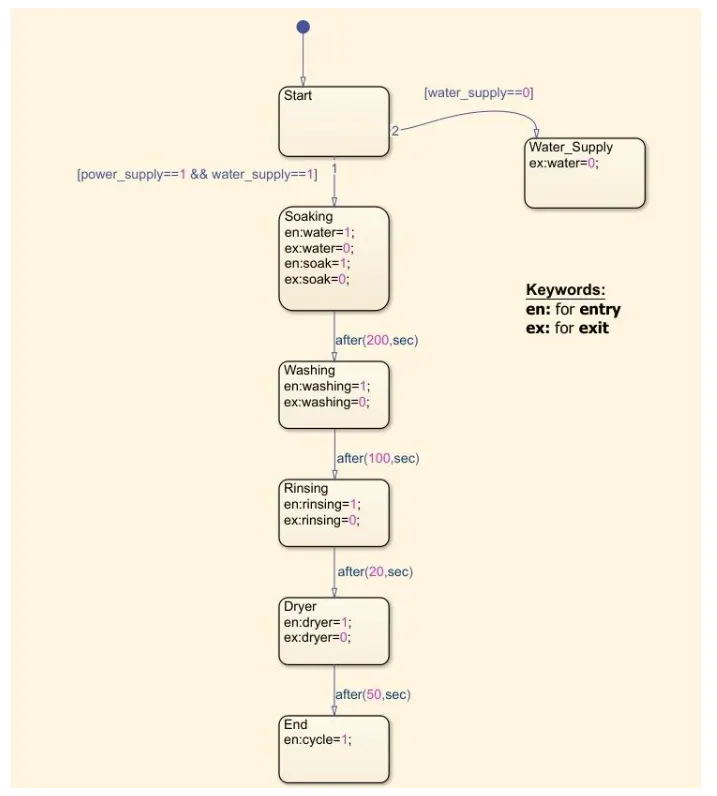
The above chart represents the step by step operations of washing.
Parameters of symbolic plane :
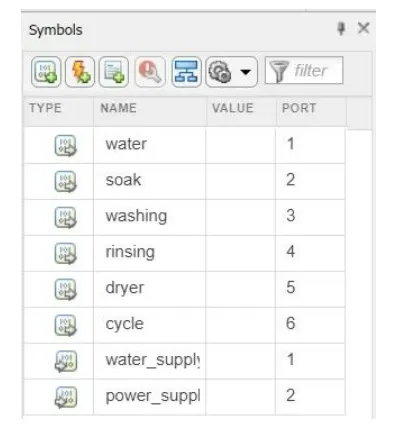
The above parameters are the sequence of the washing such as water,washing,rinsing,dryer,cycle as outputs of the chart.
And the water_supply & power_supply as inputs of the chart.Used 430 sec so that it can cover whole cycle and sufficient time to start and solve the parametrs.
In the question two states are given
State 1 : When water supply is OFF -
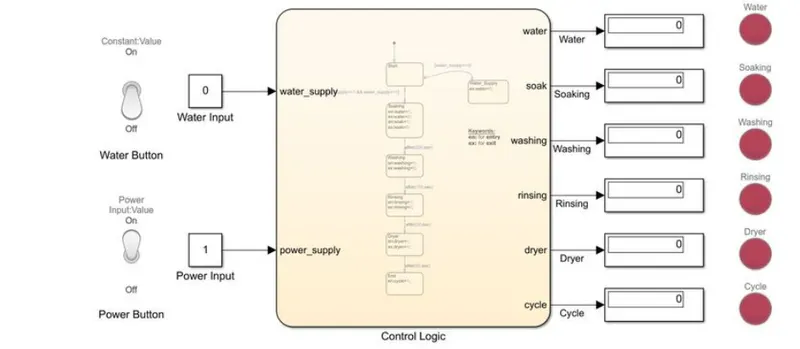
Parameters :
1.value '1' means there is input of 1.
2.value '0' means there is no input.
Conditions :
1.When lamp shows green,then the task is in progress.
2.When the lamp shows red, the task ends.
From the above model ,the indicator of water is showing red.When there is no water supply the process is terminated and LED indicator is used to indicate that state.
State 2 : When water supply is ON -
Parameters :
1.value '1' means there is input of 1.
2.value '0' means there is no input.
Conditions :
1.When lamp shows green,then the task is in progress.
2.When the lamp shows red, the task ends.
In the above model the water supply is ON, then all states of the model had executed and the process completes indicater cycle last stage in the chart shows the green signal.
2. To make a simulink chart for the Gear shift for the below mentioned parameters :
Speed Range (kmph) Gear
0 to 15 1
16 to 25 2
26 to 40 3
41 to 60 4
Above 61 5
SIMULINK MODEL OF GEAR SHIFT :
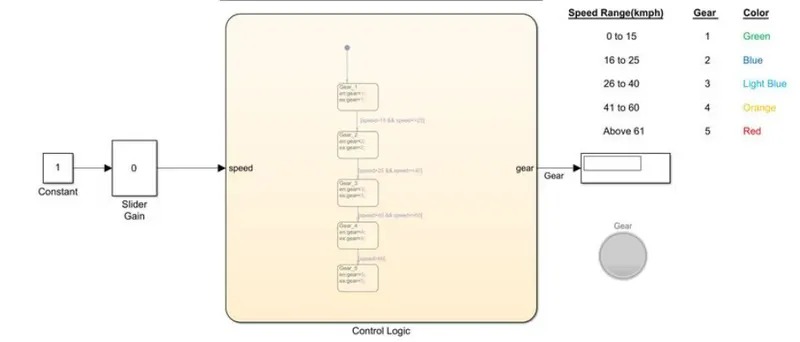
The above simulink model represents the gear shift.
BLOCKS USED IN THE MODEL ARE :
Constant ,Slider gain ,Charts & Display ,Lamp.
CHART DIAGRAM :
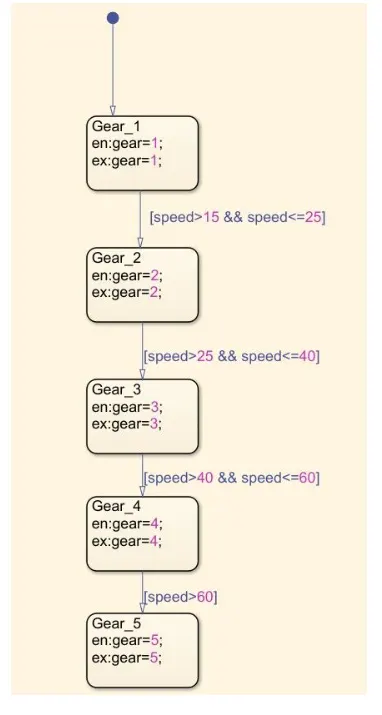
The above chart shows the sequence of shifting gears according to their speed.
PARAMETERS OF SYMBOLIC PLANE :
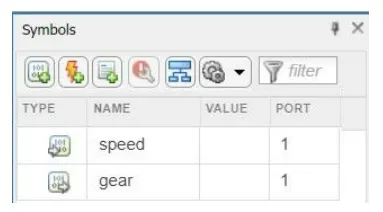
The above mentioned are the parametrs of speed and gear as input and output of the chart.
Simulation running time can be stopped by us by using slider gain by making a constant required time to run.
SLIDER GAIN AS INPUT :
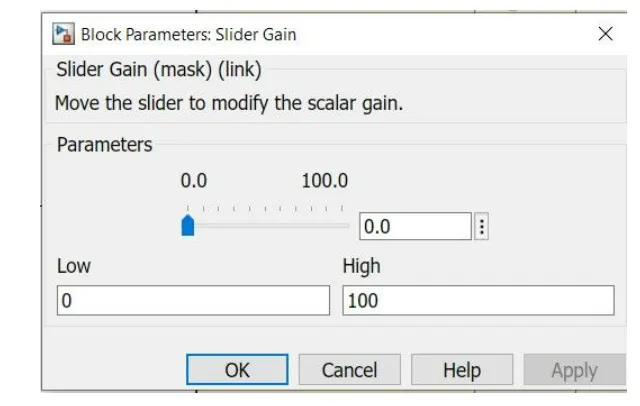
The slider gain is used to provide input to the chart and changing the speed values from 0 to 100 using slider gain during simulation.
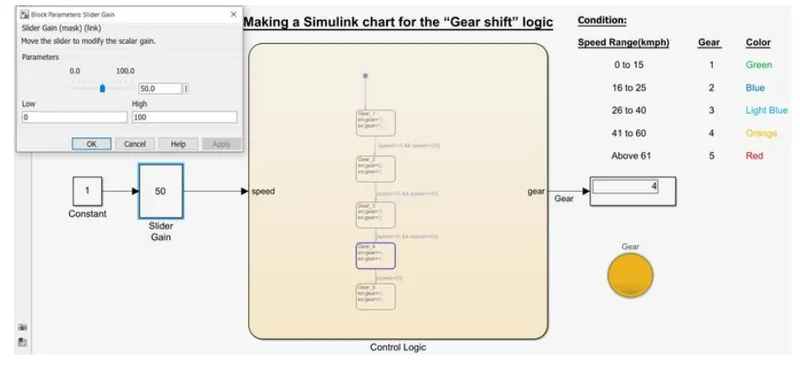
OUTPUT OF THE MODEL GEAR SHIFT :
The output produced is recorded in display for each gear shift.
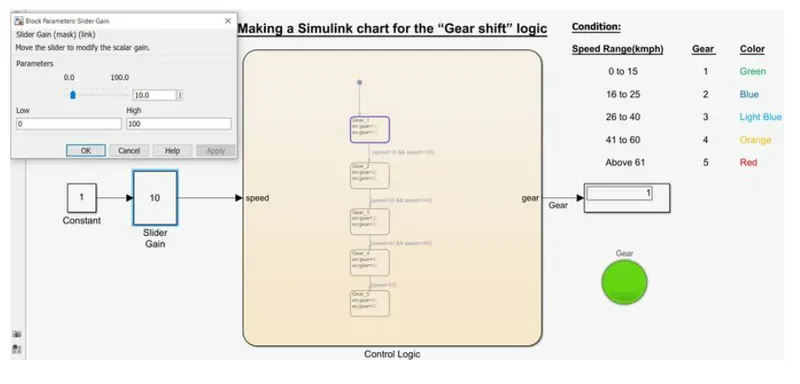
Gear 1:
Speed range : 0 to 15 kmph.
input speed : 10 kmph.
color : green.
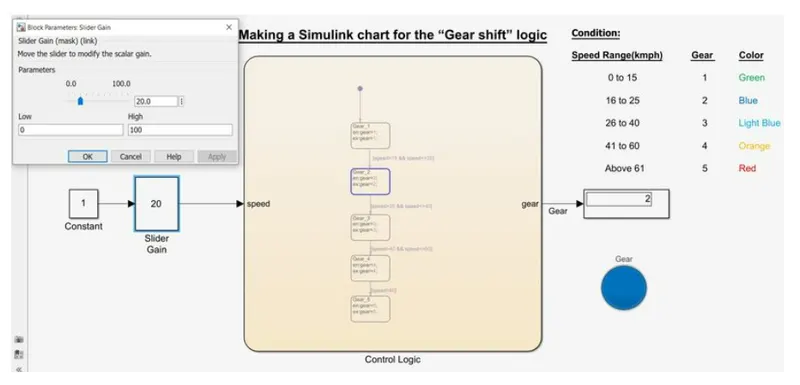
Gear 2:
speed range : 16 to 25 kmph .
input speed : 20 kmph .
color : blue.
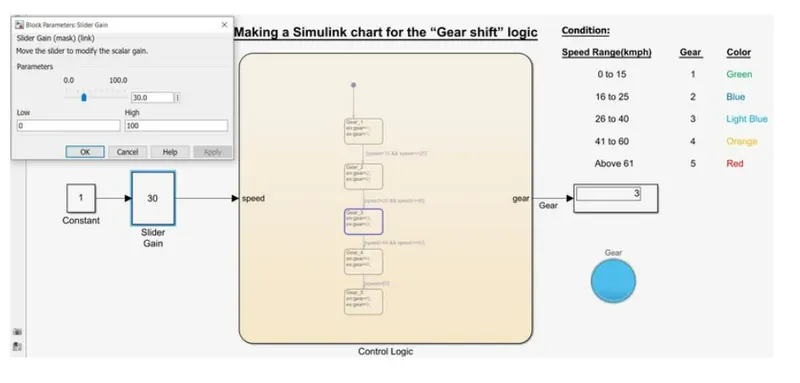
Gear 3:
Speed range : 26 to 40 kmph.
input speed : 30 kmph.
Color : light blue.
Gear 4:
Speed range : 41 to 60 kmph.
input speed : 50 kmph.
Color : orange.
Gear 5:
Speed range : Above 60 kmph.
input speed : 80 kmph.
Color : red.
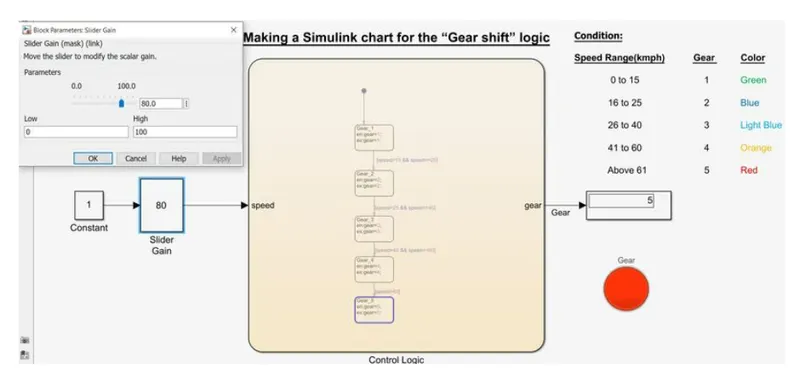
These are the above gear shifts described with speed range and input speed and color.