Week 4.1 - Genetic Algorithm
Code to stalagmite function and to find global maxima of the function.
Program - 1.
clear all
close all
clc

% defining our search space
x = linspace(0,0.6,150);
y = linspace(0,0.6,150);

% creating 2-dimensional mesh
[xx,yy] = meshgrid(x,y);

% evaluating the stalagmite function

for    i = 1:length(xx)
    for j = 1:length(yy)
        input_vector(1) = xx(i,j);
        input_vector(2) = yy(i,j);
        f(i,j) = stalagmite(input_vector);
    end
end

    surfc(xx,yy,f)
    shading interp
    xlabel('x value')
    ylabel('y value')
  [inputs,fval] = ga(@stalagmite,2);
The above program is used to create a stalagmite function by passing the input array as the argument for the variables x and y.The output is obtained by using the function.
clear all ,close all,clc commands are used.
clear all command clears all the data in the workspace.
close all command closes all the plots which are generated during the program.
clc command clears all data in command window.
2-Dimensional mesh is created by using meshgrid(x,y).
Two loops are used in the program
first loop is for the xx variables ,counter i = 1:length(xx) is taken
second loop is for the yy variables,counter j = 1:length(yy) is taken
two inputs are there in second loop, input_vector-xx,yy.
surfc command is used for gettinng smooth plot.
shading interp is used for the plot to get clear plot.
Plot - 1.
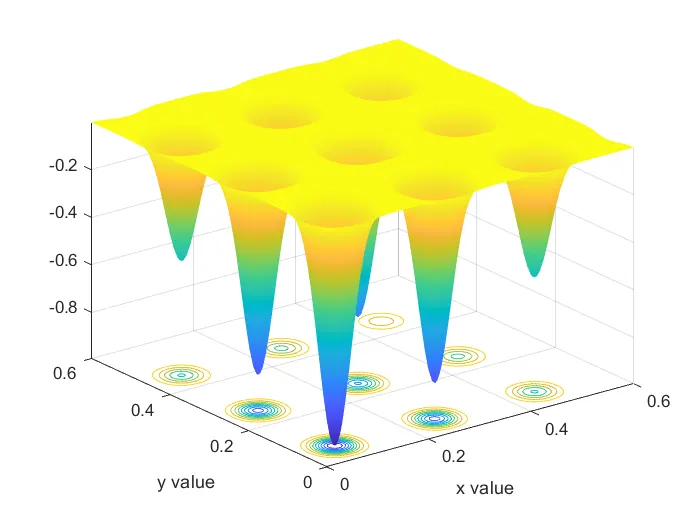
The above 3-D plot shows the x and y values of the program.
Program - 2.
function [f] = stalagmite(input_vector)
x = input_vector(1);
y = input_vector(2);
f1 = (sin(5.1*pi * x +0.5))^6;
f2 = (sin(5.1*pi * y +0.5))^6;
f3 = exp(-4*log(2)*(x-0.0667)^2/0.64);
f4 = exp(-4*log(2)*(y-0.0667)^2/0.64);
f = -(f1*f2*f3*f4);
end
The above function of stalagmite is created by using the formulaes of the stalagmite which are provided.
Negative sign is used for getting the maximizing values of stalagmite.
Program - 3.
% code to find the global maxima of the stalagmite function
clear all
close all
clc

x = linspace(0,0.6,150);
y = linspace(0,0.6,150);

num_cases = 50;

% creating 2-dimensional mesh
[xx,yy] = meshgrid(x,y);

% evaluating the stalagmite function

for    i = 1:length(xx)
    for j = 1:length(yy)
        input_vector(1) = xx(i,j);
        input_vector(2) = yy(i,j);
        f(i,j) = stalagmite(input_vector);
    end
end

    surfc(xx,yy,f)
    shading interp
  [inputs,fval] = ga(@stalagmite,2);

% study 1 statistical behaviour
tic

for i = 1:num_cases
    [inputs,fopt(i)] = ga(@stalagmite,2);
    xopt(i) = inputs(1);
    yopt(i) = inputs(2);
end
study1_time = toc

figure(1)
subplot(2,1,1)
hold on
surfc(xx,yy,-f)
shading interp
plot3(xopt,yopt,-fopt,'marker','o','MarkerSize',5,'MarkerFaceColor','r')
title('Unbounded inputs')
subplot(2,1,2)
plot(-fopt)
xlabel('Iterations')
ylabel('Functiob minimum')

% study2 - with lower and upper bounds


tic

for i = 1:num_cases
    [inputs,fopt(i)] = ga(@stalagmite,2,[],[],[],[],[0;0],[0.4;0.4]);
    xopt(i) = inputs(1);
    yopt(i) = inputs(2);
end

study2_time = toc

figure(2)
subplot(2,1,1)
hold on
surfc(xx, yy, -f)
shading interp
plot3(xopt,yopt,-fopt,'Marker','o','MarkerSize',5,'MarkerFaceColor','r')
title('Bounded inputs')
subplot(2,1,2)
plot(-fopt)
xlabel('Iterations')
ylabel('Function minimum')


%study 3  increase in GA

options = optimoptions('ga')
options = optimoptions(options,'PopulationSize',200)

tic

for i = 1:num_cases
    [inputs,fopt(i)] = ga(@stalagmite,2,[],[],[],[],[0;0],[0.4;0.4],[],[],options)
    xopt(i) = inputs(1)
    yopt(i) = inputs(2)
end
study3_time = toc

figure(3)
subplot(2,1,1)
hold on
surfc(xx,yy,-f)
shading interp
plot3(xopt,yopt,-fopt,'Marker','o','MarkerSize',5,'MarkerFaceColor','r')
title('Bounded inputs with increase in ga')
subplot(2,1,2)
plot(-fopt)
xlabel('Iterattions')
ylabel('Function minimum')
Concept of Genetic Algorithm :
A genetic algorithm(GA) is a method of solving both constrained and unconstrained optimization problems based on a natural selection process that mimics biological evolution.
The algorithm repeatedly modifies a population of individual solutions.
The above program gives the global maxima .
Study-1.
The program in study-1 is for statistical behaviour of the unbounded inputs.
inputs and fopt are the outputs of the GA.
xopt is the input(1)
yopt is the input(2).
50 number of cases are considered in the program.
From the starting of the loop 1:num_cases of i are taken into the program.
Two subplots are created to get global maxima,first plot shows the unbounded inputs and second plot shows the iteratons.
Genetic algorithm is used for getting the optimum solutions.
fopt is taken in negative sign for maximizing ,converting the values of stalagmite function stored in the arrray.
tittle command is used for creating tittle for the plot.
syntax of GA = ga(@stalagmite,2).
tic and toc is used for getting the study time.
In this program we are not able to get the global maxima ,because of the unbounded inputs.
Study - 2.
The study - 2 programs deals with the statistical behaviour of the bounded inputs.
Two subplots are created for the program,for 3D and iterations.
tic and toc is used for getting the study time of the bounded inputs.
syntax of GA = ga(@stalagmite,2,[],[],[],[],[],[]),
tittle command is used for creating tittle for the plotss.
In the program global maxima is obtained at the three points and it is not actual global maxima of the bounded inputs.
Study - 3.
The global maxima is obtained by increasig the populationsize upto 200 and it takes more time for getting the global maxima.
And the time taken by this program is more compared to other two programs.
The global maxima is obtained by increasing the GA of the bounded inpuuts,
syntax of GA = ga(@stalagmite,2,[],[],[],[],[],[],[],[],options,)
Two subplots are created for the plot, 3D and Iterations.
optimoptions are used in the program for population increasing.
STUDY 1 Statistical Behaviour of the Unbounded inputs.
PLOT 1
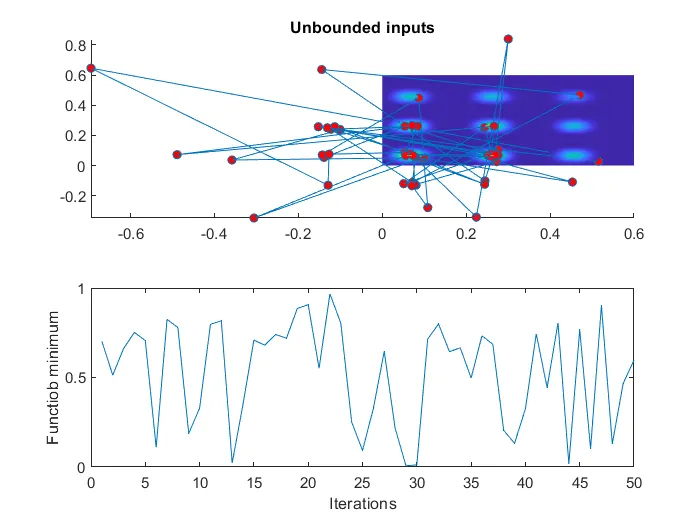
The above plot shows the unbounded inputs stalagmite function.
STUDY 2 Statistical Behviour of Bounded inputs
PLOT 2
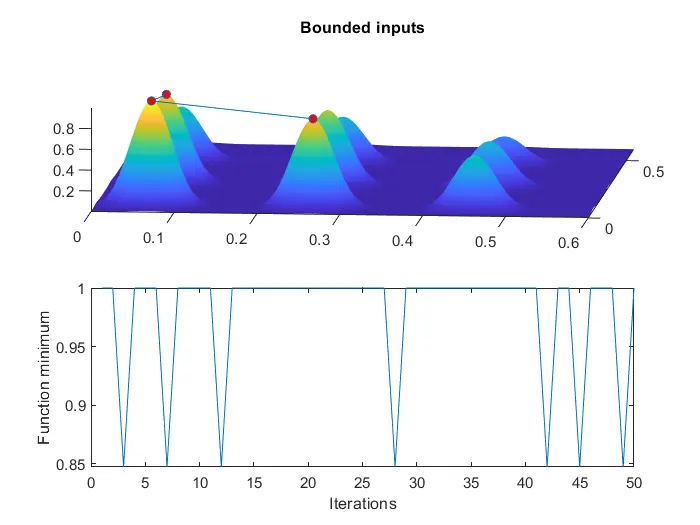
The above plot represents the bounded inputs of the stalagmite function ,with three global maxima points ,it is not the accurate plot of global maxima.
STUDY 3 Statistical Behaviour of Bounded inputs with increase in GA
PLOT 3
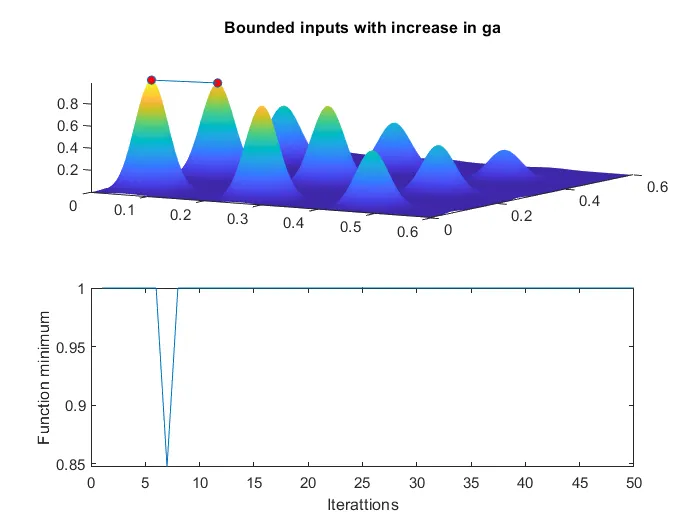
The above plot represents the global maxima of the stalagmite function.
WORKSPACE.
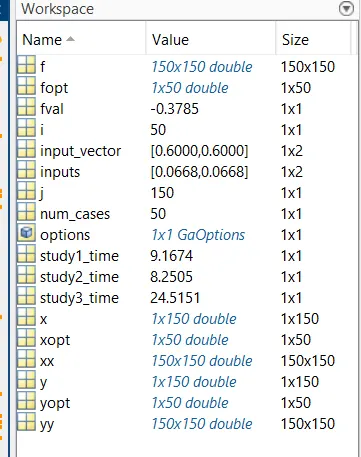
All the output values of the program are stored in the workspace.
ERROR.

The above error occured due to the invalid input to the fopt .
The error can be elimated by giving the input fopt(i) .
References:
1.https://in.mathworks.com/help/matlab.
2.https://en.wikipedia.org/wiki/Genetic_algorithm.
3.https://projects.skill-lync.com.