Project 1 - Parsing NASA thermodynamic data
Program on NASA thermodynamic data file to find 14 coefficients,Enthalpy,Entropy and Specific heat.
clear all
close all
clc

% R = universal gas constant
R = 8.314;

% to open file
f1 = fopen('THERMO.dat','r')

% to read lines

line1 = fgetl(f1);
line2 = fgetl(f1);

value = strsplit(line2,' ');

% to get global temperatures
global_low_temp = str2num(value{2})
global_mid_temp = str2num(value{3})
global_high_temp = str2num(value{4})

% temperature range
T = linspace(global_low_temp,global_high_temp,1000);

% these lines are not recognised
line3 = fgetl(f1);
line4 = fgetl(f1);
line5 = fgetl(f1);

% Reading species,calculating specific heat ,enthalpy,entropy and plotting

for i = 1:53
    tline = fgetl(f1);
    A = strsplit(tline,' ');
    name_of_species = (A{1});
    lowtemp = str2num(A{end-3});
    midtemp = str2num(A{end-2});
    hightemp = str2num(A{end-1});

    % finding 7  higher coefficients and 7 lower coefficients
    tline1 = fgetl(f1);
    a = findstr(tline1,'E');

    a1 = tline1(1:a(1)+3);
    a1 = str2num(a1);
    a2 = tline1(a(1)+4:a(2)+3);
    a2 = str2num(a2);
    a3 = tline1(a(2)+4:a(3)+3);
    a3 = str2num(a3);
    a4 = tline1(a(3)+4:a(4)+3);
    a4 = str2num(a4);
    a5  = tline1(a(4)+4:a(5)+3);
    a5 = str2num(a5);

    tline2 = fgetl(f1);
    a = findstr(tline2,'E');

    a6 = tline2(1:a(1)+3);
    a6 = str2num(a6);
    a7 = tline2(a(1)+4:a(2)+3);
    a7 = str2num(a7);
    a8 = tline2(a(2)+4:a(3)+3);
    a8 = str2num(a8);
    a9 = tline2(a(3)+4:a(4)+3);
    a9 = str2num(a9);
    a10 = tline2(a(4)+4:a(5)+3);
    a10 = str2num(a10);

    tline3 = fgetl(f1);
    a = findstr(tline3,'E')

    a11 = tline3(1:a(1)+3);
    a11 = str2num(a11);
    a12 = tline3(a(1)+4:a(2)+3);
    a12 = str2num(a12);
    a13 = tline3(a(2)+4:a(3)+3);
    a13 = str2num(a13);
    a14 = tline3(a(3)+4:a(4)+3);
    a14 = str2num(a14);

    %calculating specific heat(cp),Enthalpy(H),Entropy(S)
    Cp = Specific_heat(a1,a2,a3,a4,a5,a8,a9,a10,a11,a12,T,R,global_mid_temp);
    H = Enthalpy(a1,a2,a3,a4,a5,a6,a8,a9,a10,a11,a12,a13,T,R,global_mid_temp);
    S = Entropy(a1,a2,a3,a4,a5,a7,a8,a9,a10,a11,a12,a14,T,R,global_mid_temp);


    % calculating molecular weight and printing of it
    Molecular_weight = wt(name_of_species);
    fprintf('molecular weight of %s = %fn',name_of_species,Molecular_weight);


    cd(pwd)
    % creating folder
    mkdir(name_of_species);
    cd(name_of_species)


    % plotting T vs Cp

    figure(1)
    plot(T,Cp,'linewidth',3,'Color','g')
    pause(0.5)
    xlabel('Temperature(T)')
    ylabel('Specific heat(Cp)')
    grid on
    title(name_of_species)
    saveas(figure(1),'specific heat.jpg');

    % plotting T vs H
    figure(2)
    plot(T,H,'linewidth',3,'Color','r')
    pause(0.5)
    xlabel('Temperature(T)')
    ylabel('Enthalpy(H)')
    title(name_of_species)
    saveas(figure(2),'Enthalpy.jpg');

    % plotting T vs S
    figure(3)
    plot(T,S,'linewidth',3,'Color','b')
    pause(0.5)
    xlabel('Temperature(T)')
    ylabel('Entropy(S)')
    title(name_of_species)
    saveas(figure(3),'Entropy.jpg');
    cd('c:\Users\vinay\OneDrive\Documents\MATLAB\\nasa files\')


end
Parsing Data - In Matlab parsing is defined as reading an m- file (Thermo data) and translating it into an internal code that it stores in memory.
>R is universal gas constant.T is temperature.
>We use a command to open the 'THERMO.dat'.
>Next we use 'fgetl' to read the lines and after reading first two lines,from second line we have global temperatures by using 'fgetl' these temperatures gets represented ,but these temperatures are in strings
by using 'num2str' they are converted into numbers.Global_low_temp,global_mid_temp and global_high_temp are the temperatures from 'THERMO.dat'.
>Then we use 'fgetl'command to skip next three lines.
>Local temperature is represnted by 'tline' and 'findstr(tline1,'E')' is used to find the coefficients of the species.
>There are total 53 species are present in 'Themo.dat'.All the 14 coefficients are founded and converted into numbers,there is 7 higher and 7 lower coefficients.
>These all coefficients are obtained by creating a loop for all the 53 species.
>After getting all the 14 coefficients ,by using coefficients and by functions we can calculate cp,H,S.
>We use Molecular function to find molecular weight of the species.
>we use 'Cd' change the directory to save all the files at new location.After changing the directory we use 'mkdir' to create a new folder with name of all species of 'Thermo.dat'.Then again 'Cd' is used to make 'mkdir' as the current directory.
>We use plot command to plot O2,N2 and CO2 temperature vs Cp,H,S.
>Again we use 'Cd' to store all the plots in the folders of the species.
>'fprintf' command is used for getting the outputs of the molecular weights.
Program for Function of specific heat (Cp):
function Cp = Specific_heat(a1,a2,a3,a4,a5,a8,a9,a10,a11,a12,T,R,global_mid_temp)

% calculating specific_heat for higher and lower temperatures
if (T<=global_mid_temp)
     Cp = R.*(a8+a9.*T+a10.*T.^2+a11.*T.^3+a12.*T.^4);

else
  Cp = R.*(a1+a2.*T+a3.*T.^2+a4.*T.^3+a5.*T.^4);
end
end
The above function is uesd in main program to calculate the specific heat and lower temperatuures.
Program for Function of Enthalpy(H):
function H = Enthalpy(a1,a2,a3,a4,a5,a6,a8,a9,a10,a11,a12,a13,T,R,global_mid_temp)

% calculating Enthalpy for higher and lower temperatures
if(T<=global_mid_temp)
    H = R.*(a8.*T+(a9.*T.^2)./2+(a10.*T.^3)./3+(a11.*T.^4)./4+(a12.*T.^5)./5+a13);

else
   H = R.*(a1.*T+(a2.*T.^2)./2+(a3.*T.^3)./3)+(a4.*T.^4)./4+(a5.*T.^5)./5+a6;
end
end
The above function is used in main program to calculate the Enthalpy.
Program for Function of Entropy(S):
function S = Entropy(a1,a2,a3,a4,a5,a7,a8,a9,a10,a11,a12,a14,T,R,global_mid_temp)

% calculating entropy for hihger and lower temperature

if(T<=global_mid_temp)
    S = R.*(a8.*log(T)+a9.*T+a10.*(T.^2)./2+a11.*(T.^3)./3+a12.*(T.^4)./4);

else
    S = R.*(a1.*log(T)+a2.*T+a3.*(T.^2)./2+a4.*(T.^3)./3+a5.*(T.^4)./5+a7);
end
end
The above program is used in main program to calculate the Entropy.
Program for Calculating Molecular weight of the Species:
function Molecular_weight = wt(species_name)

Elements = ['H','C','O','N','A','S'];
Atomic_weight = [1 12 16 14 40 32];
species = upper(species_name)

Molecular_weight = 0;

for i = 1:length(species)
    for j = 1:length(Elements)
        if strcmp(species(i),Elements(j))
            Molecular_weight = Molecular_weight+Atomic_weight(j);
            k = j;
        else
            n = str2double(species(i));
            if (n>1)
                Molecular_weight = Molecular_weight+Atomic_weight(k)*(n-1);
                break
            end
        end
    end
end
end
The above function is used to calculate the Molecular weights of the species.
Molecular Weights Displayed in Command Window:
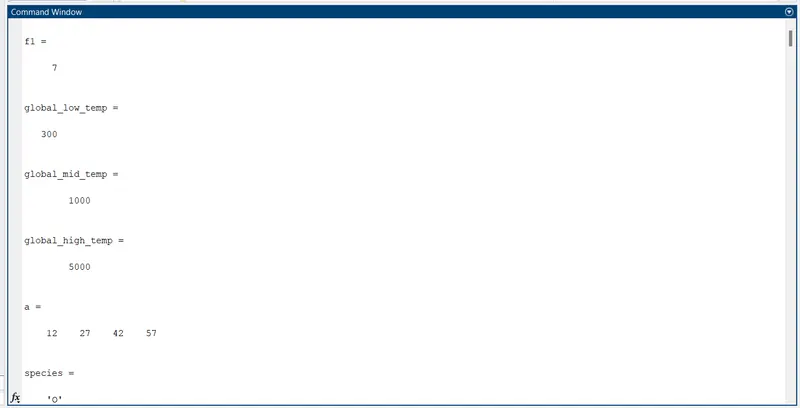
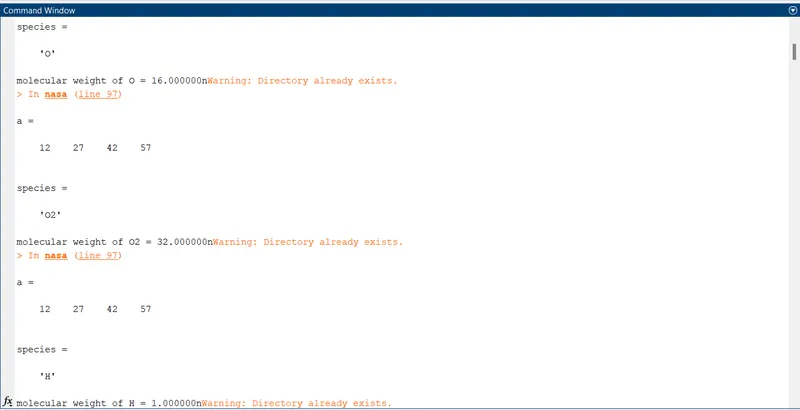
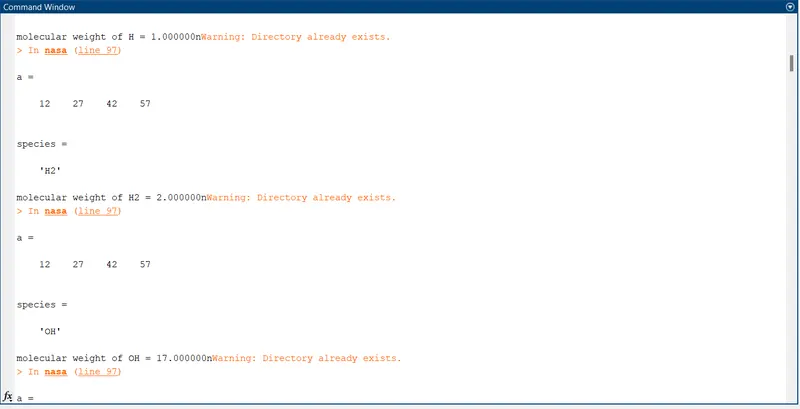
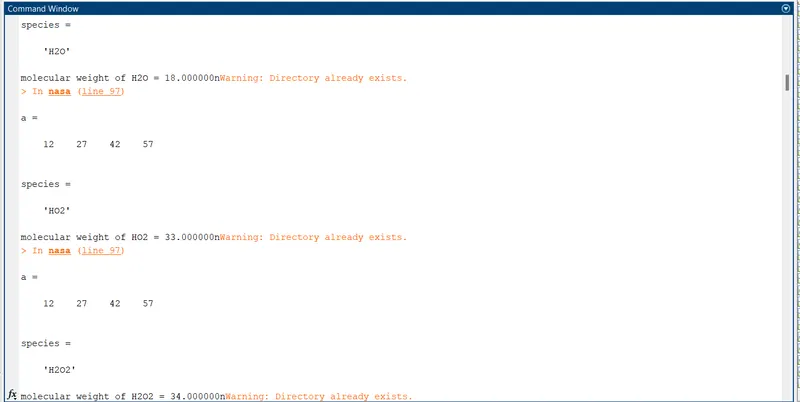
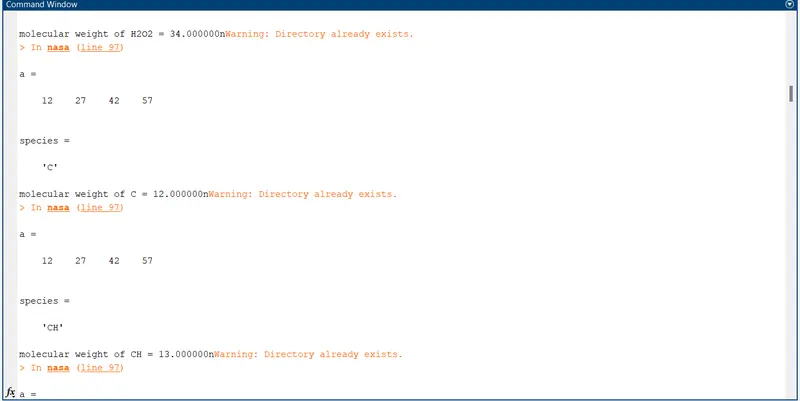
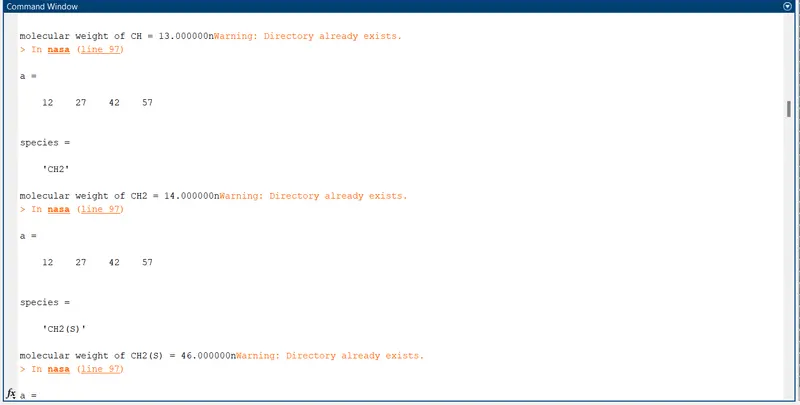
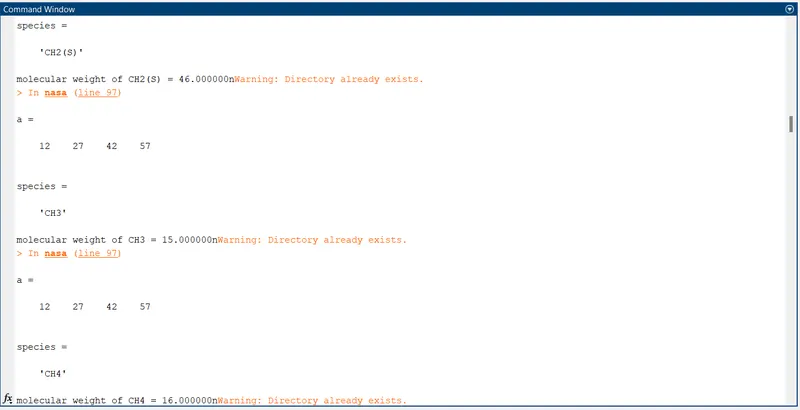
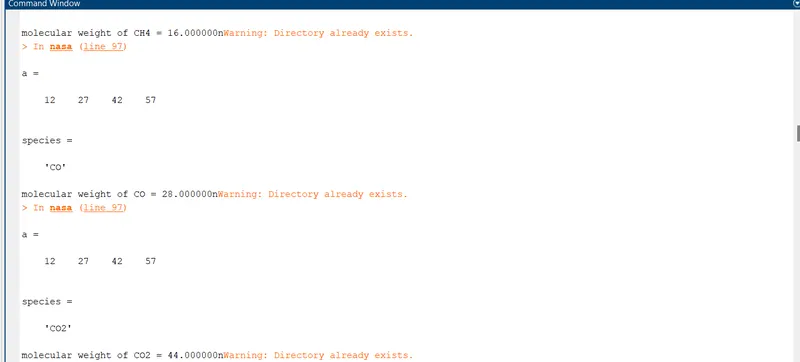
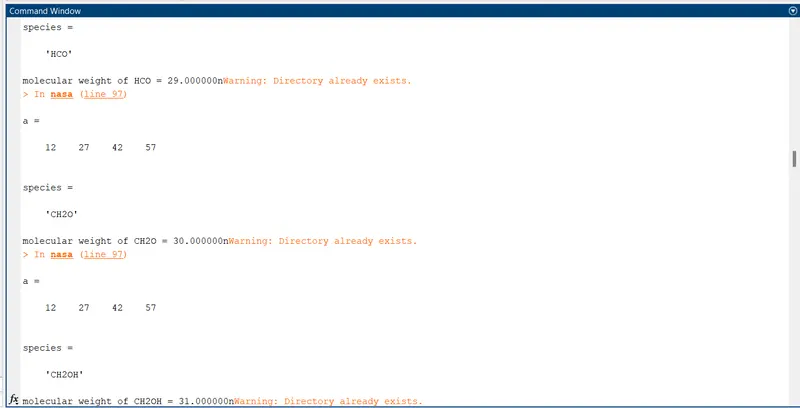
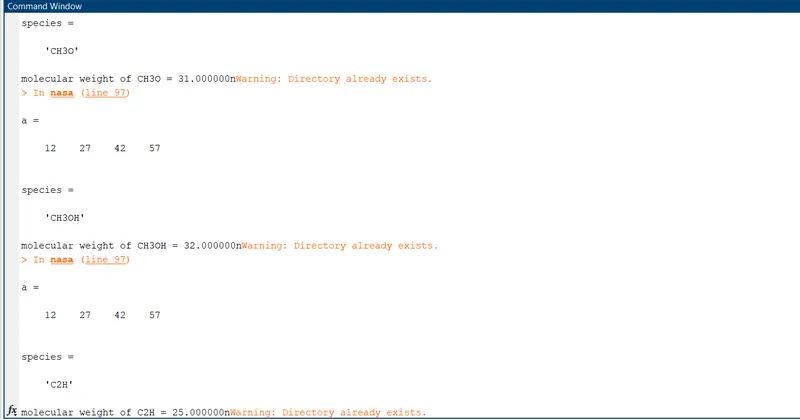
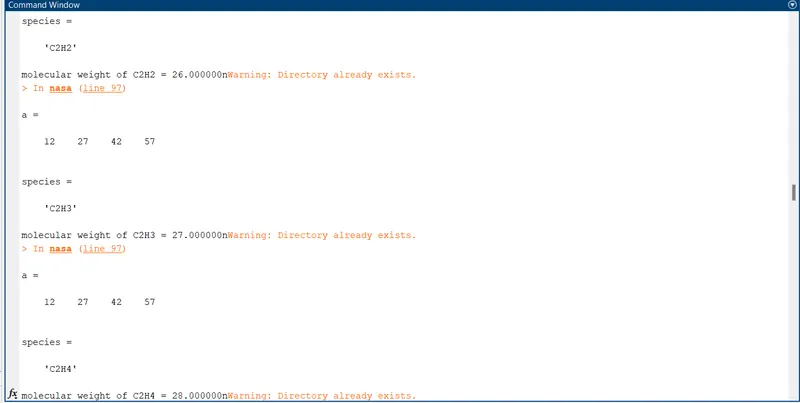
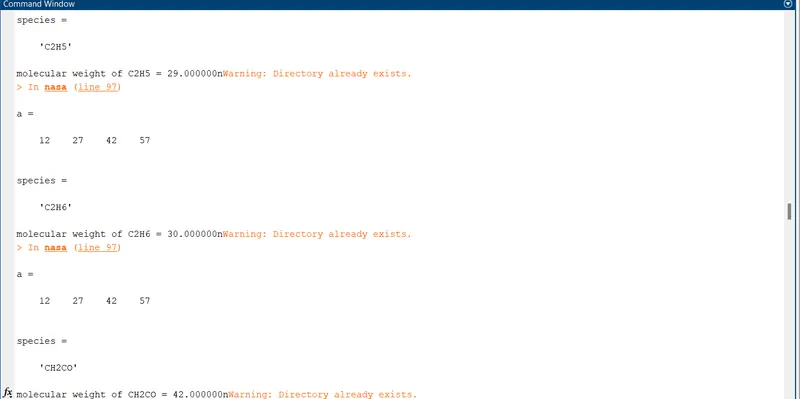
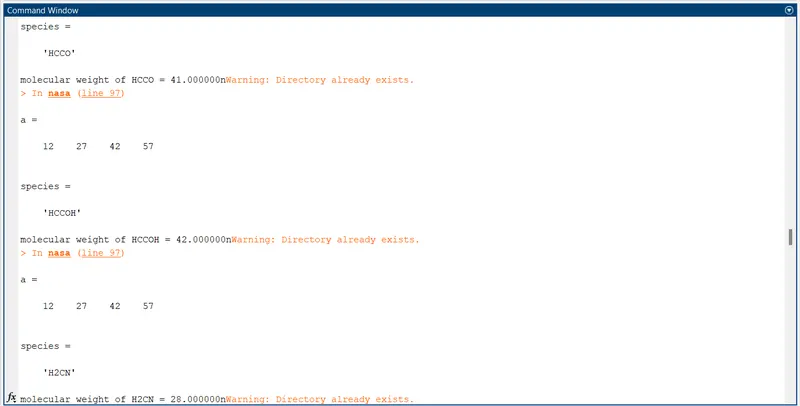
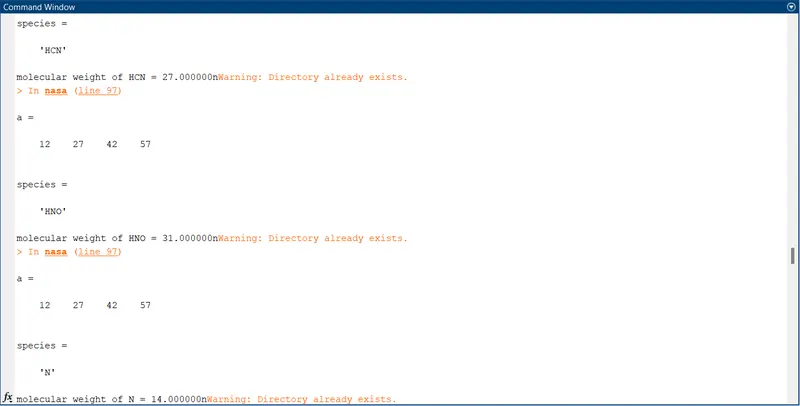
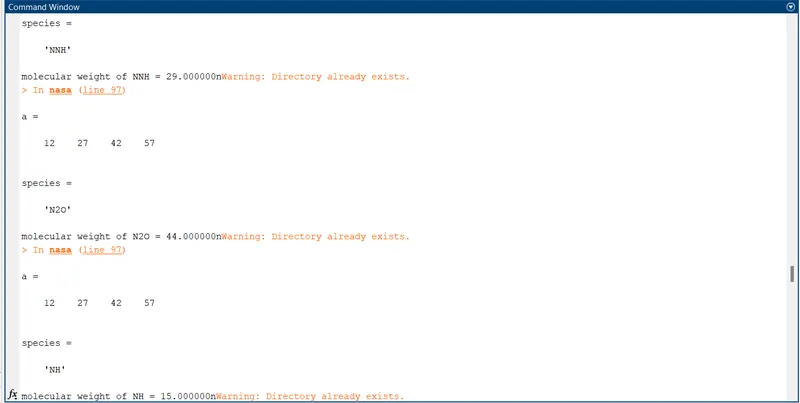
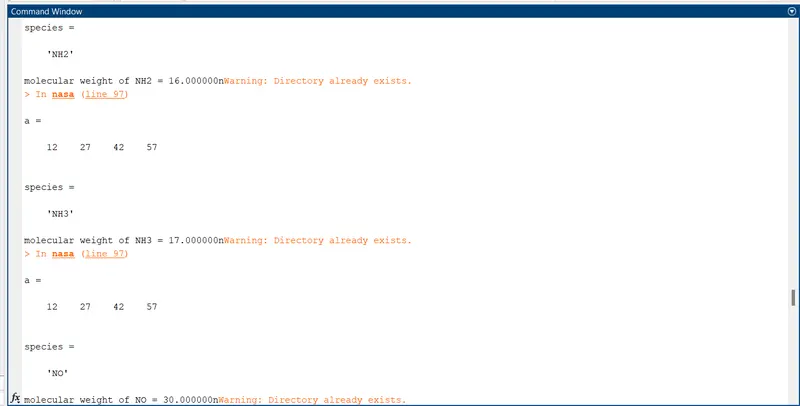
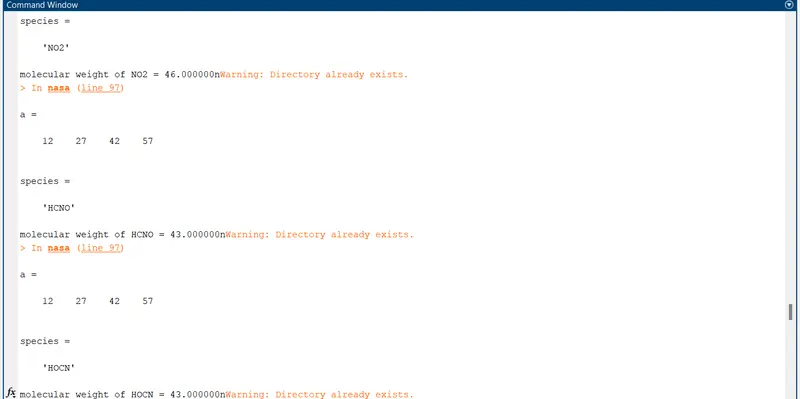
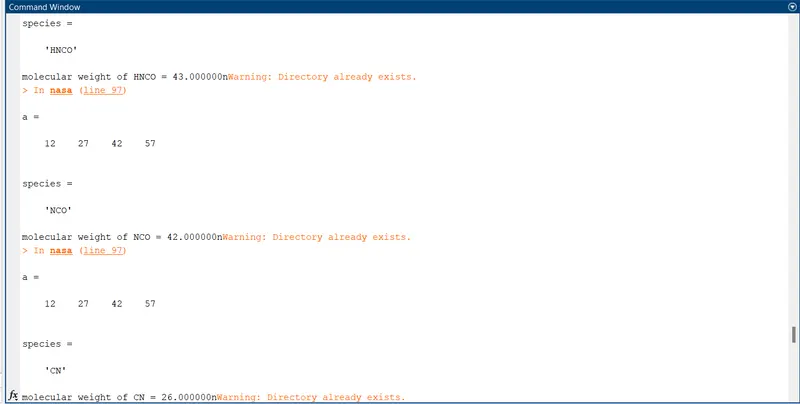
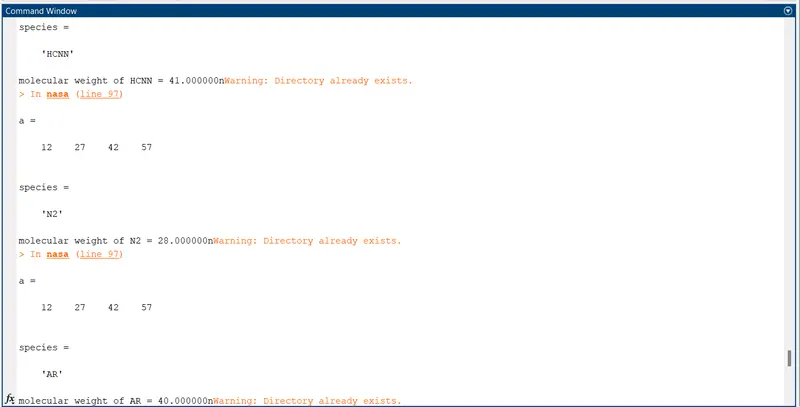
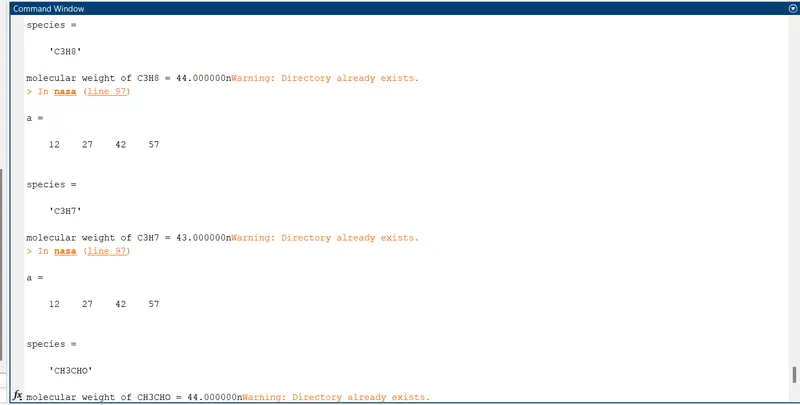
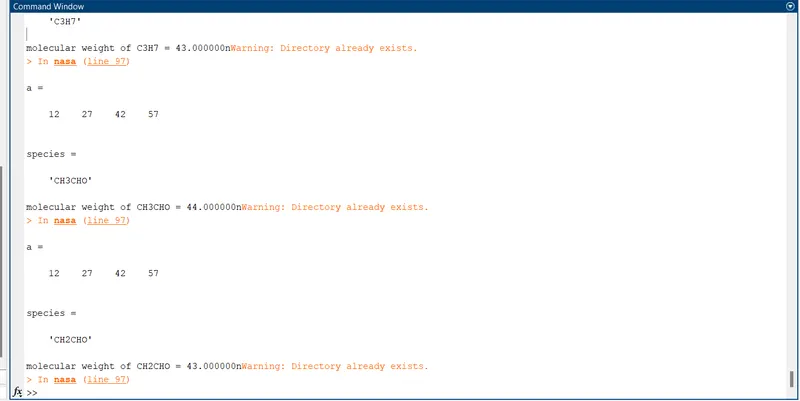
These above images shows the molecular weights of the 53 species in the command window.
WORKSPACE:
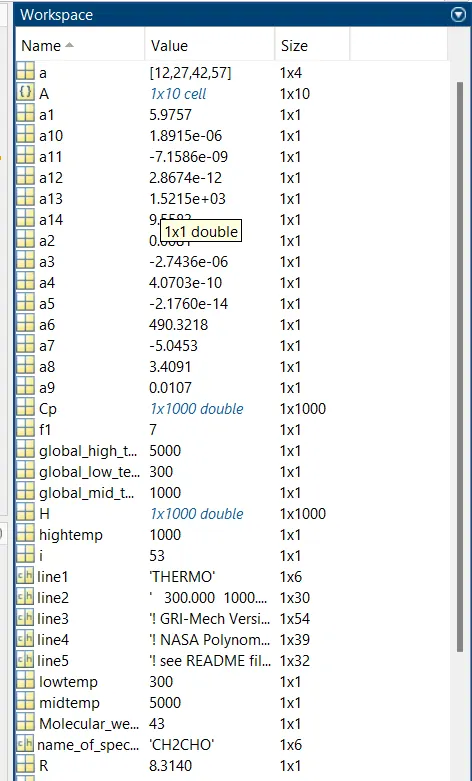
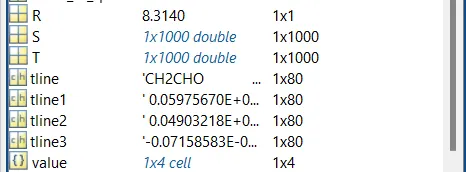
The Workspace stores all the outputs during the program.
Screenshots Of Species Folders:

The above screenshots shows the folders of all the species in my laptop with sperate new folder.
PLOTTING - 1:
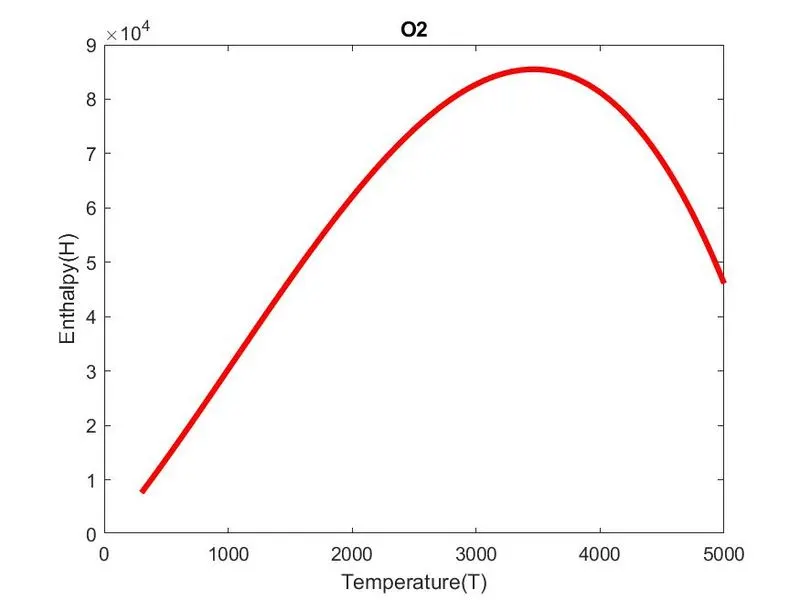
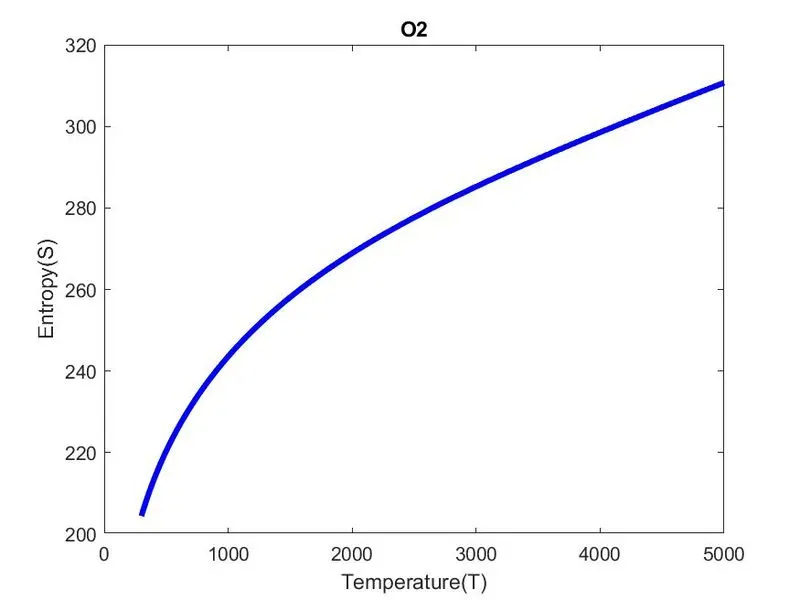
1.Temperature vs Specific heat(Cp) of O2.
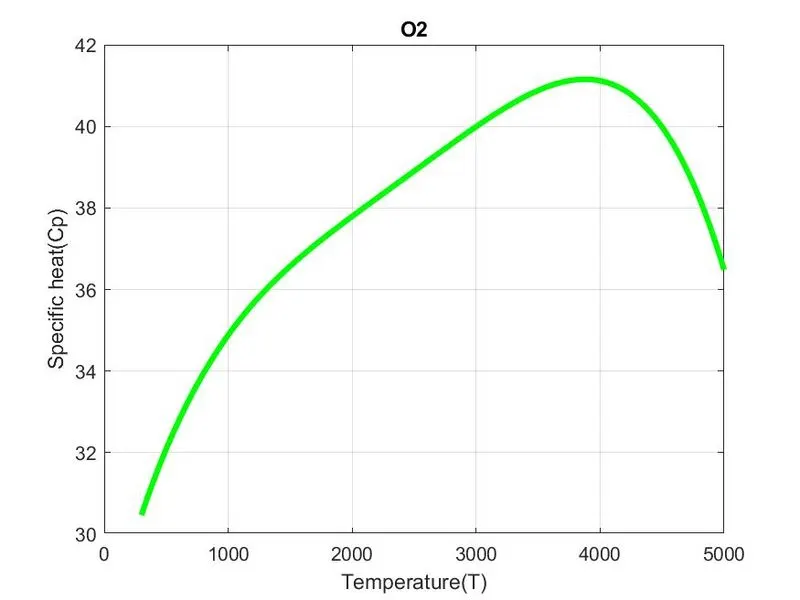
The above plots represents,
X-label represents Temperature.
y-label represents Specific heat(Cp).
2.Temperature vs Enthalpy (H) of O2.
3.Temperature vs Entropy (S) of O2.
PLOTTING - 2:
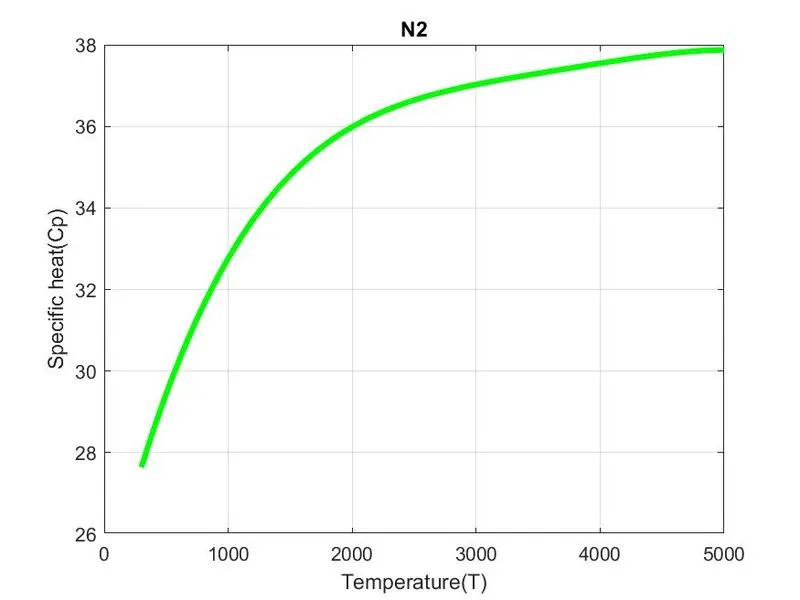
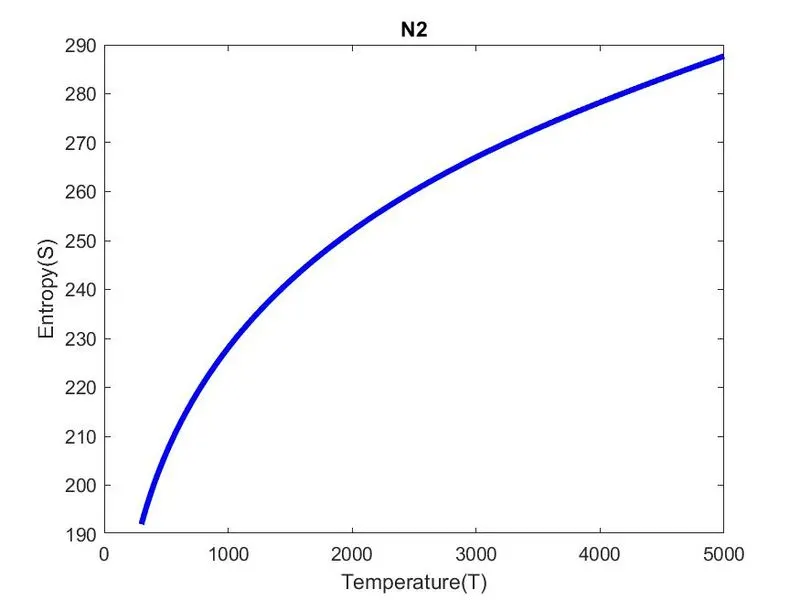
1.Temperature vs Specific Heat (Cp) of N2.
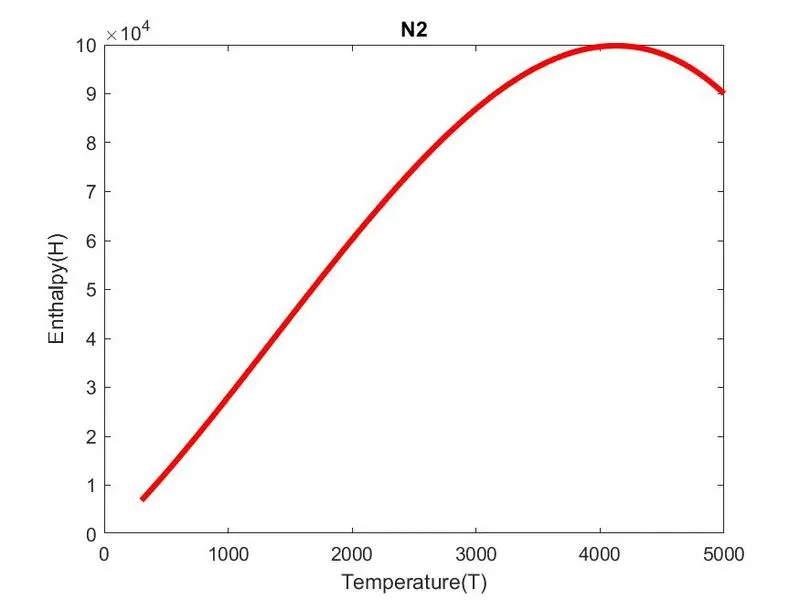
2.Temperature vs Enthalpy (H) of N2.
3.Temperature vs Entropy (S) of N2.
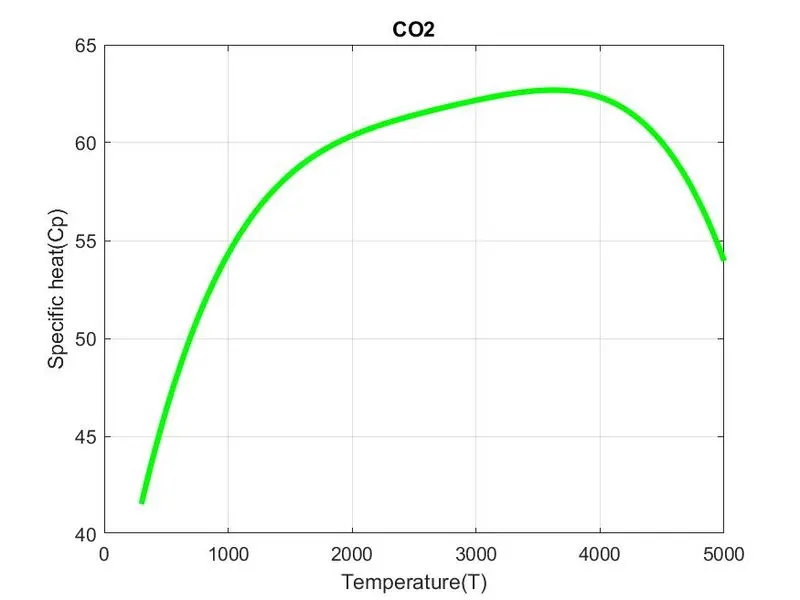
PLOTTING - 3:
1.Temperature vs Specific Heat (Cp) of CO2.
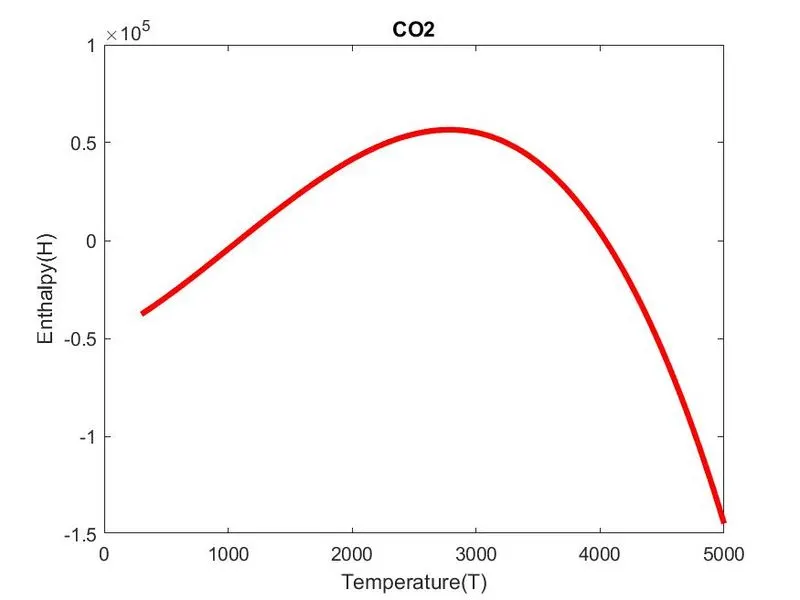
2.Temperature vs Enthalpy (H) of CO2.
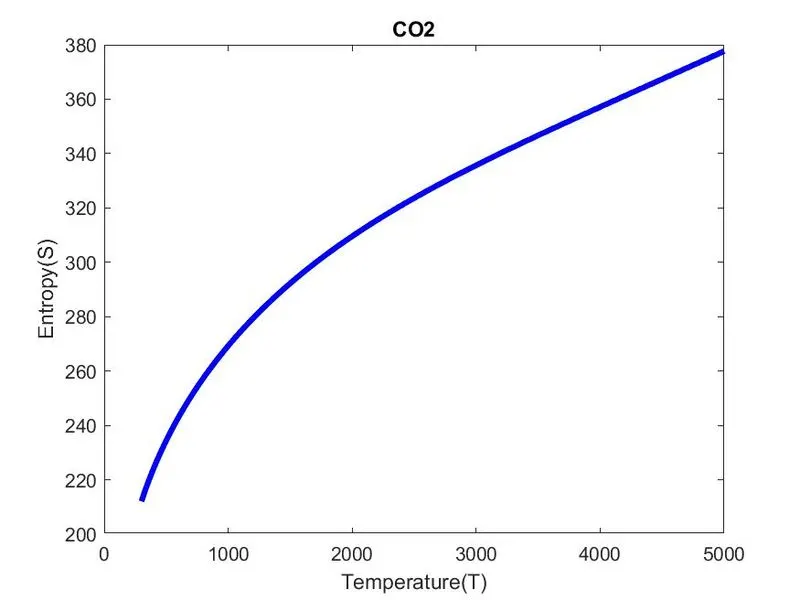
3.Temperature vs Entropy (S) of CO2.
ERRORS:
Error - 1:

The above error occur due the use of equal symbols,these can be eliminated by using equal symbol in appropriate position.
Error - 2:

The above error occured due to the unrecognized use of 'finstr'.
The error can be eliminated by using 'findstr'.
References:
1.https://in.mathworks.com/help/matlab
2.https://en.wikipedia.com/wiki/parsing
3.https://projects.skil-lync.com/projects