Week - 4
Aim:
- Implement control logic of a “washing machine” using Stateflow as per given sequence:
- If the power supply is available, the system gets activated
- If the Water supply is not available, stop the process & indicate through LED
- Soaking time should be 200s followed by Washing time of 100s.
- Then rinsing happens for next 20s & dryer runs for 50s
- After all the processes have completed turn on the finished LED
Work flow for washing machine:
1.Cheak for water and power supply 2.add water 3.start soaking 4.start washing 5.start rinsing 6.start drying 7.finish
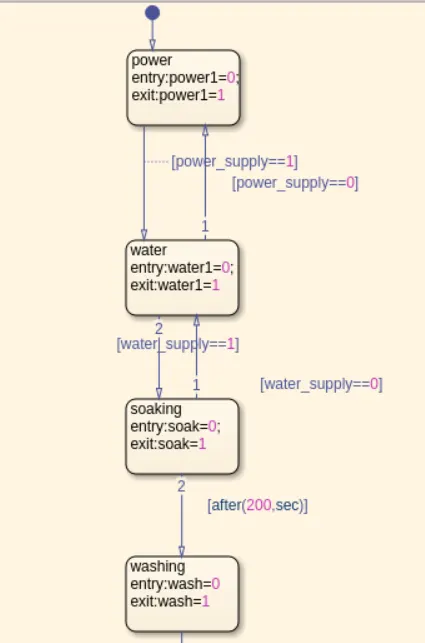
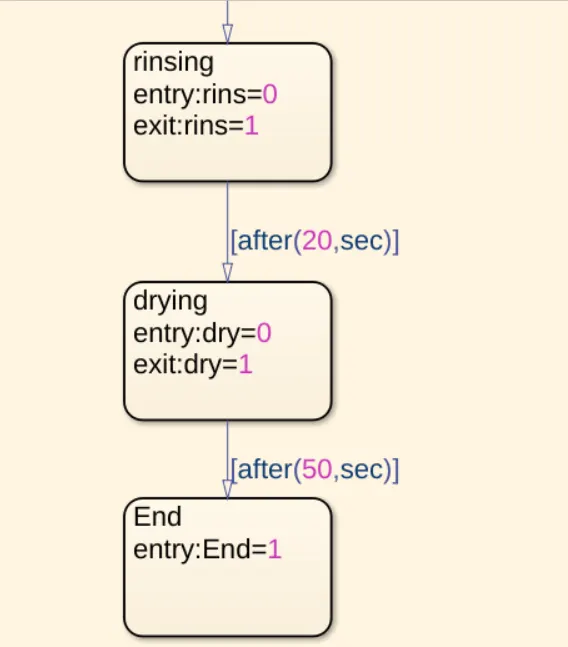
For this simulation we use simulink chart block to create flow chart which represent work flow for washing machine . Chart blocks are connected with arrows which represent conditions for Eg (after(200,sec)) here next block will be iinitiated after 200 seconds
every chart block has block name and asigned variables and output .This chart blocks output can be connected to displays from main chart and similarly to indicators
state flow chart
simulink Model :
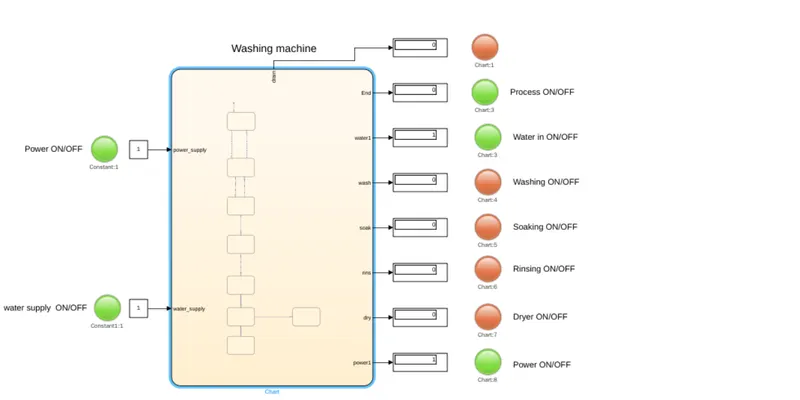
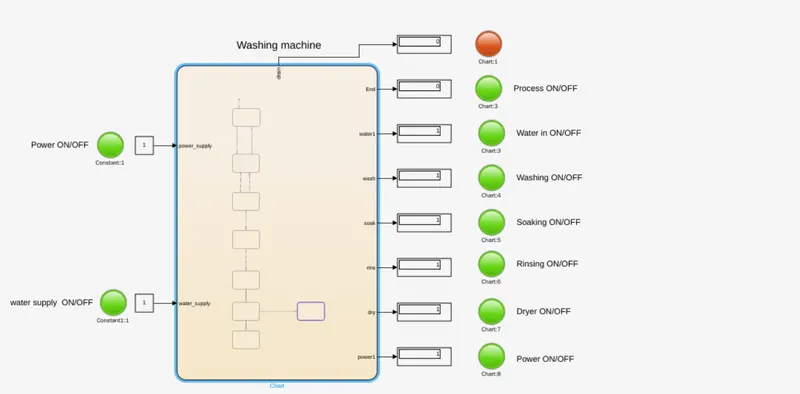
Model shows chart block with power supply and water supply as input arguments to chart block and displays for each state flow block output. Indicators are assigned to outputs .
Conclusion:
Successfully simulated simulink model for washing machine using simulink .
2.Gear shift Mechanism
Aim:Make a simulink chart for the "Gear shift "logic as per below conditions:
| Speed Range | Gear |
| 0 to 15 | 1 |
| 16 to 25 | 2 |
| 26 to 40 | 3 |
| 41 to 60 | 4 |
| Above 61 | 5 |
Give speed input while the simulation is running and display the gear number.
Simmulink model:Following staateflow chart has been used to simulate the mechanism of gear shifting .
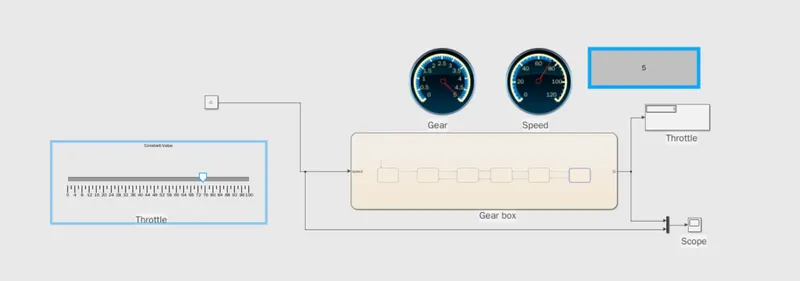
A slider block has been used to input the varying speed data to the state flow chart.The data data is input to the chart from the input port .Condition for gear shift has been clearly defined into the chart as given in study. Lamp block has been used to depict the diffrent gears and the slider is moved acordingly to achive gear shift.
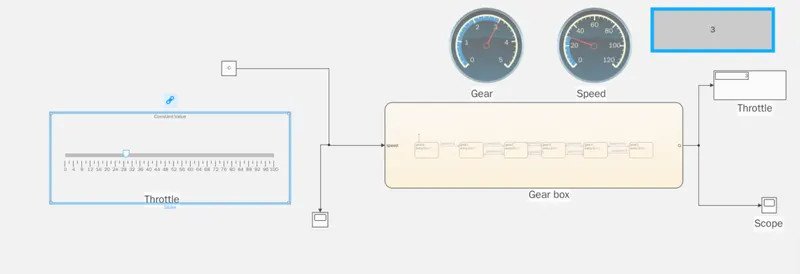
The lamps very clearly show the diffrent gears at diffrent gears at diffrent speed for perticular instance of time . The simulation has been done in real time to achive more clear and understandable results.Gear shifts for diffrent speed ranges can been seen in the below attached figures.
3rd gear shift for spee range 26 to 40
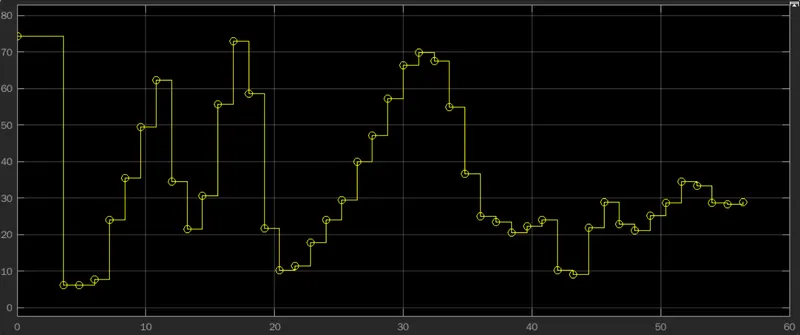
Speed plot
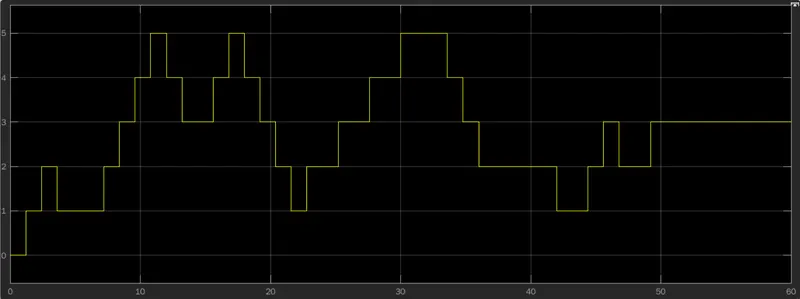
Gearshift plot
Conclusion: Successfully completed simulation for Washing machine and gear box
Drive file:Week 4 challenge files