Week - 4
Aim :
1) Implement control logic of a "washing machine" using stateflow as per the given condition.
2) Make the simulink chart for gear shifting logic as per the given codition.
1) Washing machine - stateflow
As per the given codition
- If the power suppy is available, the system gets activated
- If the water supply is not available, stop the process and indicate through LED
- Soaking time should be 200s followed by washing time of 100s
- then rinsing happens for next 20s and drying runs for 50s
after all the processes have completed turn on the finished LED.
Blocks used :
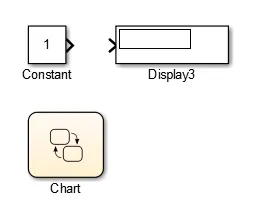
For make this stateflow mainly the chart block is used while click this chart it will get into another platform which is like flow chart. Here we need to make block and name the step by step process done by the system. And basic simulink blocks such as constant, display are also used.
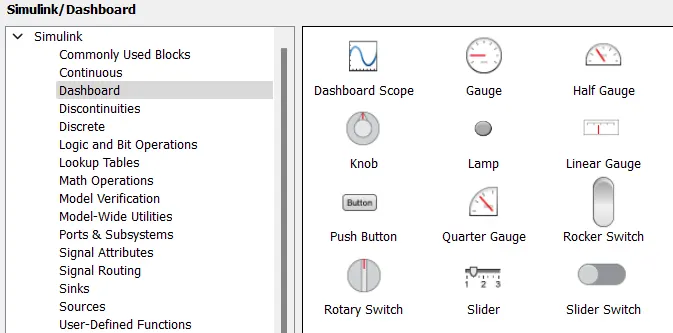
For make us the better understanding what are the things going on the system simulink gives some dashboard setup from the library and those are given below figure. From that we use only two dashboard things. for this washing machine we need to some indicator for indicate water is low or power is not given to the system. so, we use here slider switch, lamp from the dashboard.
Simulink Model :
Explanation :
1) The first step we need to open simulink model and from that choose blank model. so we are in the simulink blank model creation section from that type chart or click labrary icon and from that click stateflow here we have that chart option.
2) And by double click that chart it brings to the new window which is used to create the chart. From the chart window we create many blocks for different step process in the washing machine working and for the given codition. for the given codition we split the state.
3) This washing machine states are check power and water in the system. And next step is to process like Soaking, washing, Rinsing, Drying for that we create saperate state box as shown in figure.
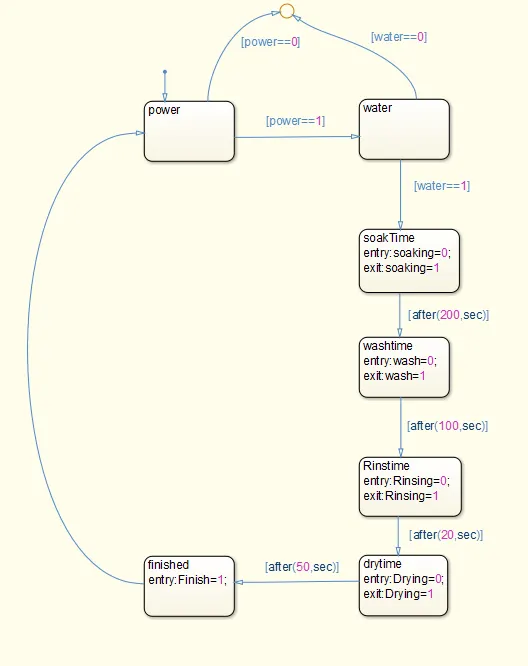
4) from the flow chart of the state point we can understant that for soaking process need to wait for 200sec which is given between the link of tha soaking state point. simlarly this all state point are created as shown in figure.
5) In the main model of simulink model we need to give some input such as power and water suppy to the washing machine system. for that click chart in the top of the window bar and click "chart > add input and ouput > data input form simulink" here the dialog box as shown in figure will appear in that we need to type the name of the data and which is need to select output or input value from the chart.
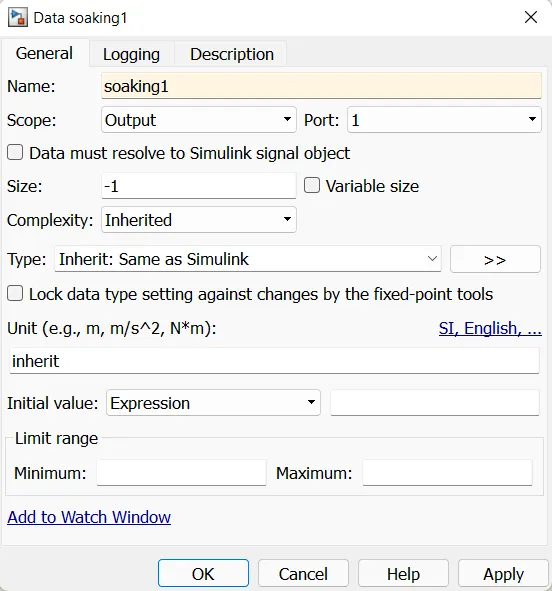
6) In our case we need to have take two input from simulink and give soking, washing, drying as the output from the chart and check our input and output values as shown in the figure
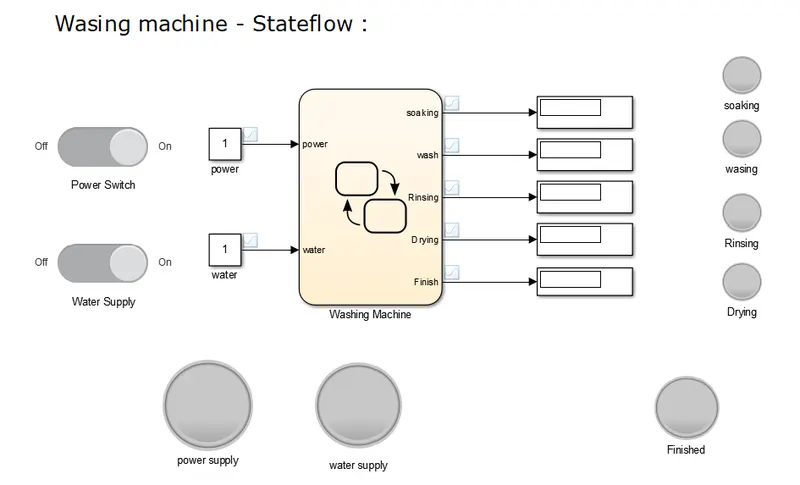
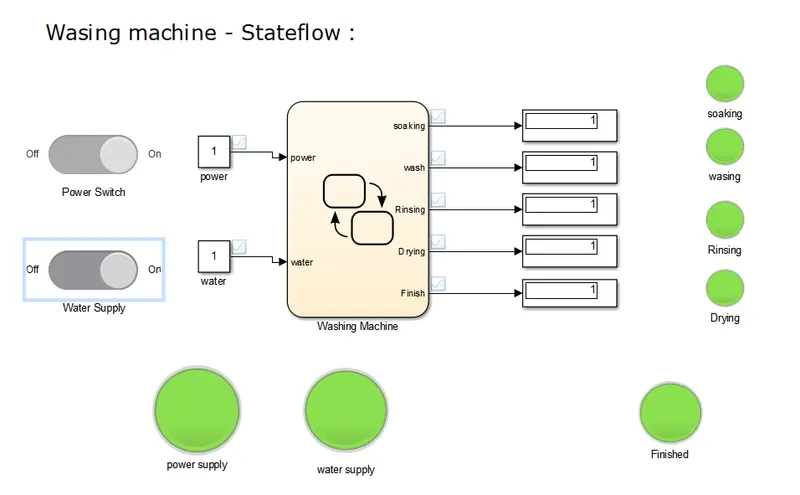
7) After creating chart and input and output ports exit from the chart window and move to the simulnik window from here we need to connect some input value and output display to the chart block. here we use constat as two inputs and display connected to output to indicate what happening inside the washing machine. from the dashboard help we take two blocks one is slider switch and lamp which is used to ON/OFF the power and water suppy and indicate which process is goning on as respectively.
8) and connect this indicator and switch as shown in simulink model block. And now this washing machine block is ready to run. In the run time we give inf for this process have more time. and run this model quickly get start and over the model and all indicators all on now. so we cant see sept by step process for that we set some time and run tha machine for that time and see the result.
Output :
For the given condition,
If the water supply is nor available stop the process and indicate.
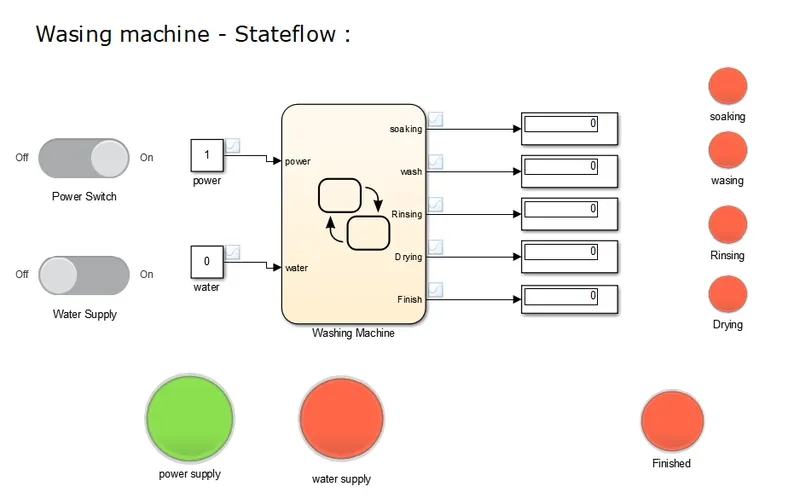
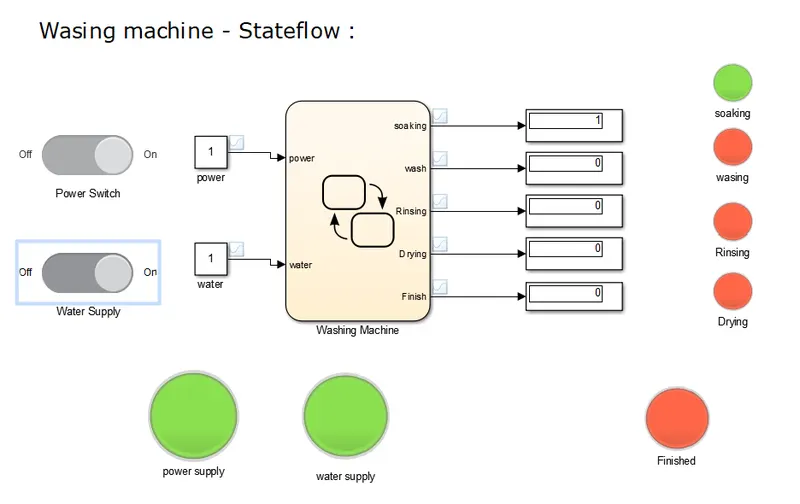
If the power and water supply is on. and at the run time - 210 sec :
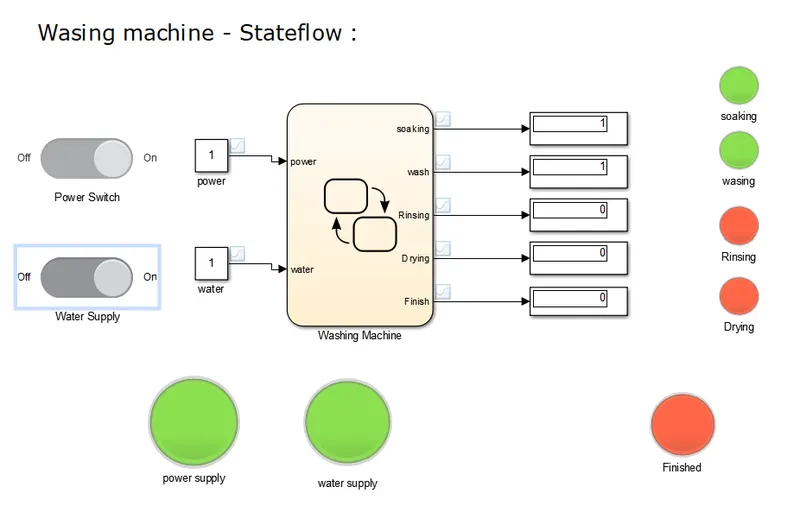
At run time -310 sec :
After every process done- indicate finished
Conclusion :
Here we implement control logic of a "washing machine" using stateflow was created successfully and as per given condition all process are done.
2) Gear Shifting Logic :
To make a simulink chart for the Gear shift logic as per below coditions :
speed Range (kmph) gear
0 to 15 1
16 to 25 2
26 to 40 3
41 to 60 4
above 61 5
Give speed input while the simulation is running and display the gear number.
Blocks used :
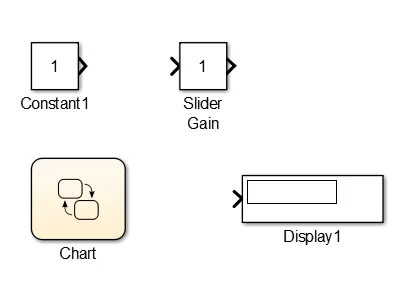
Here, to make model for gear shiftting process the basic simulink blocks such as constant, slider gain, chart, display are used and some dashboard tools also used. the basic block used for this gear shifttings from simulink are shown.
Simulink Model :
Explanation :
1) To create gear shift logic very first open simulink file and in that type chart and duble click that chart because it will take to the next sup platform. which is used to create state of the system in our case is used to create the state points of the gear.
2) For gear shifting process we need to identify first what is speed of the car. so far from the given information about speed and the gear information we going to change the gear value. so, first we setup the chart for this system properly as shown in the figure.
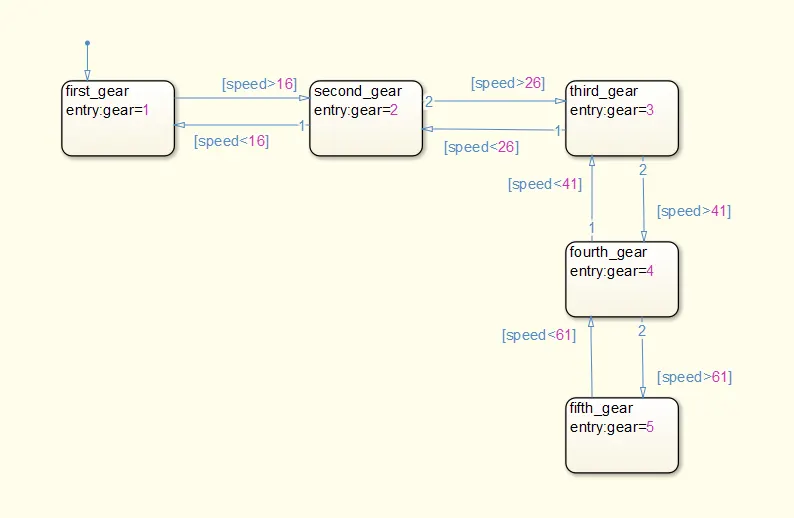
3) From the flow of state point we clearly understand if car speed is above 16 kmhr then move two second state which is 2nd gear. And by this way this gear continue to above 61 kmhr then the gear will change 5th gear. And after some time car speed will reverse for that we have the opposite side arrow mark and codition is if the car speed come below 61kmhr the move to 4th gear. And by this way the reverse of speed the gear will get done to 1st .
4) After create this chart block we need back to simulink window before that we need to give proper input link and output link. Now create input to get the speed value inside the block and from that we find out which gear is that. And to give this gear value outside we create output link for gear value.
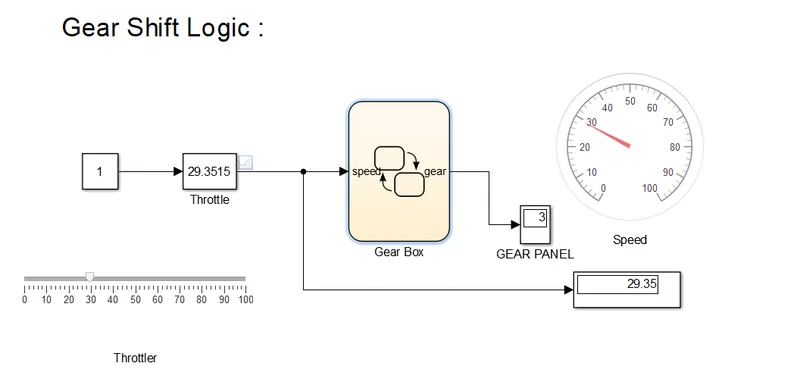
5) Then in the simulnik window we create some odometer to display speed of the car. Form the dashboard we take some tools like gauge to show the speed and linear gauge for give the throttle to the car maually. So this kind of dashboard tools are very usefull to give input in the custamize way and display result that easy to understand.
6) After that gauge is connected to given speed directly to show what is the current speed of the car. and linear gauge is connected to slider gain to give speed for manually by using slider. And the output form the chart is connected to display to show gear position.
Output :
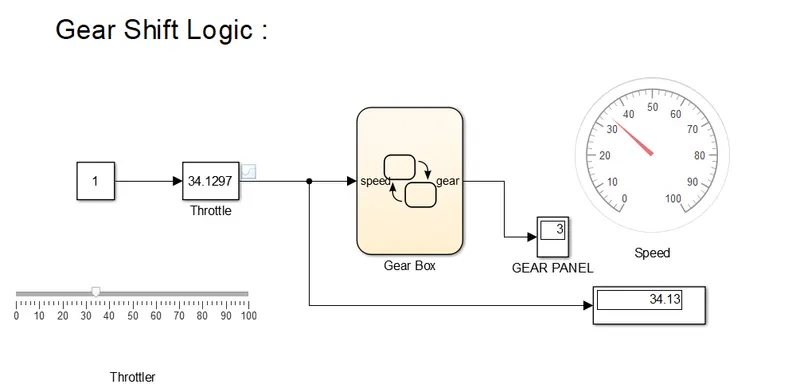
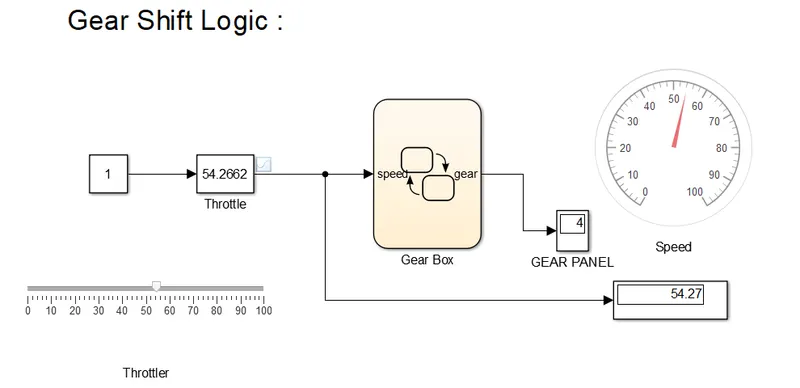
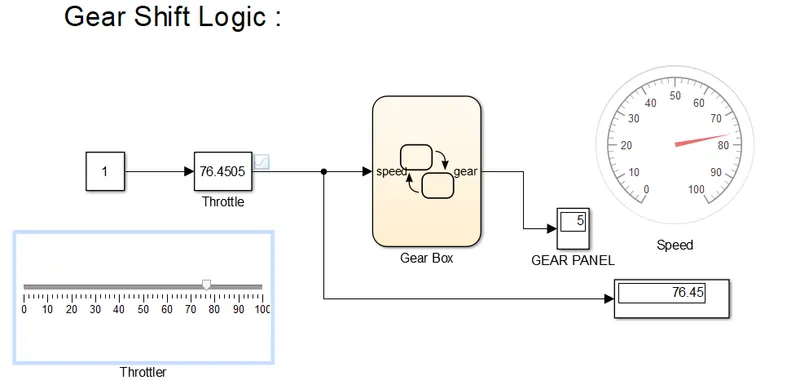
In this system we need to give speed manually by using throattle(linear slider) for that we give run time as inf then this system is continously running and we can change any speed by slider. according to the speed the display shows the gear of the car.
Codition :
1) For speed = 34.12 kmph
Gear panel = 3 rd Gear
2) For speed = 54.26 kmph
Gear panel = 4 th Gear
3) For speed = 76.45 kmph
Gear panel = 5 th Gear
Conclusion :
As per given speed range the gear positon change done succesfully using simulink and charts in the MATLAB. And input speed is given while simulation is running and display show the gear number.
ALL FILES LINK - 1)washing machine 2)Gear shifting
https://drive.google.com/drive/folders/1bCg9Fixh1kaS_fmAJQA-tc87nfXW77wJ?usp=sharing