Project 1 - Parsing NASA thermodynamic data
Parsing NASA thermodynamic data
Aim :
Evaluate the thermodynamic properties such as Specific heat(Cp), Enthalpy(H), Entropy(S) by using the given NASA thermodynamic file.
Objective :
1) write a program that extracts the 14 coefficients from given THERMO.dat file.
2) Calculate the specific heat, enthalpy and entropy for all the species in the given data file.
3) plot the Cp, enthalpy and entropy for the local temperature range for each species.
4) save all the plots as images with appropriate name in separate folder for each species.
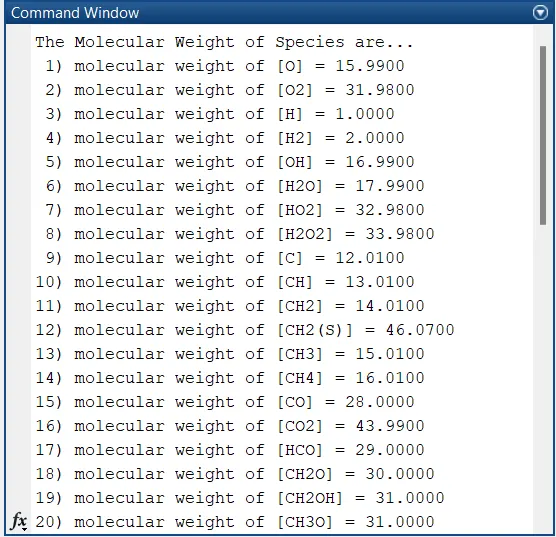
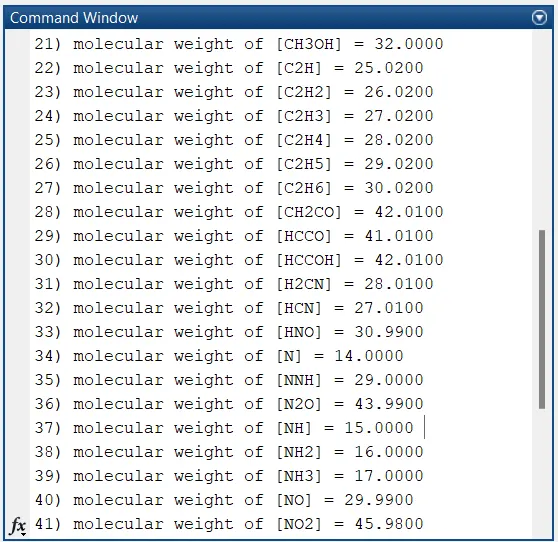
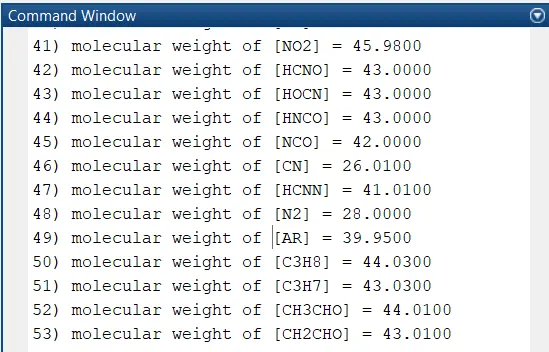
5) Calculate the molecular weight of each species and display it in the command window.
Input Equations :

Inputs :
R=8.314
Atomic Weights :
H=1.00
C=12.01
O=15.99
N=14.00
A=39.95
S=32.06
Function Program :
First create the function program for claculate atomic weight by using the known atomic weight values.
function [ mw ] = molecular_weight( species )
elements=['H','C','O','N','A','S'];   % give name of the elements
atomic_wt=[1.00 12.01 15.99 14.00 39.95 32.06]; % give the corresponding atomic weight of the element

mw=0;
  for i=1:length(species);
     for j=1:length(elements);
        if strcmp(species(i),elements(j));
            mw=mw+atomic_wt(j);
            a=j;
        end
     end
    n=str2num(species(i));
     if n>1
        mw=mw+atomic_wt(a)*(n-1); % claculating molecular weight of species

     end
  end
end
Steps :
- Create a new function program is called as molecular_weight(species). And the element arrar is containing the constituent elements.
- Atomic weight of the respective element is given in tha array atomic_wt.
- initial value for atomic value mw is set as 0. for loop is used to repeat the process. strcmp command is used to compare elements present in both species and elements array.
- if the element match is found then it claculate mw taking the value from array of atomic_wt and adding to it.
- to check if the species has same element twice or more and if found the same is multiplied to it by (n-1) times weight is already added) . finaly molecular weight is calculated.
Main Program :
clear all
close all
clc
f1=fopen('THERMO.dat','r');   % To load (THERMO.dat) file and read
fgetl(f1);                    % To read first line (THERMO)
A=fgetl(f1);                  % To read and assign to A second line (300.000 1000.000 5000.000 )
golobal_temp=strsplit(A,' '); % split the line by space
golobal_low=str2num(golobal_temp{2});
golobal_mid=str2num(golobal_temp{3});% assign values for low, mid, high temp
golobal_high=str2num(golobal_temp{4});

R=8.314; % Universal gas constant

% For read and skip the instruction line
info_1=fgetl(f1);
info_2=fgetl(f1);
info_3=fgetl(f1);
fprintf('The Molecular Weight of Species are...\n');
% To extract the coefficirnts,
for i=1:53;
line_1=fgetl(f1);
line_2=fgetl(f1);
line_3=fgetl(f1);    % All 4 lines are extracted first
line_4=fgetl(f1);

data=strsplit(line_1,' ');   % line_1 is splited by space
species=data{1:8};           % Species name is extracted
G=strfind(line_1,'G');       % find the place number of 'G=45'
% In thermo file some line_1 have two times 'G'.So, we use place number of G=45
local_low=str2num(line_1(45+3:45+9));
local_high=str2num(line_1(45+12:45+19));% Find local temperatures from file
local_mid=str2num(line_1(45+22:45+29));

E=strfind(line_2,'E'); % find the place number of 'E=[ 12,27,42,57,72 ]'
htc_1=str2num(line_2(E(1)-11:E(1)+3)); % extracted High temperature co-efficient (htc_1)
htc_2=str2num(line_2(E(2)-11:E(2)+3));
htc_3=str2num(line_2(E(3)-11:E(3)+3));
htc_4=str2num(line_2(E(4)-11:E(4)+3));
htc_5=str2num(line_2(E(5)-11:E(5)+3));
htc_6=str2num(line_3(E(1)-11:E(1)+3));
htc_7=str2num(line_3(E(2)-11:E(2)+3));
ltc_1=str2num(line_3(E(3)-11:E(3)+3)); % extracted Low temperature co-efficient (ltc_1)
ltc_2=str2num(line_3(E(4)-11:E(4)+3));
ltc_3=str2num(line_3(E(5)-11:E(5)+3));
ltc_4=str2num(line_4(E(1)-11:E(1)+3));
ltc_5=str2num(line_4(E(2)-11:E(2)+3));
ltc_6=str2num(line_4(E(3)-11:E(3)+3));
ltc_7=str2num(line_4(E(4)-11:E(4)+3));

T=linspace(local_low,local_high,100);  % give local temperature range of 100 values

for j=1:length(T)

    if T(j)>local_mid
        Cp=(htc_1+htc_2.*T+htc_3.*(T.^2)+htc_4.*(T.^3)+htc_5.*(T.^4)).*R;
        H=(htc_1+(htc_2.*T)./2+(htc_3.*(T.^2))./3+(htc_4.*(T.^3))./4+(htc_5.*(T.^4))./5+(htc_6./T)).*(R.*T);
        S=(htc_1.*log(T)+htc_2.*T+(htc_3.*T.^2)./2+(htc_4.*T.^3)./3+(htc_5.*T.^4)./4+htc_7).*R;
    else
        Cp=(ltc_1+ltc_2.*T+ltc_3.*(T.^2)+ltc_4.*(T.^3)+ltc_5.*(T.^4)).*R;
        H=(ltc_1+(ltc_2.*T)./2+(ltc_3.*(T.^2))./3+(ltc_4.*(T.^3))./4+(ltc_5.*(T.^4))./5+(ltc_6./T)).*(R.*T);
        S=(ltc_1.*log(T)+ltc_2.*T+(ltc_3.*T.^2)./2+(ltc_4.*T.^3)./3+(ltc_5.*T.^4)./4+ltc_7).*R;
    end
end
% plotting for Temperature vs Specific heat(cp)
figure(1)
   plot(T,Cp,'linewidth',2,'color','r')
   grid on
   title(species)
   xlabel('Temperature(K)')
   ylabel('Specific heat(J/kg-K)')
% plotting for Temperature vs Enthalpy(H)
 figure(2)
   plot(T,H,'linewidth',2,'color','b')
   grid on
   title(species)
   xlabel('Temperature(K)')
   ylabel('Enthalpy(J)')
% plotting for Temperature vs Enthalpy(S)
 figure(3)
   plot(T,S,'linewidth',2,'color','m')
   grid on
   title(species)
   xlabel('Temperature')
   ylabel('Entropy(J/K)')
% folder has to be created to save data for all the specices
 mkdir(species)
 directory=pwd;
 cd(species)
% save the plots as images in the folder
 saveas(1,'Spaecific_heat.jpg')
 saveas(2,'Enthalpy.jpg')
 saveas(3,'Entrophy.jpg')
 cd(directory)
% calculate molecular weight of the species by using function
  mw=molecular_weight(species);
% print the results of molecular weight in command window
fprintf('%2.0f) molecular weight of [%s] = %2.4f \n',i,species,mw)

end
fclose(f1); % close the (THERMO.dat) file
Code Explanation :
- clear all, close all, clc commands are used to erace the unwanted data and graphs from command window and workspace.
- fopen command is open the given THERMO.dat file and read the file for take some informations from the file.
- And in that file lines some line are the command and informations are there. so, we need to skip that line using fgetl(f1).
- Then get the next line it has the golobal temperature values. and split that line using strsplit command, and conver the value from string to number by using str2num to get the low, mid and high golobal temperature from that line.
- assign tha known value Universel gas constant of R is equal to 8.314. And to skip the next three information line by using the command fgetl(f1).
- And then for loop is created for parsing elements are made and it counter is set to 53 because it is the number of elements. And then get the 4 next line it has the high and low temperature coefficient of the elaments by using line_1=fgetl(f1) command.
- And split the data from that take the name of the element and assign it to species. In that particular line G is the comman letter which is repeat in all elements of the file THERMO.dat. So, we need to find out that letter by using the strfind command. And in some line 1 it have two time of G letter persent so we cant use this letter so we use place number of G is easy way G place number value is 45. so we use this 45 as to find out the local low, mid and high temperature.
- Next step is extract the high and low temperature coefficient values from file. For that we need to find the place of E by using the command called strfind and then from the E letter it has before that 11 digit and after that it has 3 digit so, we need to take tha value from (E-11 to E+3) for the coefficient values. and convert these values from sting to number for calculation work. by give the command htc_1=str2num(line_2(E(1)-11:E(1)+3))
- From the above command similarly we can extract the all high and low temperature coefficient values from the THERMO.dat file. For temperature values we take that local low,mid and high temperature values by using the linspace command set the starting value as the local low temperature value and end value as local higs temperature of the eace elament.
- Create the for loop for calculate the specific heat, enthalpy and entropy for the each species using the given equations. After that we need to plot the graph for cp, enthalpy and entropy with respect to temperature values.
- from the figure(1) is to create the plot of specific heat vs temperature and give the axis name and title by using xlable, ylable,title, grid on commands. similarly the figure(2) for plot of enthalpy vs temperature and figure(3) is for plot of entropy vs temperature.
- And then to store the plots in the folder as the image with proper name of the folder. we need to create the folder by the command called mkdir() and to give the name to the each folder the we use species name by give cd(species) after that folder created need to save the plots from the figure as the image format of .jpg by using saveas commands and close directory.
- And to calculate molecualr weight of the each species by molecular weight function program explained above. and to print the result in the command window we use fprintf() command and close the THERMO.dat file using fclose(f1) command.
Error faced :
while run this program i got some error in line 29, 30, 31 there is no value for local low, mid, high temperature value in the workspace as shown in figure. And for particularly the element CH2OH.
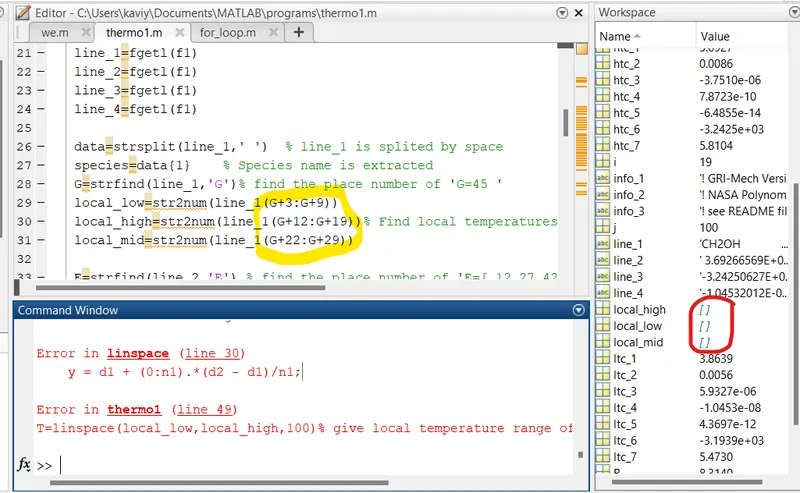
figure 1
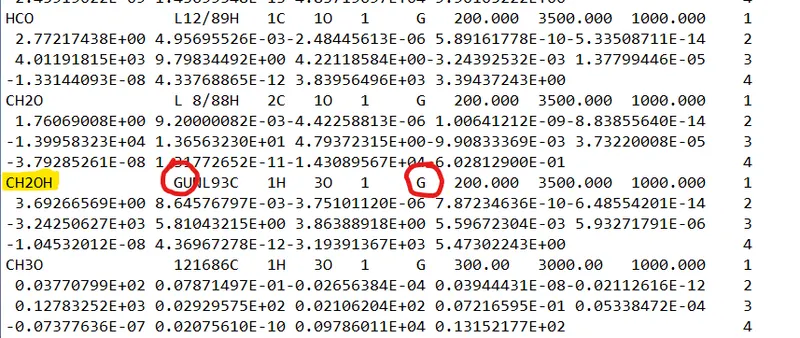
figure 2
Step to overcome :
There is particularly in the species called CH2OH no local low, mid, high temperature value in the workspace as shown in figure1. so go to check the given THERMO.dat file for the species CH2OH line_1.
There is actually letter G is present two times as shown in figure2. so this program take the first letter G from that it not able to find the temperature values. so i check the place of G in that particular line it is actually 45. i replace the G with the number of 45 to solve this problem as shown in figure3.
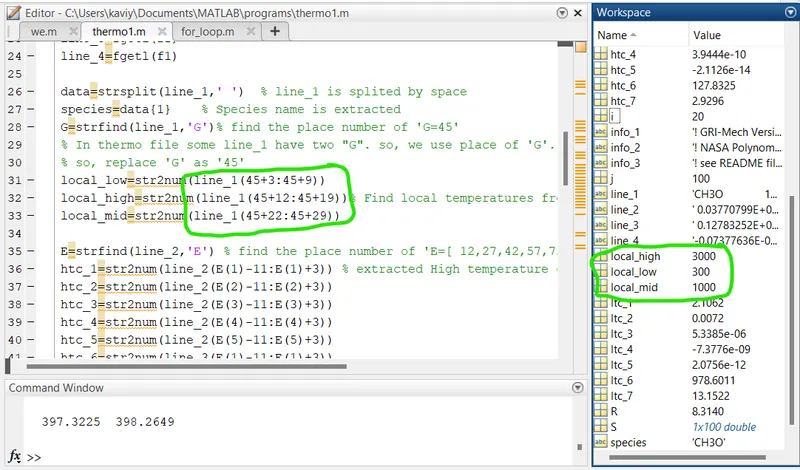
figure 3
Output :
Plot for O2 :
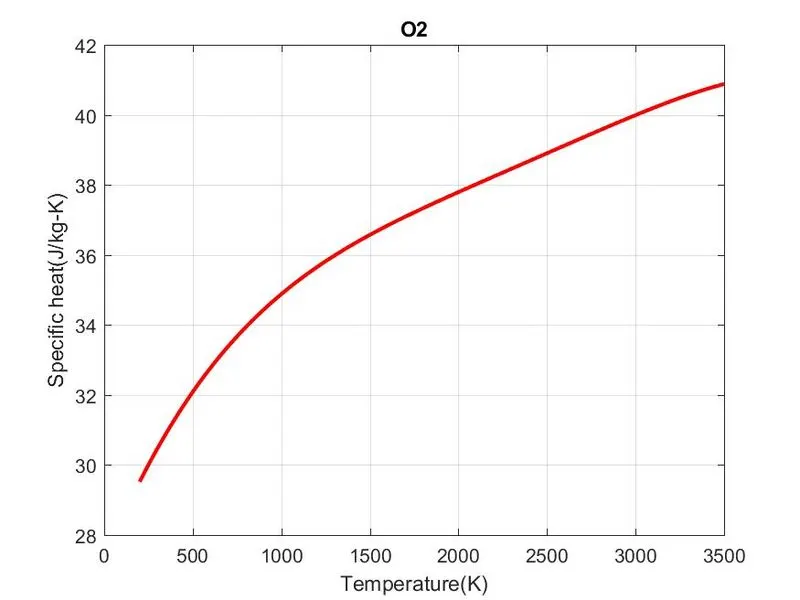
Temperature vs Specific heat (O2)
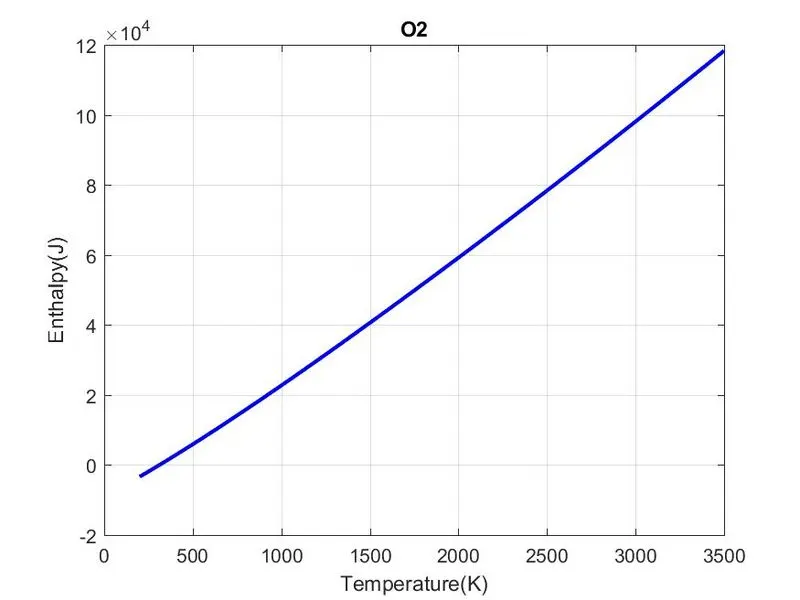
Temperature vs Enthalpy (O2)
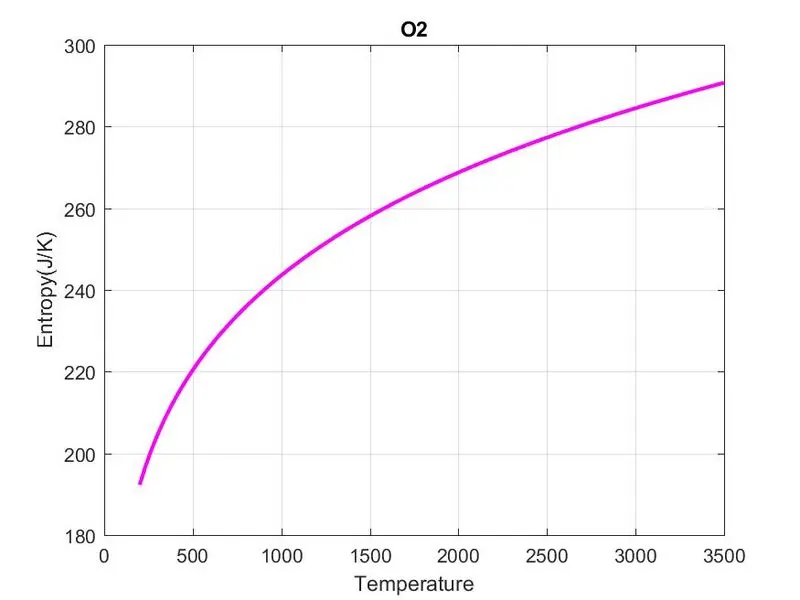
Temperature vs Entropy (O2)
Plot for N2 :
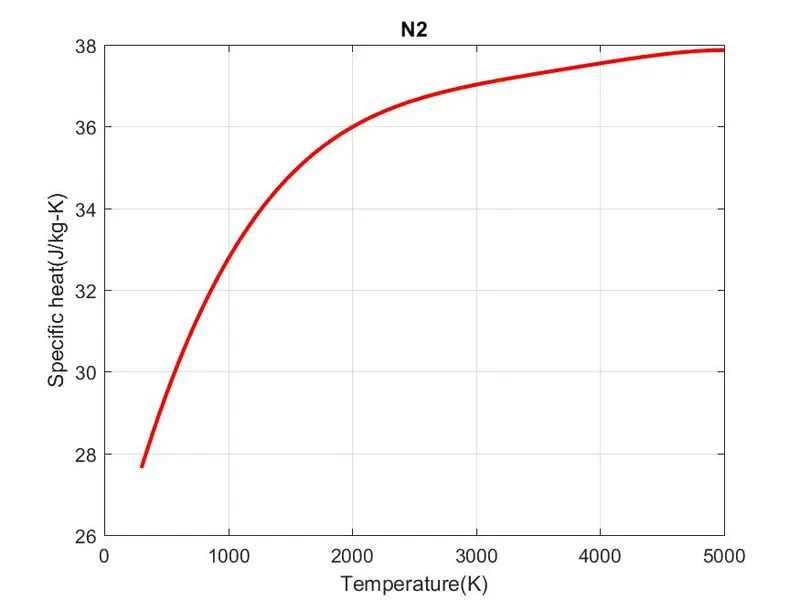
Temperature vs Specific heat (N2)
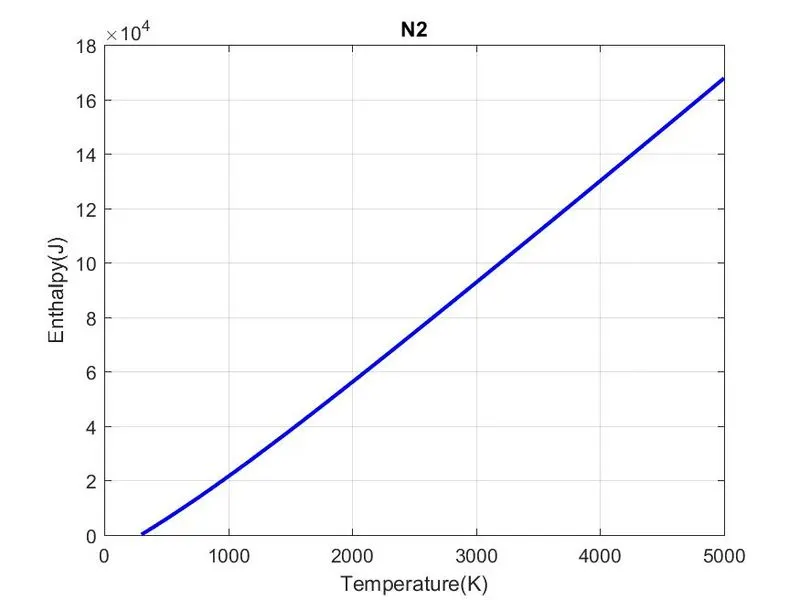
Temperature vs Enthalpy (N2)
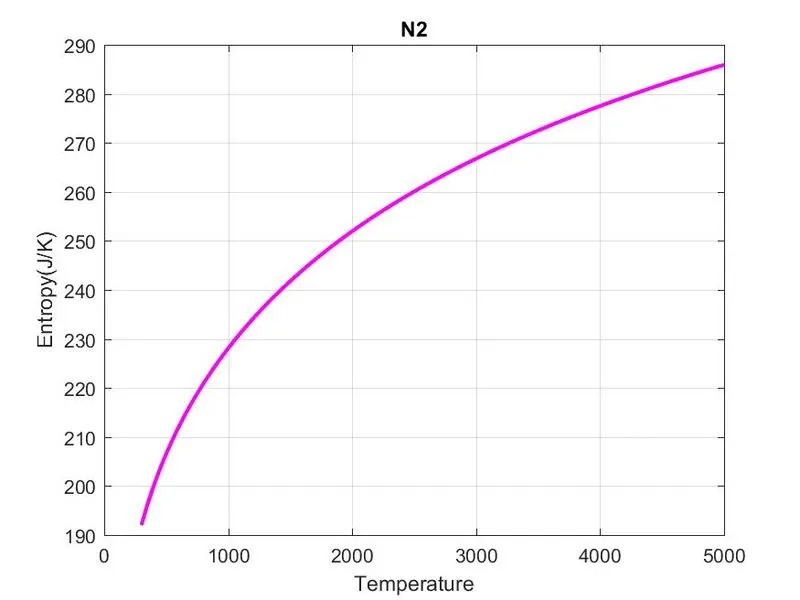
Temperature vs Entropy (N2)
Plot for CO2 :
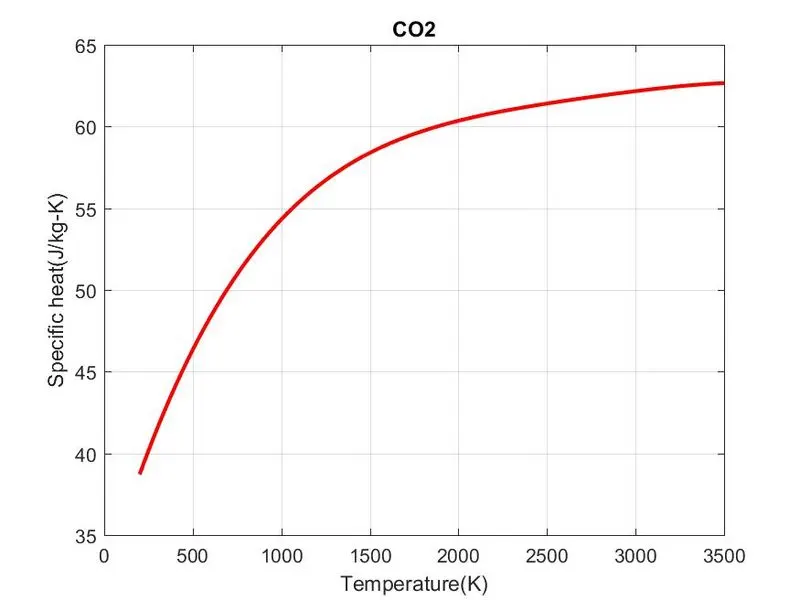
Temperature vs Specific heat (CO2)
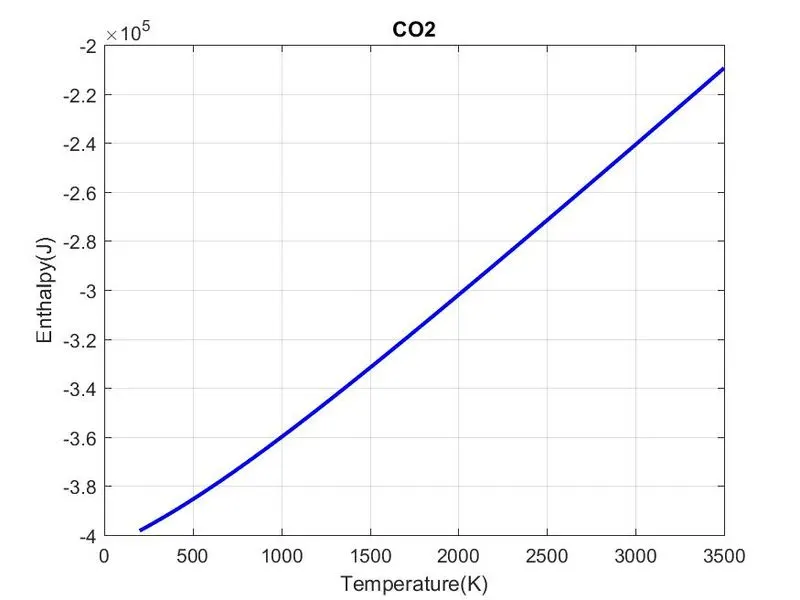
Temperature vs Enthalpy (CO2)
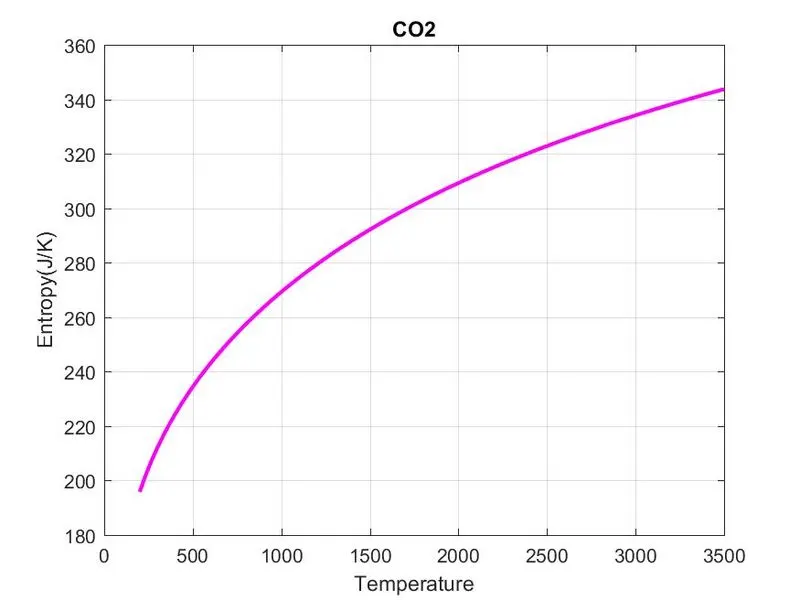
Temperature vs Entropy (CO2)
Screenshot of the window :

Molecular weight of species in command window :
Conclusion :
From the NASA thermodynamic data file elaluation of thermodynamis properties such as specific heat, enthalpy, entropy are calculated and molecular weight. And plot of Cp, enthalpy, entropy with respect to temperature are saved as image in the folder of each elements. And molecular weight of each species are displayed in command window.
All output folder link :
https://drive.google.com/drive/folders/1JQeRJQEmauKjOy9EW1LRvsblKlit1DXx?usp=sharing
Reference :
https://www.britannica.com/science/atomic-weight
https://byjus.com/physics/enthalpy/
https://www.vedantu.com/formula/specific-heat-capacity-formula