Week - 4
AIM:
To implement control logic of a washing machine using stateflow chart in simulink
working method of washing machine:
Intially Power and water is to be checked. if power is availble system gets activated.if water is not available it should filled automatically.
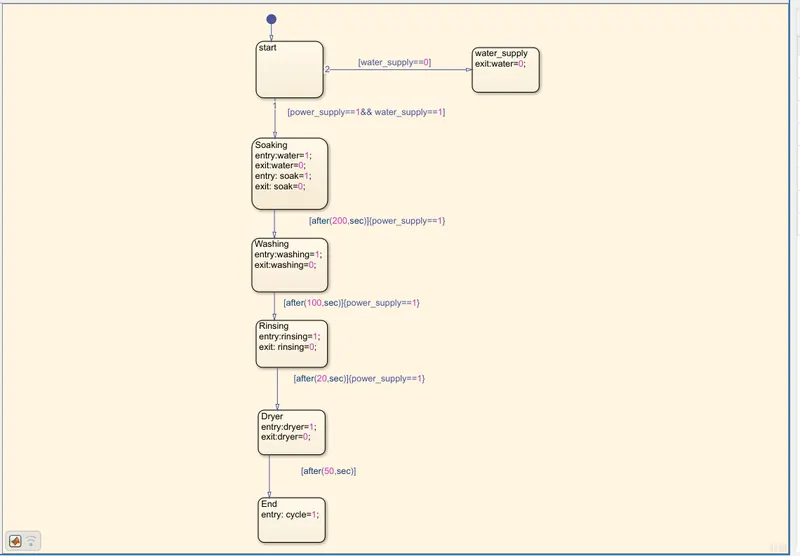
Four states involved in this machine to perform the given task.Each state is to be perfomed one after other by a time delay. To implement these conditions we prepare a state flow chart to perform complete the task with certain conditions.
soaking time should be 200s followed by washing time of 100s. Then Rinsing happens for next 20s & dryer runs for 50s.
After all the process have completed turn on the lamp.
objective:
Prepare a state flow chart for the washing machine with the given conditions and add power& water supply connections , display in the simulink model to show the each working process with the highlighting colour.
State flow chart:
state flow variables:
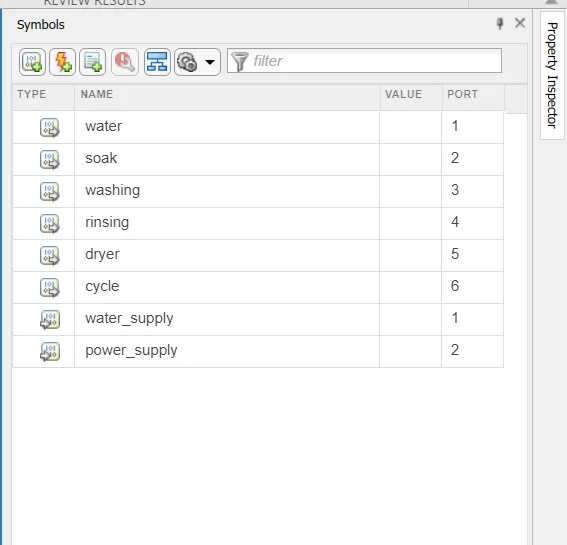
Inputs: power_supply, water_supply are the inputs
Outputs: watering,soaking,washing,rinsing,Dryer and cycle
Rocker switches
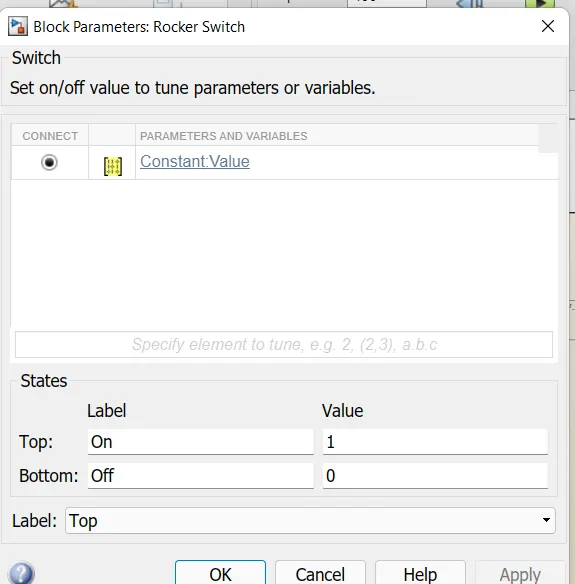
for ON/OFF rocker switches are added in the model. If value =1 switch is in ON , value=0 switch is off
Ports added to the state flow chart:
input ports and output ports are added to the flow chart
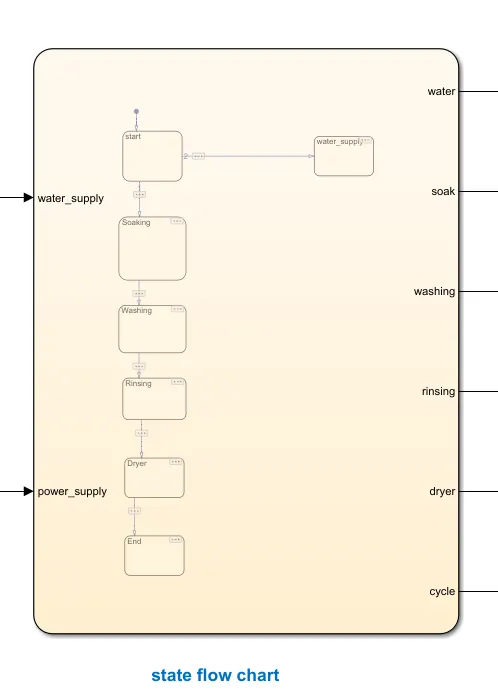
Ports are connected to the Display block and lamps are connected to the Display block to display the processes.
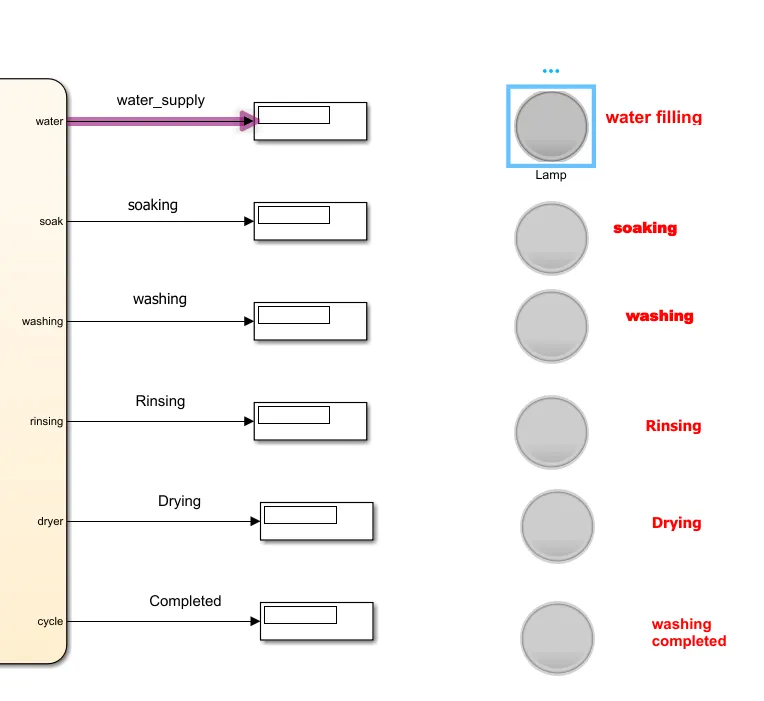
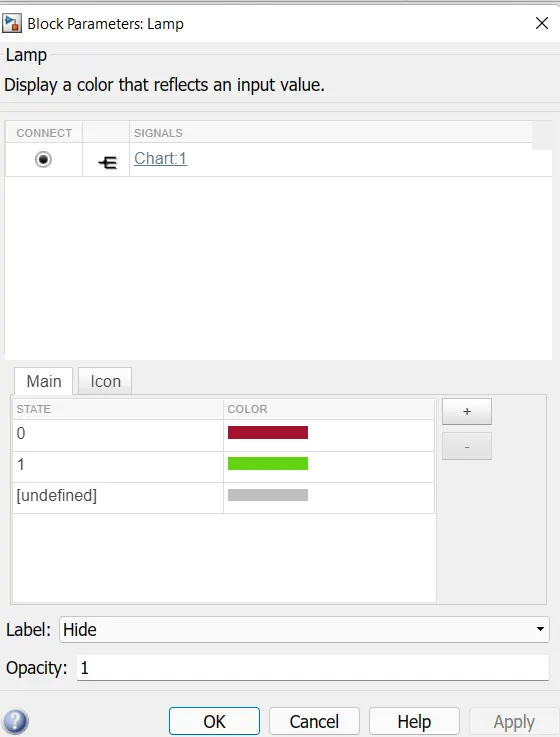
Total 6 lamps are connected to the Display blocks
Block diagram of washing machine
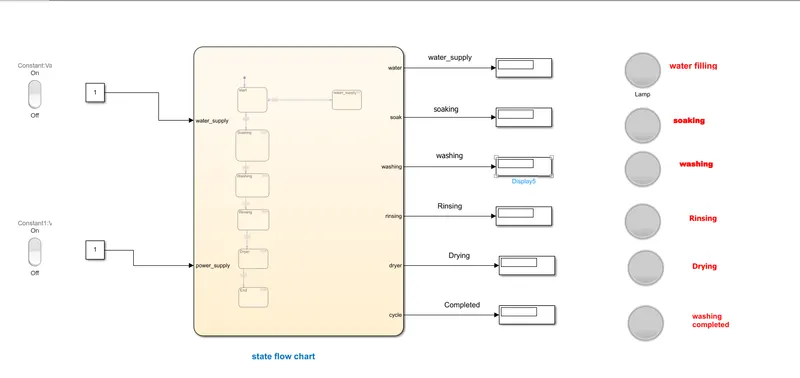
simulation results:
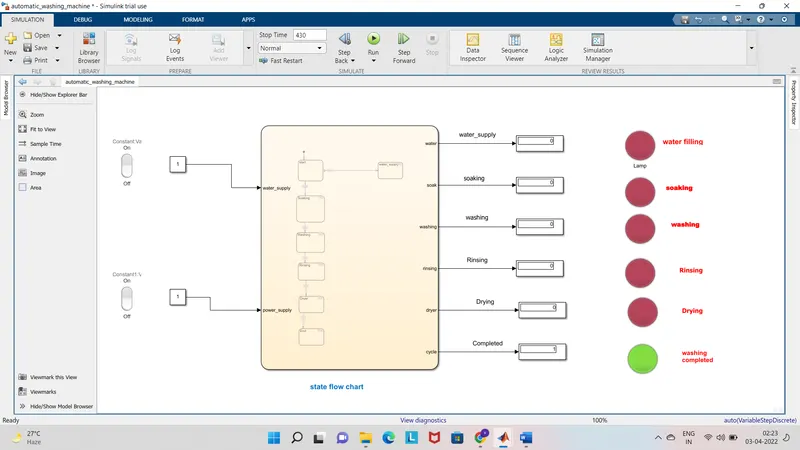
run the simulation for 430 seconds, washing is completed for this time period.it is indicated with the lamp.
remaing lamps are showing red colour which indicates all the processes are completed.
1.
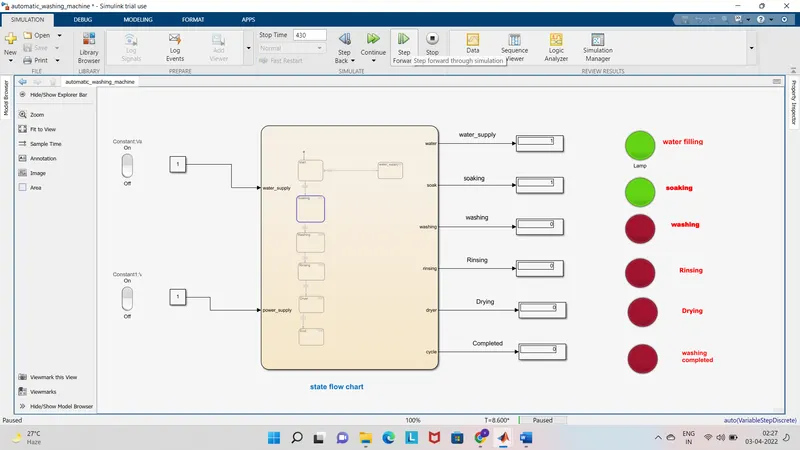
2. step by step procedure:
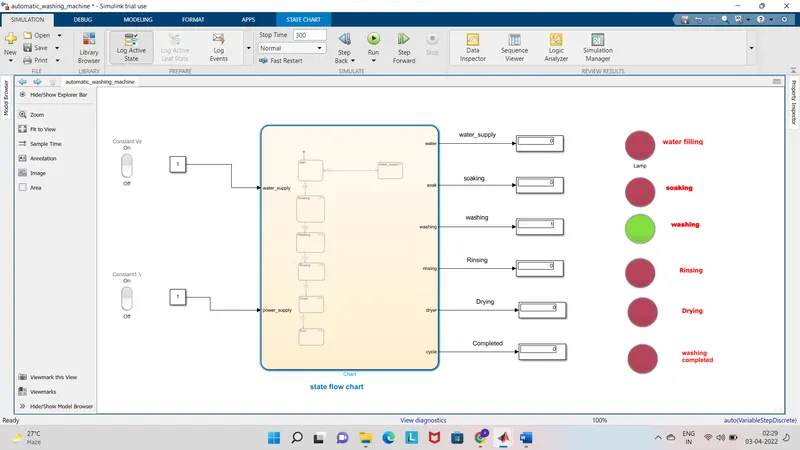
3.run the simulation for 300 seconds, it gives :
Question 2:
Aim: Make a simulink chart for the "Gear shift" with the given conditions
Objective:
preapare a chart to change the gears from one state to other according to the vehicle speed
| Speed | Gears |
| 0 to 15 | Gear 1 |
| 16 to 25 | Gear 2 |
| 26 to 40 | Gear 3 |
| 41 to 60 | Gear 4 |
| Above 60 | Gear 5 |
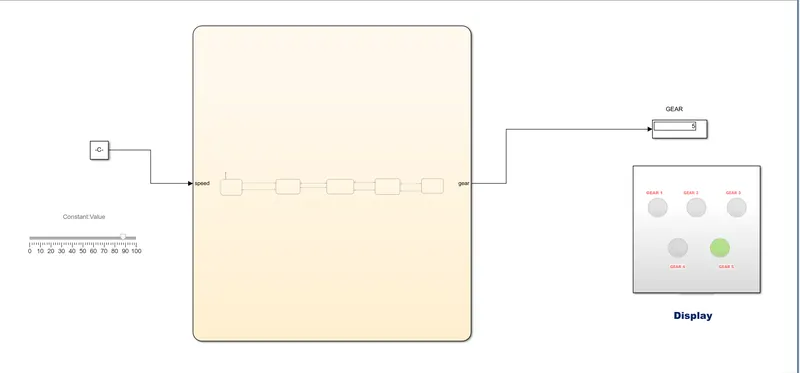
Model :
Blocks added in the chart:
1.slider (for the speed variation)
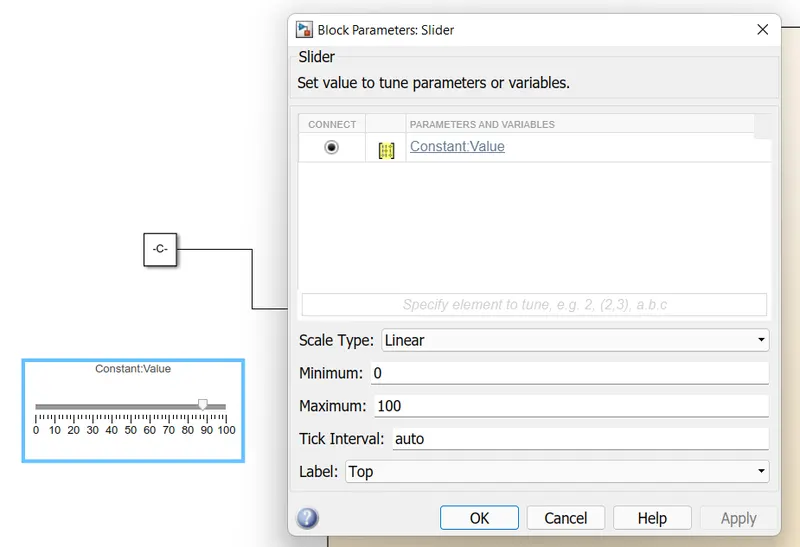
2. constant : this block is connected with slider
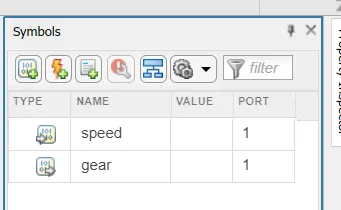
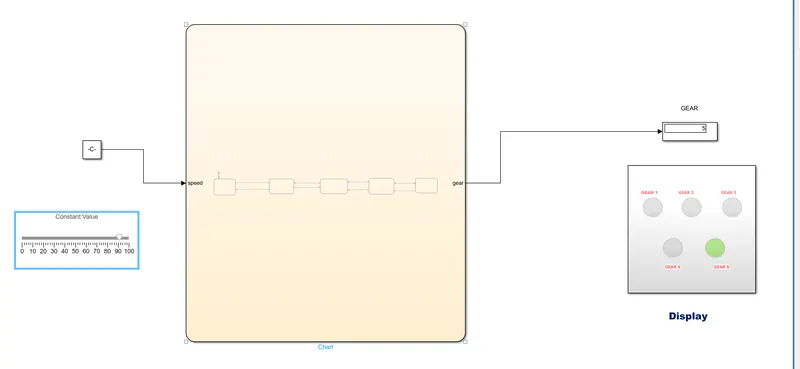
3. stateflow chart: two ports are added in the stateflow chart. speed is a input port. Gear is the output port.
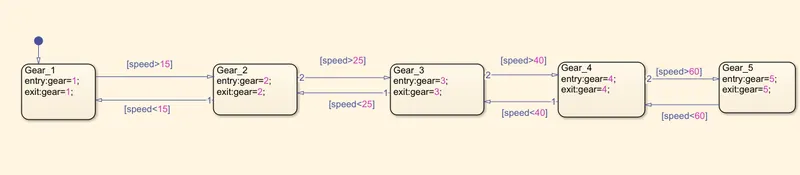
variables
4. Display : this block is connected with output port and with lamps to dispaly the gear position
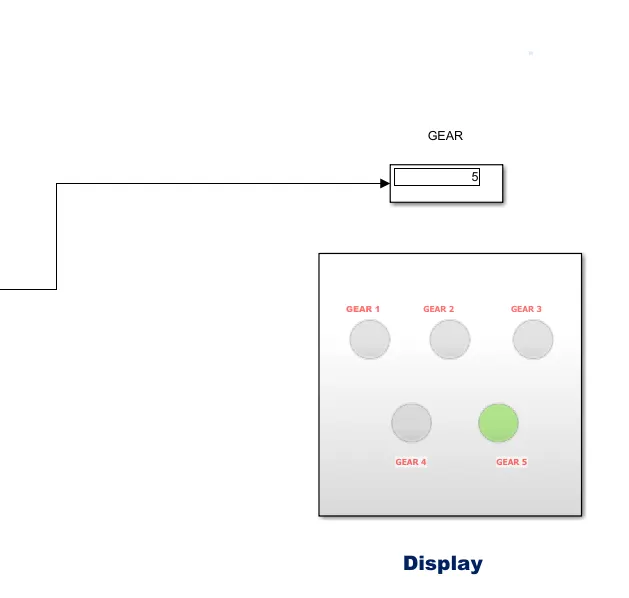
5. lamps: 5 lamps are used to display the status of gear and these lamps are created with a subsystem
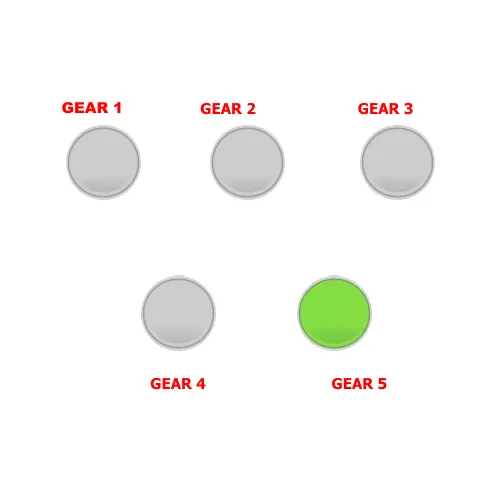
simulation results:
1. if vehicle speed is 95, its position is Gear5
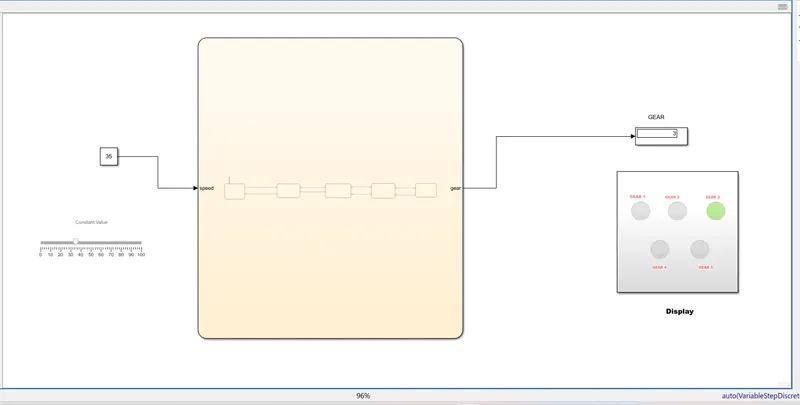
2.vehicle speed is 35:
simulation for the give speeds in the time intervals:
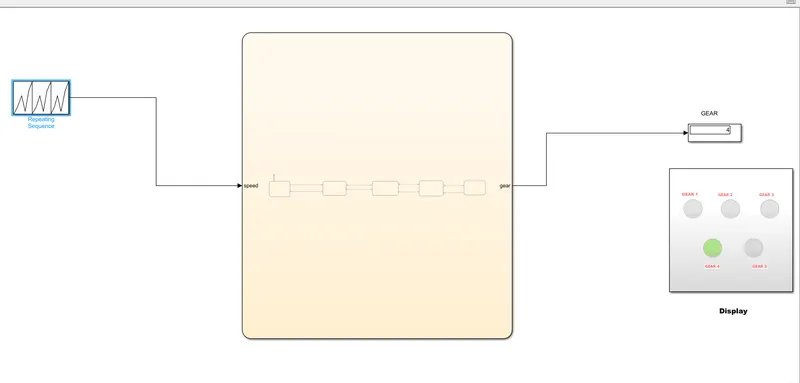
using repeating sequence:
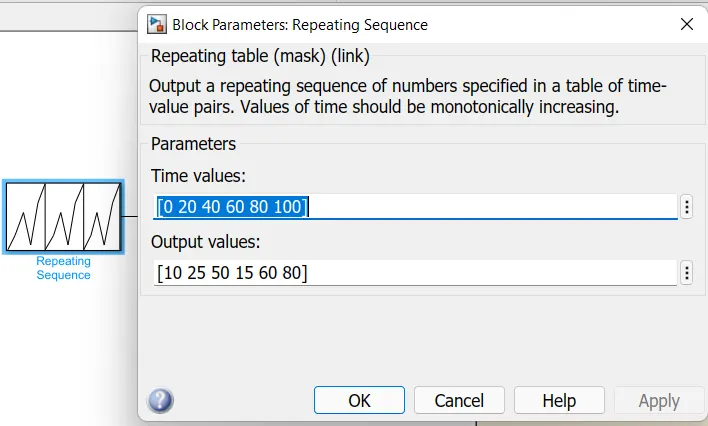
simulation for 120 sec
Display : Gear 2
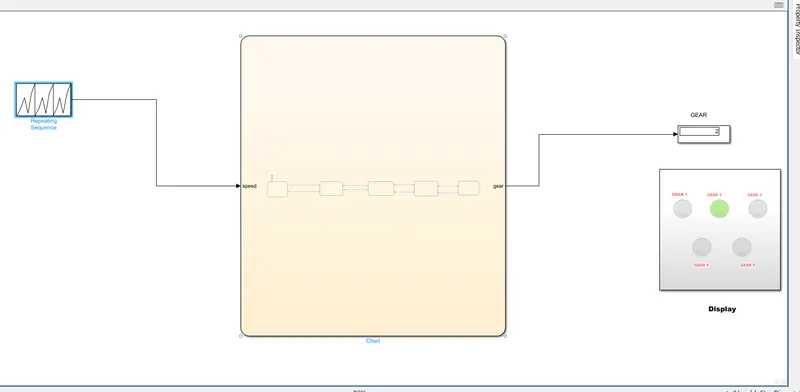
simulation for 180 seconds:
Gear 4