Week - 4
Control logic of a washing machine using state flow
Aim :
To implement control logic of a washing machine using state flow as per the given sequence.
Objective :
We have to create a control logic system for washing machine operations at given time interval for different operation sequence.
By using chart block we are to Implement the state flow of the washing machine sequence of operations at different time interval.
Theory :
The washing machine includes a controller communicating with the motor. The controller sends signals to the motor to rotate the basket at selective rotational speeds, and receives electronic signals indicating the power used to rotate the basket at selective speeds.
Its operation is very simple, when an input signal directs the control element to respond, an output will be produced.
Given data :
If power supply is available the system gets activated,
If the water supply is not available stop the process and indicate it through LED lamp,
Soaking should be 200s followed by washing time of 100s,
Then rinsing happens for the next 20s and dryer runs for 50s.
After completing all the set of operations with given time interval. It is to be indicated through a LED lamp.
Simulink block representation :
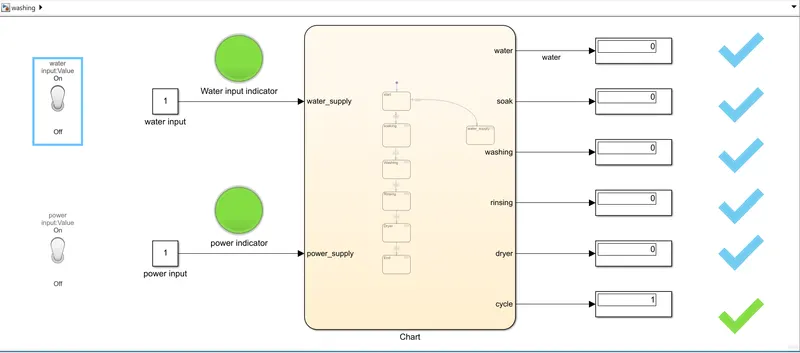
chart :
if input condition is off :
Block arrangement explanation :
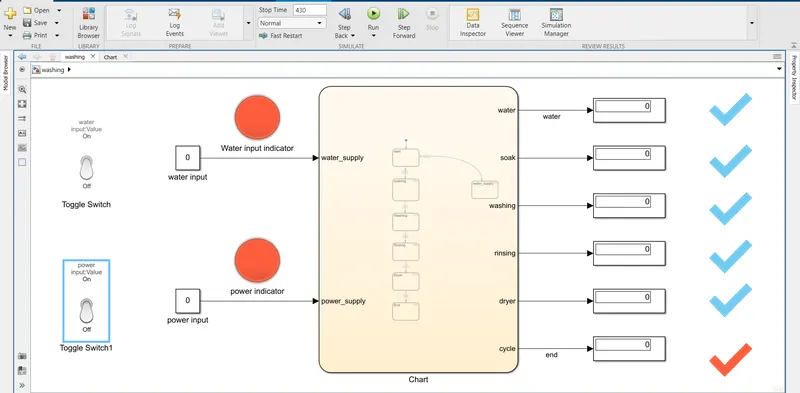
The inputs required for the operations are power and water. We have used a switch to control the inputs and we connect it with a LED lamp indication. (here I have used the toggle switch to control the inputs of the system).
The inputs are connected to the chart which contains the sequence of operations which is required in this system.
The chart block contains sequence of operations from start to end.
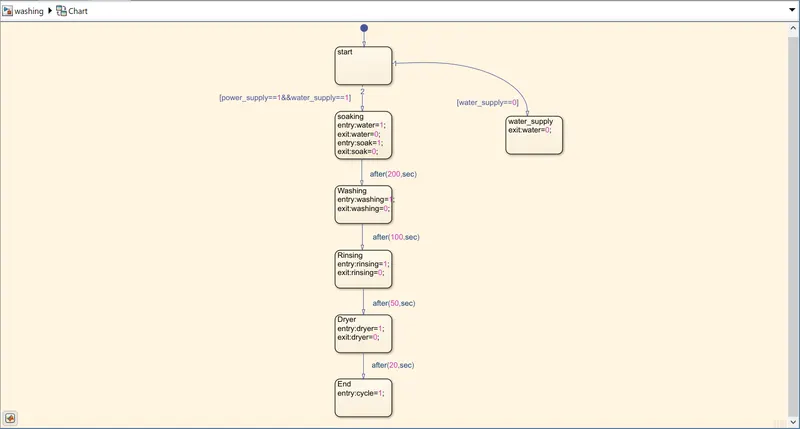
The sequence of operations,
Start - to initialize the operation with required inputs,
Soaking - first sequence of the operation with operating time interval of 200s,
Washing - second sequence of the operation with operating time interval of 100s,
Rinsing - third sequence of operation with operating time interval of 20s,
Dryer - fourth sequence of operation with operating time interval of 50s,
End - this is the final completion of above states connected with an LED which indicates the above operations are completed.
The outputs of the control logic flow is connected to the display and LED lamps where the display shows the output values of different operations.
Finally the LED indication lamp with green signal indicates the sequence of process are completed. If not completed it will signal in red colour.
Result :
The control logic of the washing machine using state flow is created as per the given data conditions. And by running the created model for 430secs we have got he result successfully using simulink.
Conclusion :
In this project the given conditions are created in a chart block so the set of sequence is dumped into the chart and which makes the system to look simple and easy to get result.
-----------------------------------------------------------------------------------------------------------------------
Simulink chart for gear shift logic system
Aim :
To create simulink chart for gear shift logic system as per the given conditions and to display the results of gear range with respect to speed.
Objective :
The gear logic system works with the input as speed which can be changed low to high or high to low. So as per the difference in the speed value the appropriate gear range is to be displayed.
The logics in this system are minimized with chart block which holds the set of different blocks with gear range and it’s condition in the system.
Theory :
The gear shifter allows the vehicle to be put into different gears on a manual transmission. In an automatic transmission, the gear shifter is known as a gear selector. The gear shifter is normally located between the two front seats of the vehicle on a manual transmission.
The State flow chart models the shifting of gears based on throttle and speed of the vehicle. The down threshold and up threshold outputs represent minimum and maximum speed values that throttle and current gear are able to handle. The Simulink function calculate thresholds calculates these two values using throttle and gear as inputs.
Given data :
Speed range (kmph). gear range
00 – 15 1
16 – 25 2
26 – 40 3
41 – 60 4
Above 61 5
Simulink block representation :
output reference :
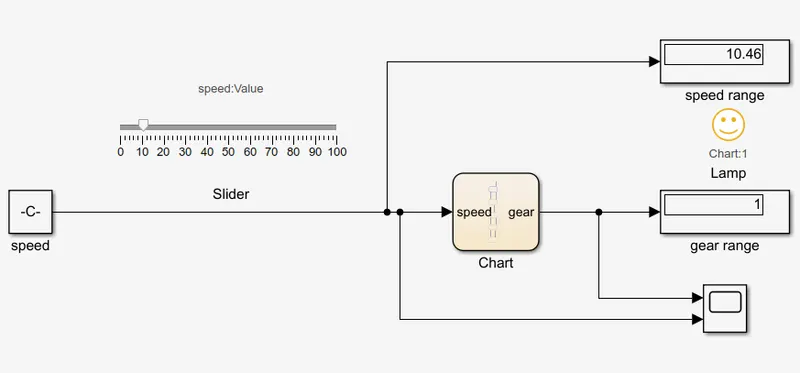
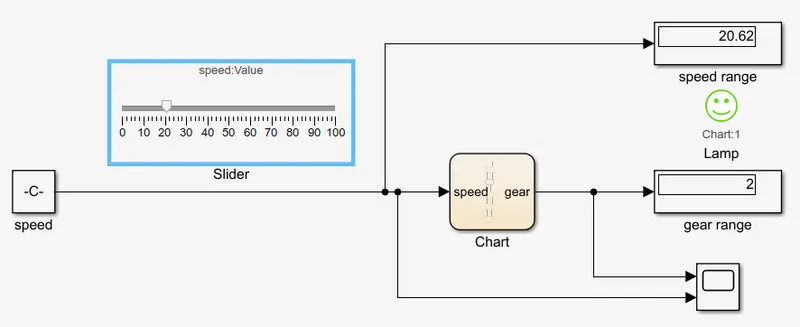
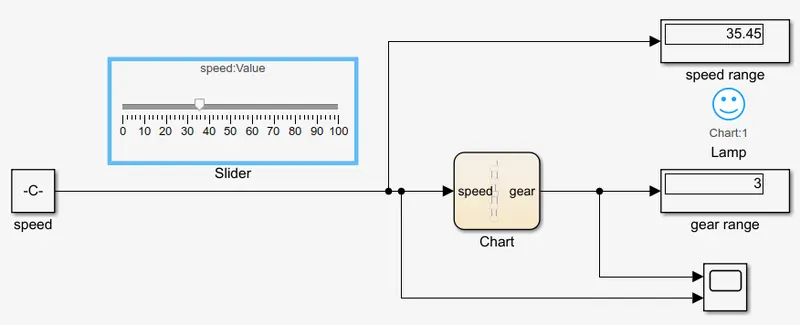
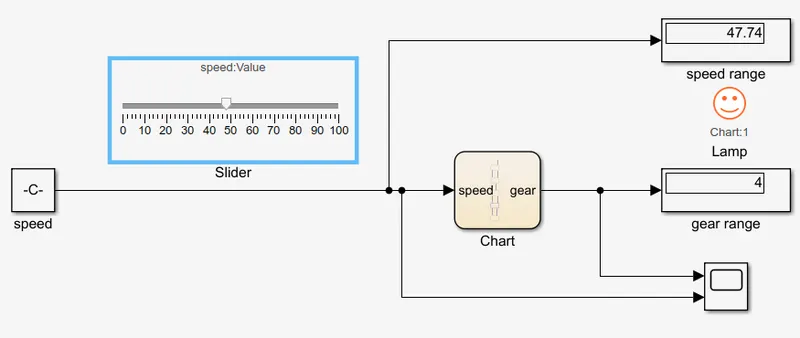
Block arrangement explanation :
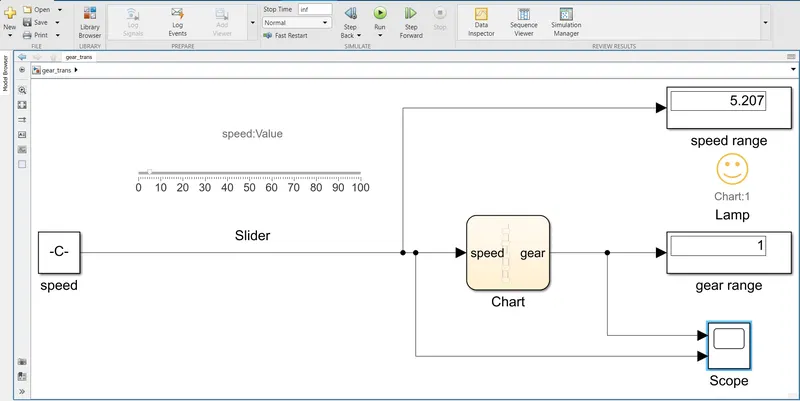
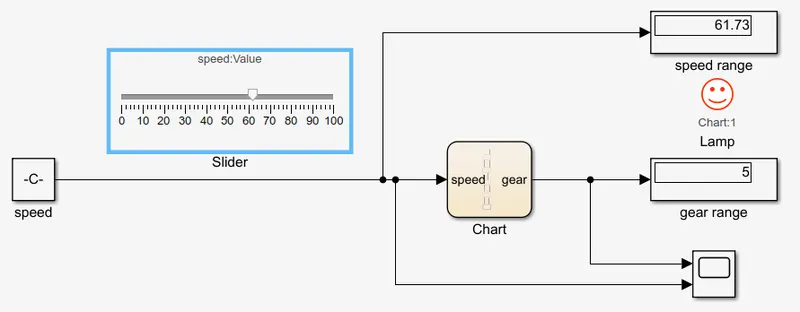
Here the input is the speed value and I had made a slider block connected to constant block through this the input variation happens in the system.
Chart block is used to simplify the model of the system. Chart consists the conditions between each gear at different state block.
The above given conditions are used between the state block to get the desired output gear range.
When the input is applied the input enters the logic flow chart system and compares with different state conditions to provide result as per the input value.
In output I have connected display block, lamp indicator and a scope block.
The display gives us the gear range as per the input speed value and the lamp is configured to indicate us in different colour as per the change in gear value.
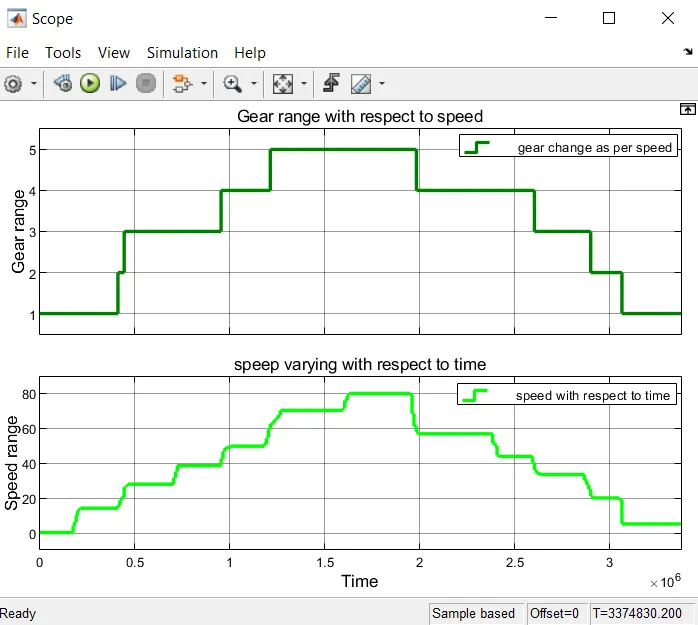
The scope block is connected with blocks one is the input and the output so by using this we can get a graph as how the system works.
Result :
Simulink chart for gear shift logic system is created and ran the model to get output as per the given conditions successfully using matlab simulink.
Conclusion :
the chart has been created for a gear shift logic system as per the given conditions and we got the results attached for reference.