Project 1 - Parsing NASA thermodynamic data
Parsing NASA Thermodynamic Data
Aim :
To make a function that extracts 14 co-efficients and to calculate specific heat, enthalpy, entropy for all the species in the given data file.
Objective :
By using the given thermo.dat file we are to extract the co-efficient values and to calculate the values for specific heat, enthalpy, entropy.
Theory :
Specific heat (cp) :
The quantity of heat required to raise the temperature of one gram of substance by one celcius degree
The unit of specific heat are usually calouries or joules per gram per celcius degree
Q = m*c*∆T
Entropy (s) :
It is a thermodynamic quantity representing the unavailability of a system’s thermal energy for conversion into mechanical work. Often interpted as the degree of disorder or randomness in the system
The second law of thermodynamics says that entropy always increase with time
S = kb*ln*Ω
Enthalpy (H) :
A thermodynamic quantity equalent to the total heat content of a system. It is equal to the internal energy of the system plus the product of pressure and volume
H = E+PV
The NASA polynomials :
Cp/R = a1 + a2 T + a3 T^2 + a4 T^3 + a5 T^4
H/RT = a1 + a2 T /2 + a3 T^2 /3 + a4 T^3 /4 + a5 T^4 /5 + a6/T
S/R = a1 lnT + a2 T + a3 T^2 /2 + a4 T^3 /3 + a5 T^4 /4 + a7
where a1, a2, a3, a4, a5, a6, and a7 are the numerical coefficients supplied in thermo.dat file. The first 7 numbers starting on the second line of each species entry (five of the second line and the first two of the third line) are the seven coefficients (a1 through a7, respectively) for the high-temperature range (above 1000 K, the upper boundary is specified on the first line of the species entry). The following seven numbers are the coefficients (a1 through a7, respectively) for the low-temperature range (below 1000 K, the lower boundary is specified on the first line of the species entry).
Here we are to find the values for different thermodynamic properties like specific heat, Entropy, Enthalpy. To calculate those values we are to make function that compares the statement and executes the result value
Defiitions :
R = 8.314 (universal gas constant)
T = Temperature
a(i) = coefficients, where i = 1 to 14
calculations :
creating functions to simplify the calculation
specific heat (cp)
function cp = Specificheat(a1,a2,a3,a4,a5,a8,a9,a10,a11,a12,T,R,midtemp);
%comparing with global temperature
%if less than global temp then minimum coefficients are taken
if (T<= midtemp)
    cp = R*(a8+(a9*T)+(a10*(T).^2)+(a11*(T).^3)+(a12*(T).^4));
else
    cp = R*(a1+(a2*T)+(a3*(T).^2)+(a4*(T).^3)+(a5*(T).^4));
    %else maximum coefficients are taken
end
Entropy (S)
function s =Entropy(a1,a2,a3,a4,a5,a7,a8,a9,a10,a11,a12,a14,T,R,midtemp);
%comparing with global temperature
%if less than global temperature minimum coefficients are taken
if T <= midtemp
    s = R.*(a8.*log(T)+(a9.*T)+(a10*((T).^2)/2)+(a11*((T).^3)/3)+(a12*((T).^4)/4)+a14);
else
    %else maximum coefficients are taken
    s = R.*(a1.*log(T)+(a2.*T)+(a3*((T).^2)/2)+(a4*((T).^3)/3)+(a5*((T).^4)/4)+a7);
end
Enthalpy (H)
function H = Enthalpy(a1,a2,a3,a4,a5,a6,a8,a9,a10,a11,a12,a13,T,R,midtemp);
%comparing with global medium temperature
%if less than global temp minimum coefficients are taken
if T<= midtemp;
    H = R*T.*(a8+((a9*T)/2)+((a10*(T).^2)/3)+((a11*(T).^3)/4)+((a12*(T).^4)/5)+((a13./T)));
else
    %else maximum coefficients are taken
    H =R*T.*(a1+((a2*T)/2)+((a3*(T).^2)/3)+((a4*(T).^3)/4)+((a5*(T).^4)/5)+((a6./T)));
end
Molecular weight
function Molecularweight = Molecular_weight(species);
%standard -atomic name
atomic_name = ['H','C','O','N','A'];
%Hydrogen,Corbon,Oxygen,Nitrogen,Argon
fprintf('molecular weight of ')
fprintf(species);
fprintf(' : ');
%standard atomic number
Atomic_weight = [1.008 12.011 15.999 14.007 39.948];
%starting range of molecule
Molecularweight = 0;
%adding atomic number to obtain particular value
for i = 1:length(species)
    for j = 1: length(atomic_name)
        if strcmpi(species(i),atomic_name(j))
            Molecularweight = Molecularweight + Atomic_weight(j);
            position = j;
        end
    end
    n = str2num(species);
    if n > 1
        Molecularweight=Molecularweight+Atomic_weight(position)*(n-1);
    end
end
fprintf('Molecularweight %s :-',species);
fprintf('%f',Molecularweight);
disp(' ');
end
Matlab code presentation :
clear all
close all
clc

% gas constant J/(mol-K)
R = 8.314;

%reading the given data file
f1 = fopen('THERMO.dat','r');
get = fgetl(f1);

%reading the temperatures values from the file
global_temp = fgetl(f1);

%splitting the string
s = strsplit (global_temp);

%converting string to number
low_temp = str2num(s{2});
mid_temp = str2num(s{3});
high_temp = str2num(s{4});

%skipping comment lines
for i = 1:3
    get = fgetl(f1)
end

%reading the species
for j = 1:53
    tline = fgetl(f1)

    A = strsplit(tline,' ');
    species = (A{1});

    %converting string to number
    lowtemp = str2num(A{end-3});
    midtemp = str2num(A{end-2});
    hightemp = str2num(A{end-1});

%temperature range
T = linspace(lowtemp,hightemp,1000);
    tline1 = fgetl(f1);
    a = strfind(tline1,'E');
    %finding first 7 higher coefficients
    a1 = tline1(1:a(1)+3);
    a1 = str2num(a1);
    a2 = tline1(1:a(2)+3);
    a2 = str2num(a2);
    a3 = tline1(1:a(3)+3);
    a3 = str2num(a3);
    a4 = tline1(1:a(4)+3);
    a4 = str2num(a4);
    a5 = tline1(1:a(5)+3);
    a5 = str2num(a5);

    tline2 = fgetl(f1);
    b = strfind(tline2,'E');
    a6 = tline1(1:b(1)+3);
    a6 = str2num(a6);
    a7 = tline1(b(1)+4:b(2)+3);
    a7 = str2num(a7);

    %finding lower order coefficients
    a8 = tline2(b(2)+4:b(3)+3);
    a8 = str2num(a8);
    a9 = tline2(b(3)+4:b(4)+3);
    a9 = str2num(a9);
    a10 = tline2(b(4)+4:b(5)+3);
    a10 = str2num(a10);

    tline3 = fgetl(f1);
    c = strfind(tline3,'E');
    a11 = tline3(1:c(1)+3);
    a11 = str2num(a11);
    a12 = tline3(c(1)+4:c(2)+3);
    a12 = str2num(a12);
    a13 = tline3(c(2)+4:c(3)+3);
    a13 = str2num(a13);
    a14 = tline3(c(3)+4:c(4)+3);
    a14 = str2num(a14);

    %calculate specific heat
    cp = Specificheat(a1,a2,a3,a4,a5,a8,a9,a10,a11,a12,T,R,midtemp);

    %calculate entropy
    s =Entropy(a1,a2,a3,a4,a5,a7,a8,a9,a10,a11,a12,a14,T,R,midtemp);

    %calculate enthalpy
    H = Enthalpy(a1,a2,a3,a4,a5,a6,a8,a9,a10,a11,a12,a13,T,R,midtemp);

    %calculate molcular weight
    Molecularweight = Molecular_weight(species);

    %writing molecular weight into file
    MW_file = fopen('Molecular weight.txt','a+');
    fprintf(MW_file,'Molecular weight of %s is %d \n',species,Molecularweight);
    fclose(MW_file);

    %plotting cp, H and S with temperature
    %saving in folder

    mkdir(['C:\Users\NISHANTH\Documents\MATLAB\Examples\R2021b\matlab\nddemo\matlab_course\NASA\',species]);

    %plot 1 specificheat (cp) vs Temperature (T)
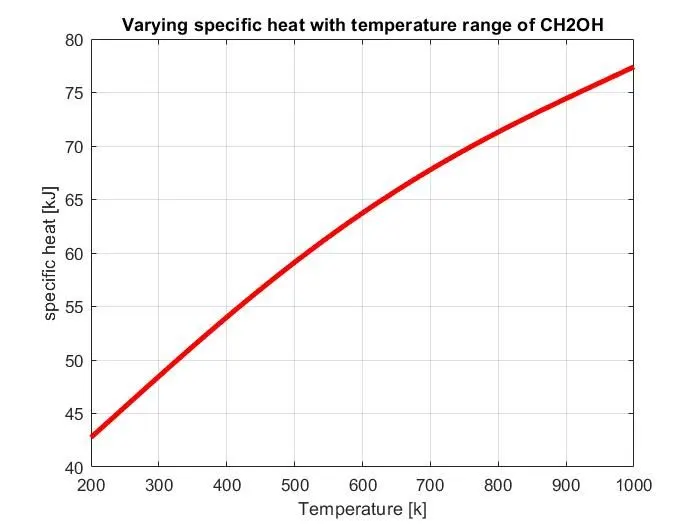
    figure(1)
    plot(T,cp,'LineWidth',3,'Color','r');
    xlabel('Temperature [k]');
    ylabel('specific heat [kJ]');
    title(sprintf('Varying specific heat with temperature range of %s',species));
    grid on


    %plot 2 Entropy (s) vs Temperature (T)
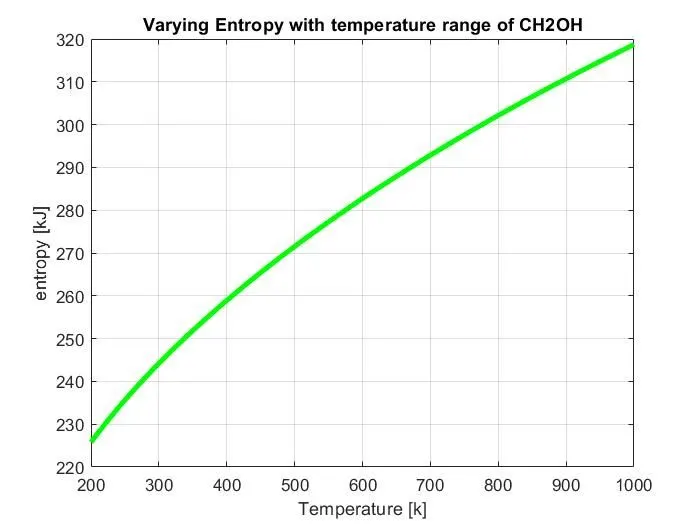
    figure(2)
    plot(T,s,'LineWidth',3,'color','g');
    xlabel('Temperature [k]');
    ylabel('entropy [kJ]');
    title(sprintf('Varying Entropy with temperature range of %s',species));
    grid on

    %plot 3 Enthalpy (H) vs Temperature (T)
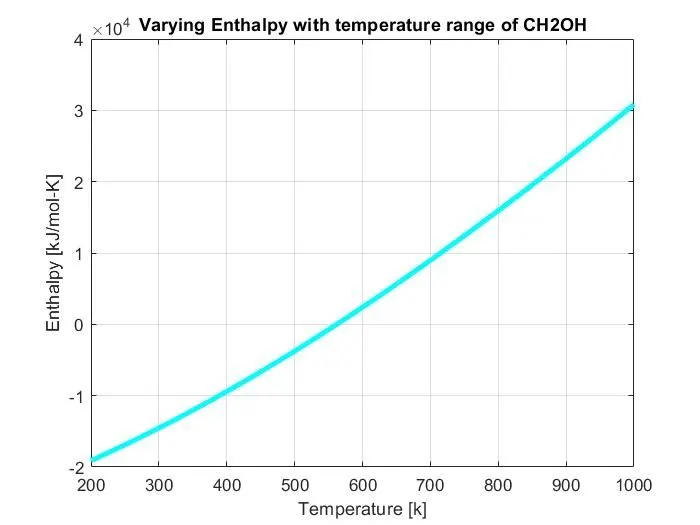
    figure(3)
    plot(T,H,'LineWidth',3,'color','cyan');
    xlabel('Temperature [k]');
    ylabel('Enthalpy [kJ/mol-K]');
    title(sprintf('Varying Enthalpy with temperature range of %s',species));
    grid on

    cd(['C:\Users\NISHANTH\Documents\MATLAB\Examples\R2021b\matlab\nddemo\matlab_course\NASA\',species]);
    saveas(figure(1),'specific heat')
    saveas(figure(2),'Entopy');
    saveas(figure(3),'Enthalpy');

    %molecular weight
    M = Molecular_weight(species)

end
Code explanation :
- Clear all, close all, clc to remove older values and to clear the window
- f1 = fopen('THERMO.dat','r') by using this command we open the file thermo.dat and we read the file
- s = strsplit (global_temp) by using this command it splits str on the elements of delimiter.
- ‘str2num’ convert character array or string to numeric array,
- tline = fgetl( fileID ) returns the next line of the specified file,
- ‘fgetl’ to read line from the file
- ‘strfind’ to find one string with another
- ‘fprintf’ displays formatted text centered on the icon and can display formatSpec along with the contents of var,
- ‘pwd’ identify current directory
- ‘mkdir’ make a new directory to save files
- ‘cd’ change working directory
- We have used for loop to read all the 53 species and did the calculation
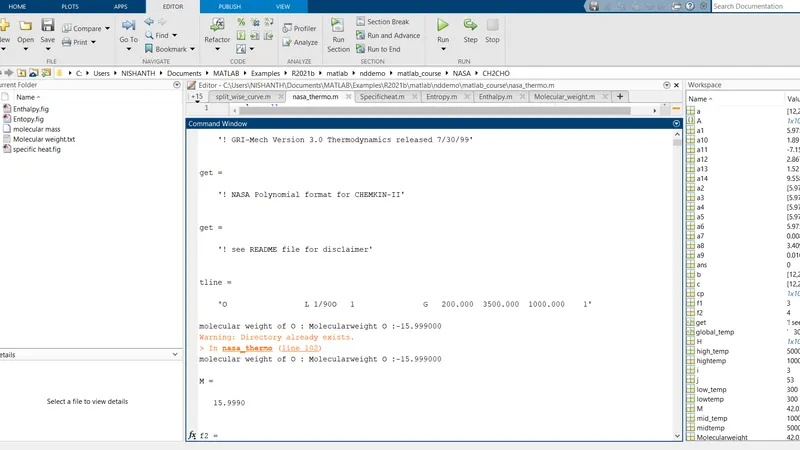
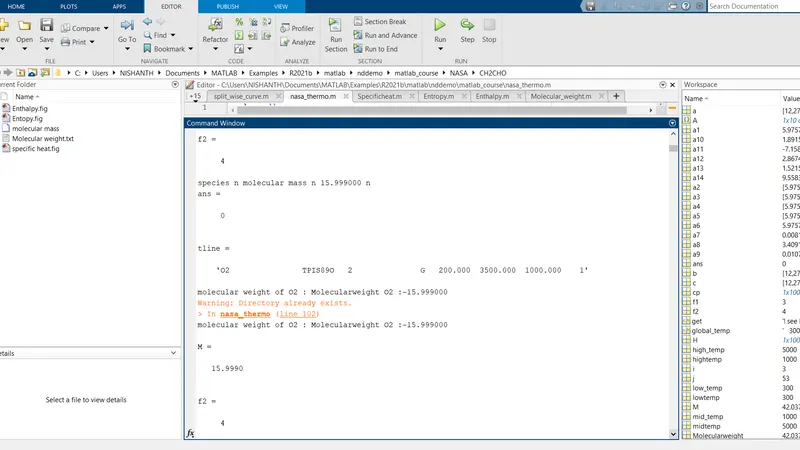
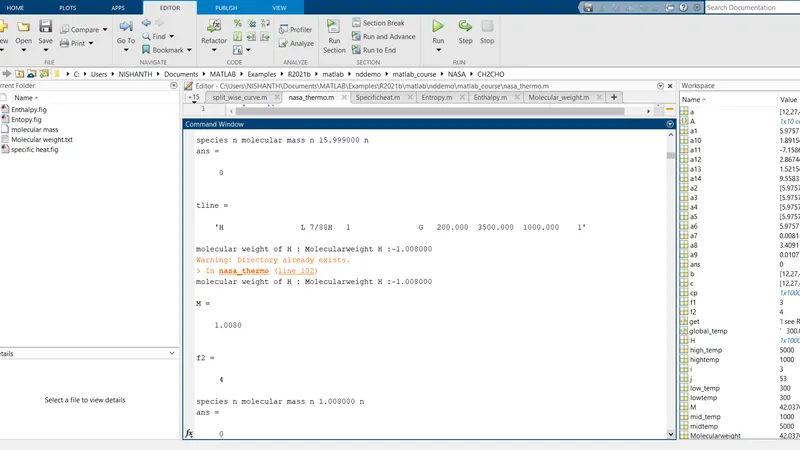
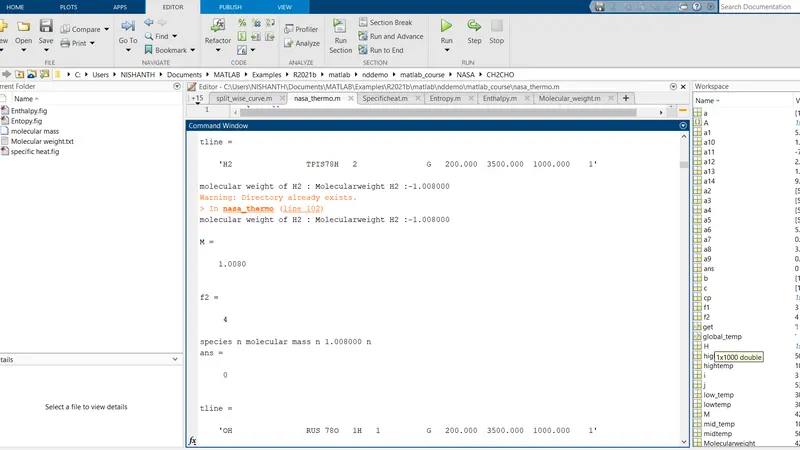
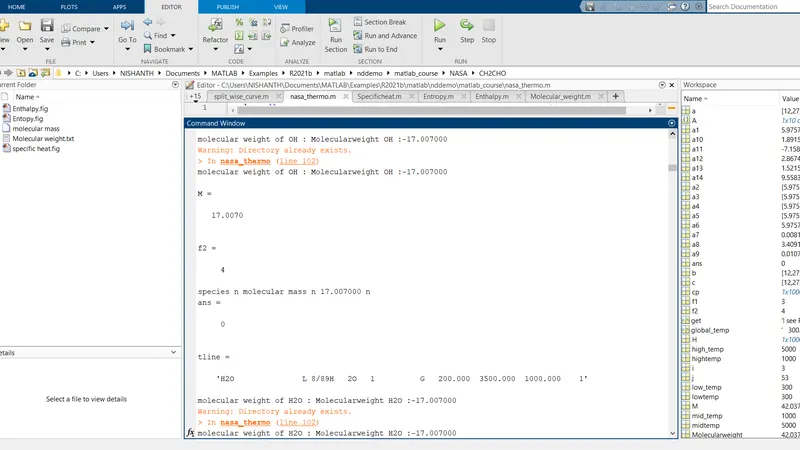
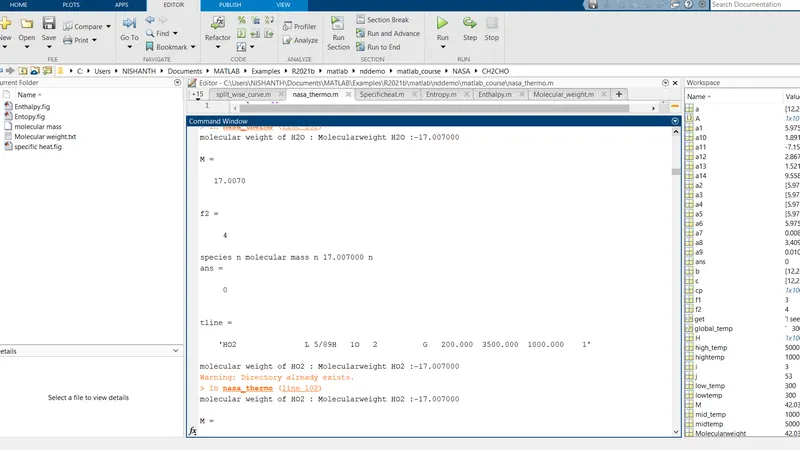
- The molecular weight is also calculated and displayed in the command window
- We have plotted the cp, Enthalpy, Entropy for the local temperature range of all the species
- The plots and the images are dumped into the separate folder for each species with suitable name
Screenshort for reference :
- Molecular weight value printed in command window
Result :
we have separated the 14 coefficients and calculated specific heat, Enthalpy, Entropy and molecular weight for all the species given in the data file
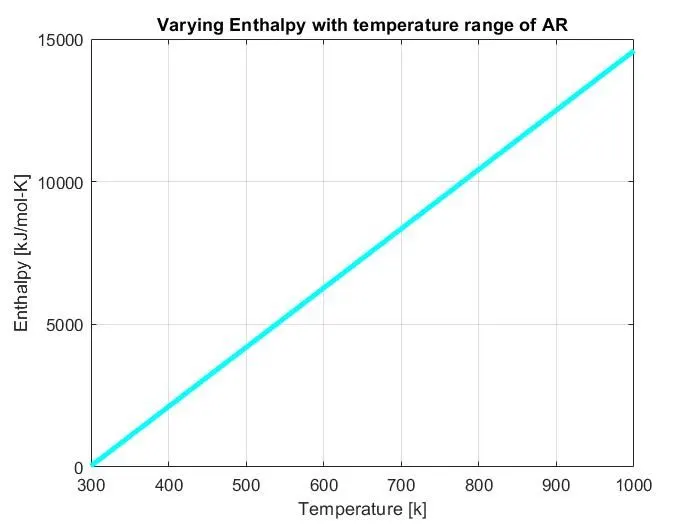
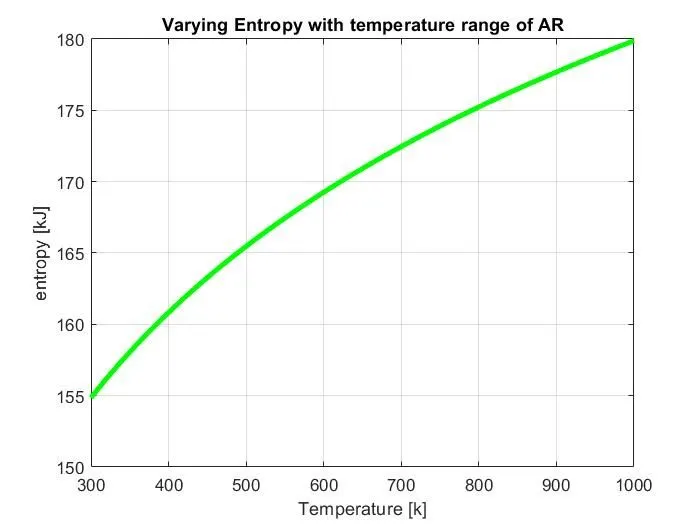
The plots are created for all the species vs ( cp, S, H) and the results are dumped successfully in separate folder for each species successfully using Matlab
The output figures of few species are included here,

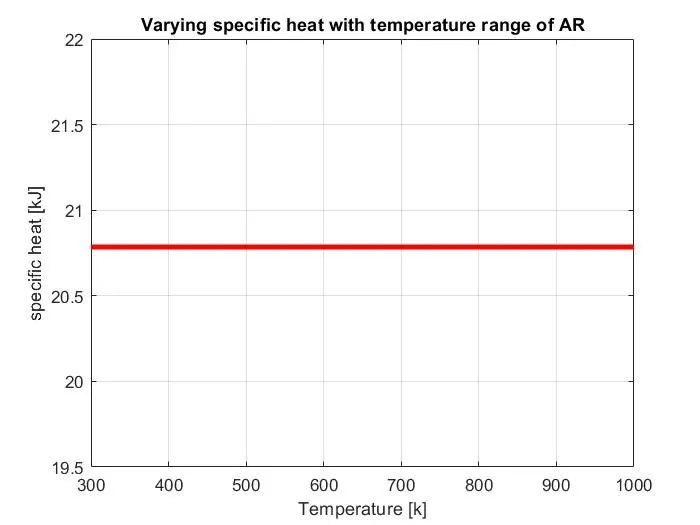
species C2H
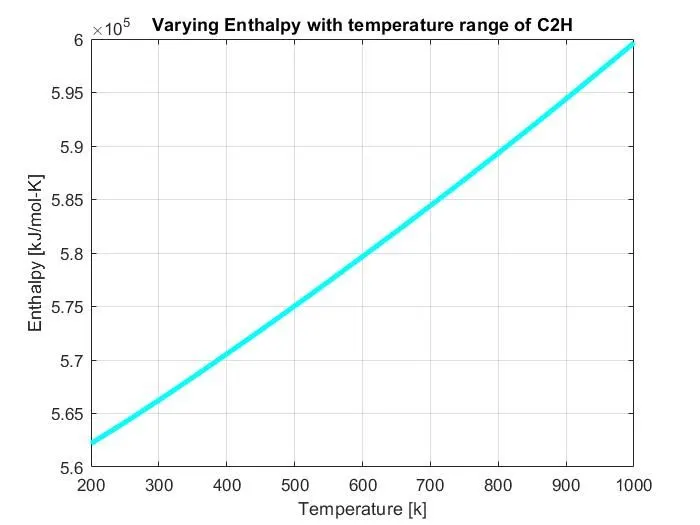
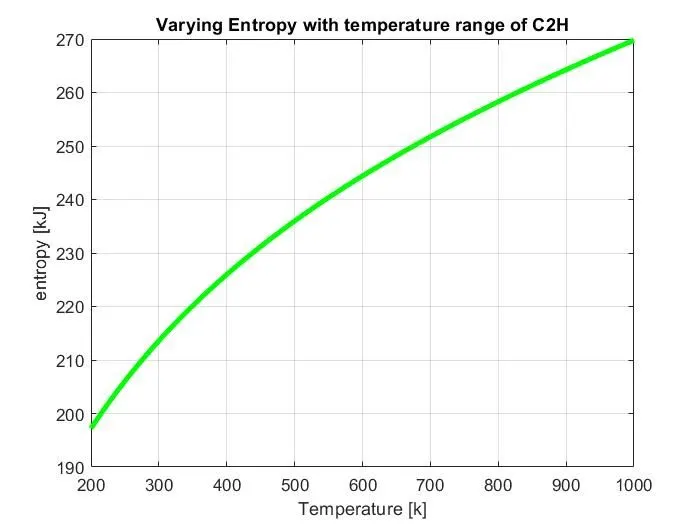
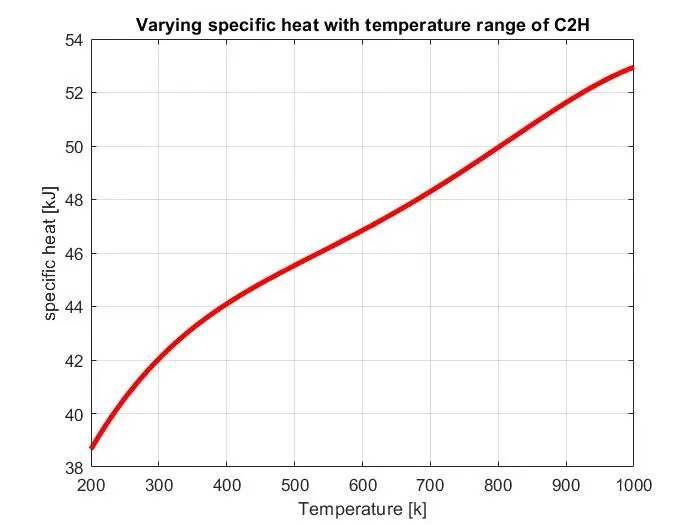
species CH2OH
Conclution :
In this Parsing NASA Thermodynamic Data we have learned to read and do calculations for a bunch of different species given in the file thermo.dat and plotted the figure of all the species successfully using Matlab.