Week - 4
PROJECT-1:
AIM:
To create a simulink model for the process of washingmachine using state flow.
OBJECTIVES:
To Implement control logic of a “washing machine” using Stateflow as per given sequence:
- If the power supply is available, the system gets activated
- If the Water supply is not available, stop the process & indicate through LED
- Soaking time should be 200s followed by Washing time of 100s.
- Then rinsing happens for next 20s & dryer runs for 50s
MODEL:
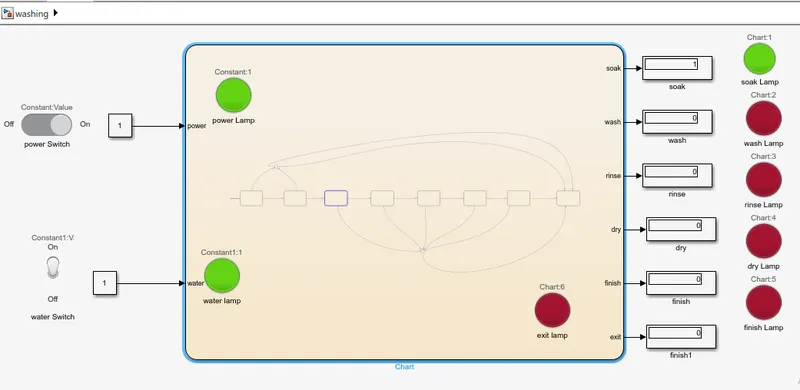
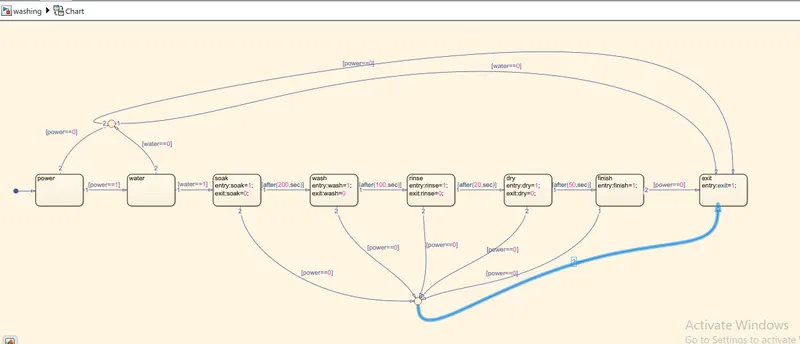
EXPLANATION:
- Firstly after opening the simulink select the chart in the library.
- Double click on the chart, it will take to the control logic dashboard.
- select the block set of power and water represent respectively.
- Give the condition as power==1 and water==1 such that it will move to the further blocks other wise terminate the blocks and exit.
- Next move to the soak after evaluating the two conditions.
- In soak block we have given a condition as entry:soak=1 and exit:soak=0 unitil the satisfying the condition it will do the process of soaking.
- after all conditions completed next need to move to the wash after 200sec of soaking.
- after 100 seconds of washing need to move to the dry.
- After completing the drying for 50 sec need to go the the finish.
- During running at any point of time if any condition failed need to exit the blocks.
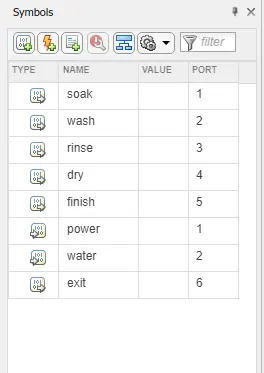
- Assign the symbols used in the block and give the entered data as input/output in the symbol box.
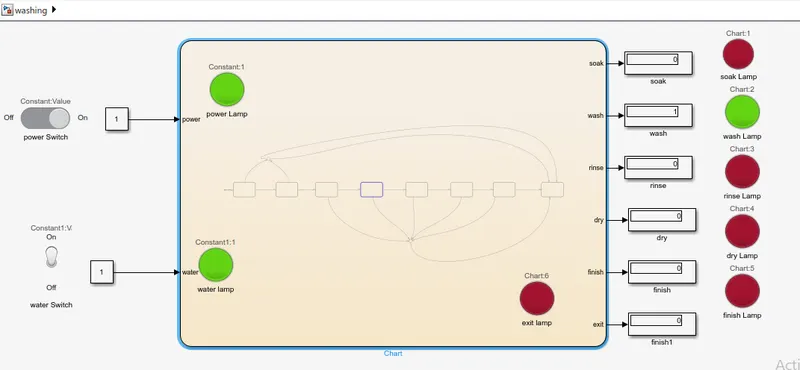
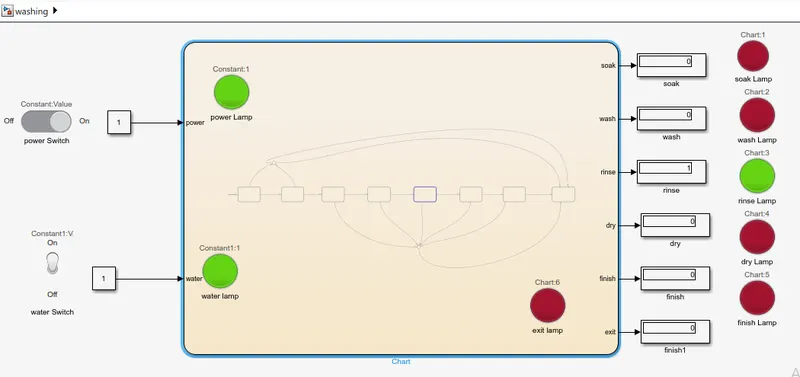
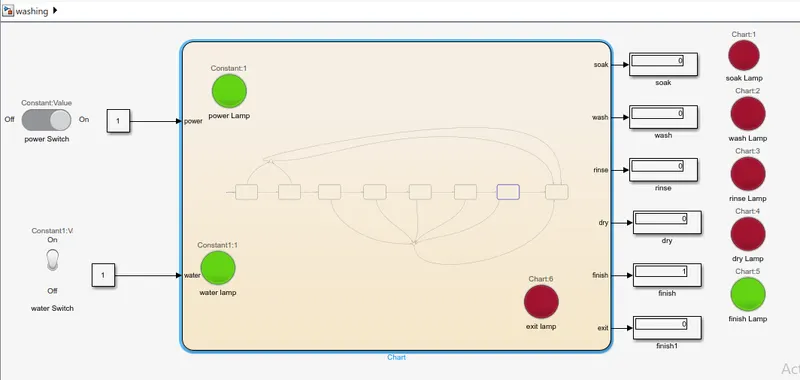
- Exit from the chart based on the input and output signals it will be clearly visible on the chart and need to connect the display blocks for output.
- Each display block is connected to the lamp and give the condition to glow the lamp based on the display either 1 or zero if 1 displayed need to glow the lamp as green colour and if it display in red colour need to glow the lamp in red colour.
SYMBLOS UED IN CHART:
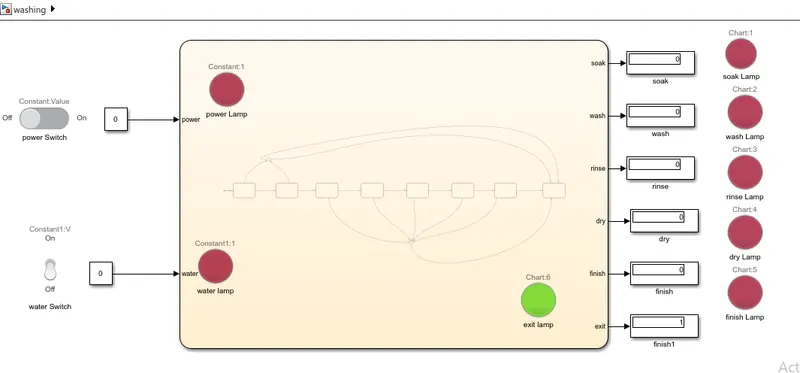
when power and water is off
when power and water on wile soaking
when power and water on wile washing
CONCLUSION:
The simulink model for washing machine process using stateflow is completed sucessfully.
PROJECT-2:
AIM:
To make a simulink chart for the gear shifting.
OBJECTIVE:
To make a Simulink chart for the “Gear shift” logic as per below conditions:
Speed Range(kmph) Gear
0 to 15 1
16 to 25 2
26 to 40 3
41 to 60 4
Above 61 5
Give speed input while the simulation is running & display the gear number.
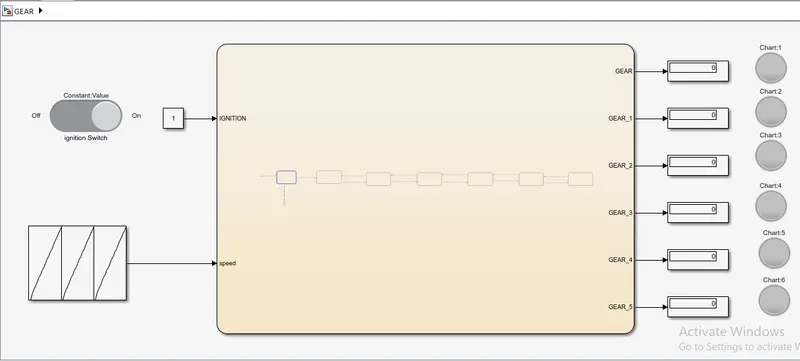
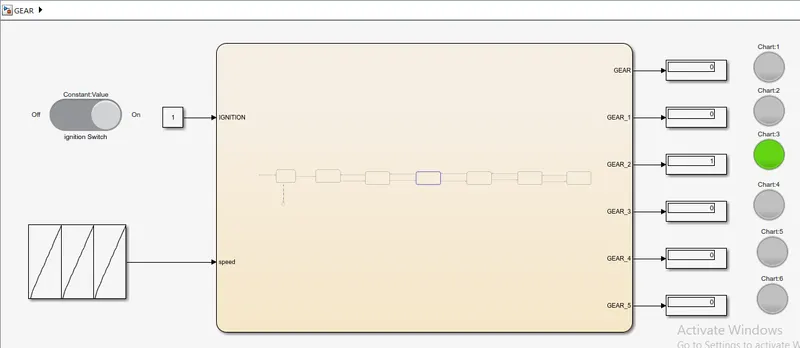
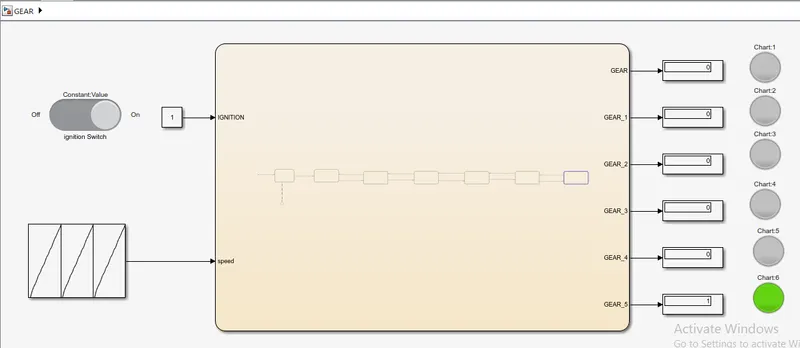
SIMULINK MODEL:
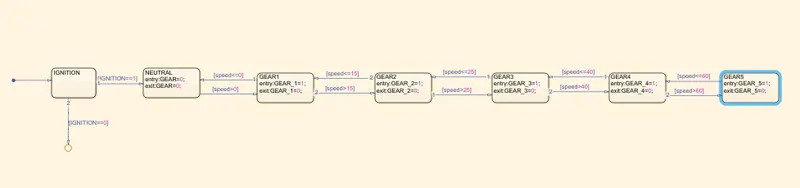
EXPLANATION:
- Firstly after opening the simulink select the chart in the library.
- Double click on the chart, it will take to the control logic dashboard.
- select the block set of speed and ignition represent respectively.
- Give the condition as ignition==1 such that it will move to the further blocks other wise terminate the blocks and exit.
- Next move to the gear1 after evaluating the two conditions.
- In gear1 block we have given a condition as entry:gear1=1 and exit:gear=0 until the satisfying the condition it will do the process of gear1.
- after all conditions completed next need to move to the gear2 as per the speed limit given in conditions.
- By changing the speed gear will be shifted from gear1 to gear5 automatically
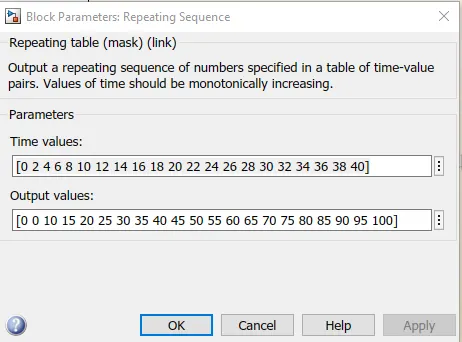
- Speed input is connected to the repeating sequience for giving speed signals.
- During running at any point of time if any condition failed need to exit the blocks.
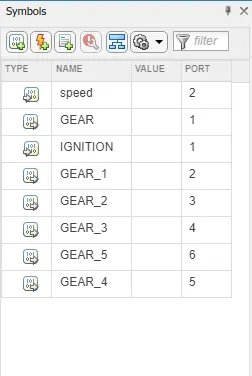
- Assign the symbols used in the block and give the entered data as input/output in the symbol box.
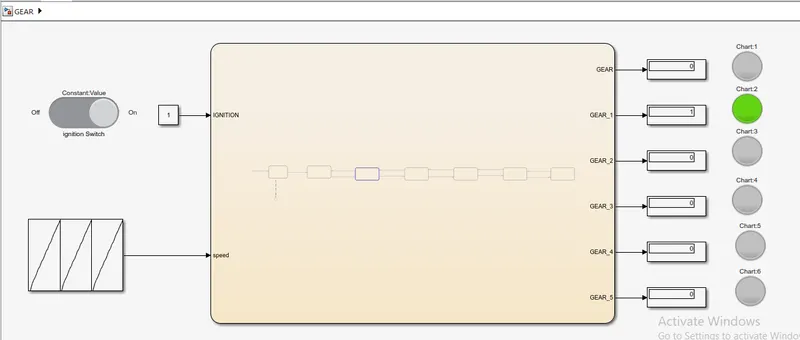
- Exit from the chart based on the input and output signals it will be clearly visible on the chart and need to connect the display blocks for output.
- Each display block is connected to the lamp and give the condition to glow the lamp based on the display either 1 or zero if 1 displayed need to glow the lamp as green colour and if it display in red colour need to glow the lamp in red colour.
CONCLUSION:
Simulation chart for the gear shifting is completed and sucessfully executed.