Project 1 - Parsing NASA thermodynamic data
AIM:
To write a code to evaluate NASA thermodynamic data and to calculate therodynamic properties like entropy,enthalpy,specific heat and molecular mass.
OBJECTIVES:
- To write a code to extract 14 coefficients from given data file and need to calculate thermodynamic properties from given data.
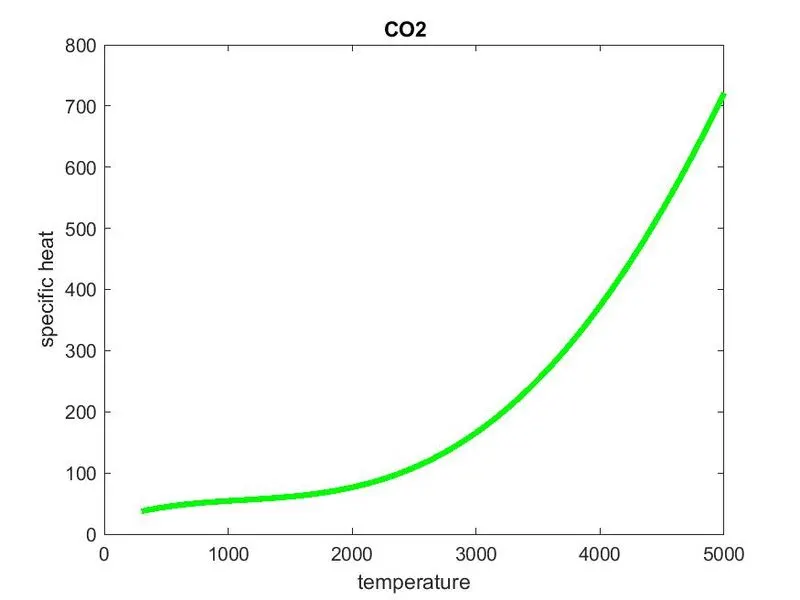
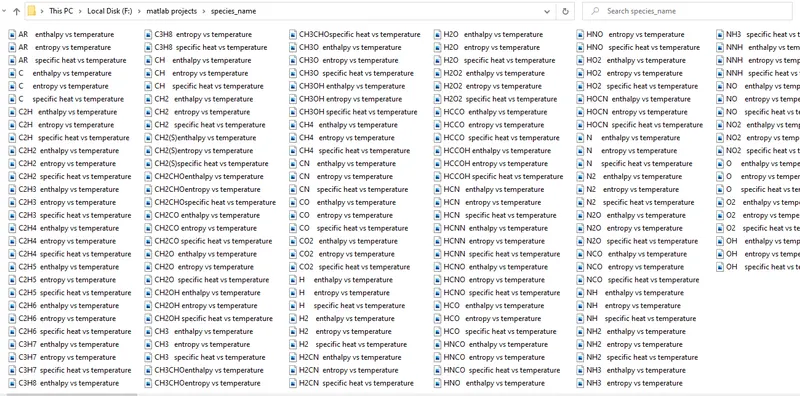
- To plot temperature vs thermodynamics properties for all species.After plotting need to save in a seperate file automattically.
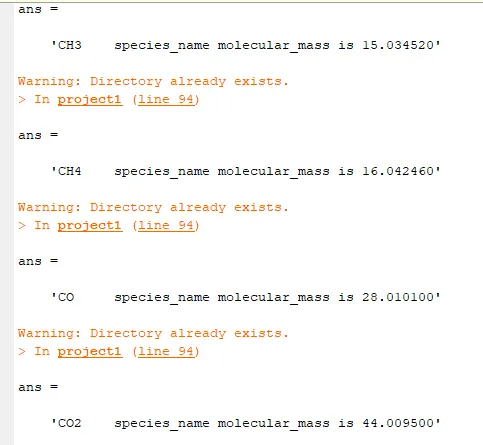
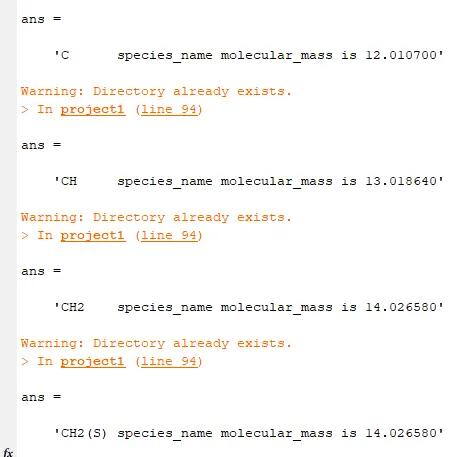
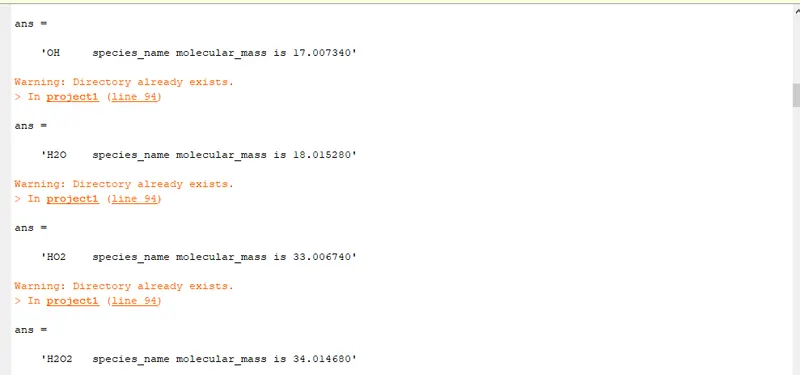
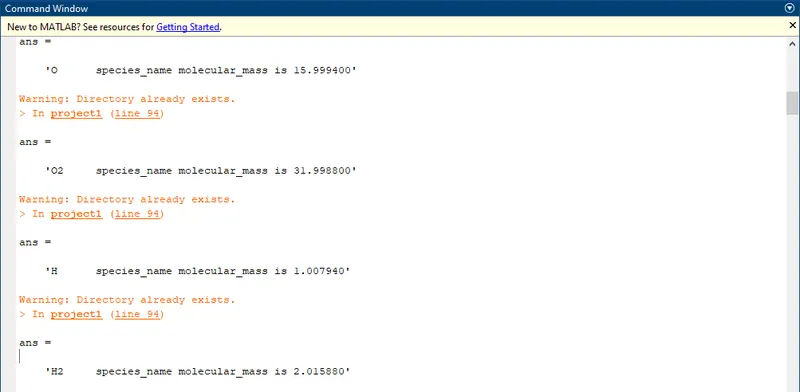
- Need to calculate molecular mass for each species.
INPUTS AND FORMULAS USED IN CODING:
Taken R=8.314
 CP=(c1+c2.*temperature+c3.*temperature.^2+c4.*temperature.^3+c5.*temperature.^4).*R;
 H=(c1+(c2.*temperature/2)+(c3.*temperature.^2)/3+(c4.*temperature.^3)/4+(c5.*temperature.^4)/5+(c6./temperature)).*R.*temperature;
 S=(c1*log(temperature)+c2.*temperature+(c3.*temperature.^2)/2+(c4.*temperature.^3)/3+(c5.*temperature.^4)/4+c7).*R;
Where,
cp=specific heat
H=Enthalphy
S=entropy
PROCEDURE:
- code Started with close all,clear all,clc commands to clear all data in workspace,command window and to clear all previous pots.
- To read the given file used 'fopen' command and read the thermodynamic data and stored in a variable 'F'.
- In fopen command we used a key word 'r' which means read mode.
- using fgetl,strsplit,str2num commands we have found global high low,medium temperatures.
- extracting and calculating 14 coefficients from the file, by using for loop.
- The first line is read by using fgetl command which is the title of the file.
- Nextline temperature is read and stored the values by splitting the values using split string command.
- Next three lines are ignored by using fgetl command.
- Next by using for loop program as itterated 53 times and calculated all the required values for calculation.
- In for loop we have sorted out all the coefficients and stored in a variables c1,c2,c3,c4,c5,c6,c7,c8,c9,c10,c11,c12,c13,c14.
- Using linspace command we have generated more values of temperature in betwwen given temperatures for making plotting.
- After finding all the species we have calculated entorp,enthaply,specific heat.
- First 7 coefficients are used for low and mid temperatures and next 7 coefficients are used for high temperatures.
- By using if else functions we have calculated entropy enthalpy,specific heat based on low and high temperatures
- if temperature(j)<3000
CP=(c1+c2.*temperature+c3.*temperature.^2+c4.*temperature.^3+c5.*temperature.^4).*R;
H=(c1+(c2.*temperature/2)+(c3.*temperature.^2)/3+(c4.*temperature.^3)/4+(c5.*temperature.^4)/5+(c6./temperature)).*R.*temperature;
S=(c1*log(temperature)+c2.*temperature+(c3.*temperature.^2)/2+(c4.*temperature.^3)/3+(c5.*temperature.^4)/4+c7).*R;
else
CP=(c8+c9.*temperature+c10.*temperature.^2+c11.*temperature.^3+c12.*temperature.^4).*R;
H=(c8+(c9.*temperature/2)+(c10.*temperature.^2)/3+(c11.*temperature.^3)/4+(c12.*temperature.^4)/5+(c13./temperature)).*R.*temperature;
S=(c8*log(temperature)+c9.*temperature+(c10.*temperature.^2)/2+(c11.*temperature.^3)/3+(c12.*temperature.^4)/4+c14).*R;
end - After calculating all the values, by using plot command all the characterstics like temperaturevs entropy, temperature vs enthalpy, temperature vs specific heat need to be plotted.
- using save as command all these plots are saved individually folder for each species and saved in one folder.
PROGRAM:
%parsing NASA thermodynamic data and evaluating thermodynamics properties
clear all
close all
clc
%reading the file and storing the data in variable F
F=fopen('THERMO.dat','r')
%reading heading of the file and storing on the variable LINE1
line1=fgetl(F);
%reading the low,mid and high temperatures
line2=fgetl(F)
%Reading the commnets lines in the file
line3=fgetl(F)
line4=fgetl(F)
line5=fgetl(F)
%spliting the temperatures in line 2
A= strsplit(line2,' ') %'strsplit' command is used to split the string
%converting the splitted string in to number and storing in variables
low_temperature=str2num(A{2})
mid_temperature=str2num(A{3})
high_temperature=str2num(A{4})
for i=1:53
species=fgetl(F);
species_name=species(1:6);
%extracting the species from 1st line
line_1=fgetl(F);
%finding the position of string in the line1
L1=findstr(line_1,'E');
%Extracting the constants and storing in the variables
c1=str2num(line_1(1:(L1(1)+3)));
c2=str2num(line_1((L1(1)+4):(L1(2)+3)));
c3=str2num(line_1((L1(2)+4):(L1(3)+3)));
c4=str2num(line_1((L1(3)+4):(L1(4)+3)));
c5=str2num(line_1((L1(4)+4):(L1(5)+3)));
%extracting the species from second line
line_2=fgetl(F);
%finding the position of string in the line2
L2=findstr(line_2,'E');
%Extracting the constants and storing in the variables
c6=str2num(line_2(1:(L2(1)+3)));
c7=str2num(line_2((L2(1)+4):(L2(2)+3)));
c8=str2num(line_2((L2(2)+4):(L2(3)+3)));
c9=str2num(line_2((L2(3)+4):(L2(4)+3)));
c10=str2num(line_2((L2(4)+4):(L2(5)+3)));
%extracting the species from 3rd line
line_3=fgetl(F);
%finding the position of string in the line2
L3=findstr(line_3,'E');
%Extracting the constants and storing in the variables
c11=str2num(line_3(1:(L3(1)+3)));
c12=str2num(line_3((L3(1)+4):(L3(2)+3)));
c13=str2num(line_3((L3(2)+4):(L3(3)+3)));
c14=str2num(line_3((L3(3)+4):(L3(4)+3)));


%temperatures assumed for with in given ranges using linspace command
temperature=linspace(300.0,5000.0,200);
%take universal gas constant
R=8.314;
%Calculating enthalpy,entropy,specific heat
for j=1:length(temperature)
    if temperature(j)<3000
        CP=(c1+c2.*temperature+c3.*temperature.^2+c4.*temperature.^3+c5.*temperature.^4).*R;
        H=(c1+(c2.*temperature/2)+(c3.*temperature.^2)/3+(c4.*temperature.^3)/4+(c5.*temperature.^4)/5+(c6./temperature)).*R.*temperature;
        S=(c1*log(temperature)+c2.*temperature+(c3.*temperature.^2)/2+(c4.*temperature.^3)/3+(c5.*temperature.^4)/4+c7).*R;
    else
        CP=(c8+c9.*temperature+c10.*temperature.^2+c11.*temperature.^3+c12.*temperature.^4).*R;
        H=(c8+(c9.*temperature/2)+(c10.*temperature.^2)/3+(c11.*temperature.^3)/4+(c12.*temperature.^4)/5+(c13./temperature)).*R.*temperature;
        S=(c8*log(temperature)+c9.*temperature+(c10.*temperature.^2)/2+(c11.*temperature.^3)/3+(c12.*temperature.^4)/4+c14).*R;
    end
end
%plotting
%plotting temperature and enthalpy
figure(1);
plot(temperature,H,'linewidth',3,'color','b');
title(species_name);
xlabel('temperature');
ylabel('enthalopy');

%plotting temperature and entropy
figure(2);
plot(temperature,S,'linewidth',3,'color','r');
title(species_name);
xlabel('temperature');
ylabel('entropy');

%plotting temperature and specific heat
figure(3);
plot(temperature,CP,'linewidth',3,'color','g');
title(species_name);
xlabel('temperature');
ylabel('specific heat');

folder_name=('species_name');
mkdir([folder_name]);

%saving the plots
figure_name1=sprintf([species_name,'enthalpy vs temperature.jpg']);
figure_name2=sprintf([species_name,'entropy vs temperature.jpg']);
figure_name3=sprintf([species_name,'specific heat vs temperature.jpg']);

folder_path1=fullfile(folder_name,figure_name1);
folder_path2=fullfile(folder_name,figure_name2);
folder_path3=fullfile(folder_name,figure_name3);

saveas(figure(1),folder_path1);
saveas(figure(2),folder_path2);
saveas(figure(3),folder_path3);

folder_name=('species_name');
mkdir([folder_name])
cd()

MM = molecular_mass(species_name);
sprintf('%s species_name %s is %f',species_name,'molecular_mass',MM)
end
fclose(F)
FUNCTION FOR CALCULATING MOLECULAR WEIGHT:
function MM=molecular_mass(species_name)
species=upper(species_name);
constituents=['H','C','N','O','Ar'];
atomic_weight=[1.00794 12.0107 14.0067 15.9994 39.948];

MM=0;
for i=1:length(species)
    for j=1:length(constituents)
        if strcmp(species(i),constituents(j))
            MM=MM+atomic_weight(j);
            p=j;
        end
    end
    n=str2num(species(i));
    if n>1
        MM=MM+(atomic_weight(p)*(n-1));
    end
    %sprintf('%s species_name %s is %f',species_name,'molecular_mass',MM)
end
PLOTS FOR N2:
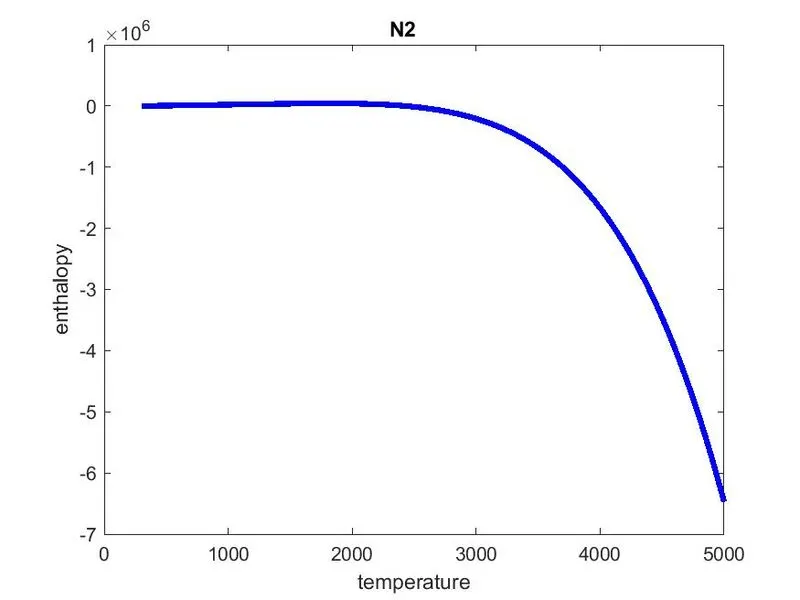
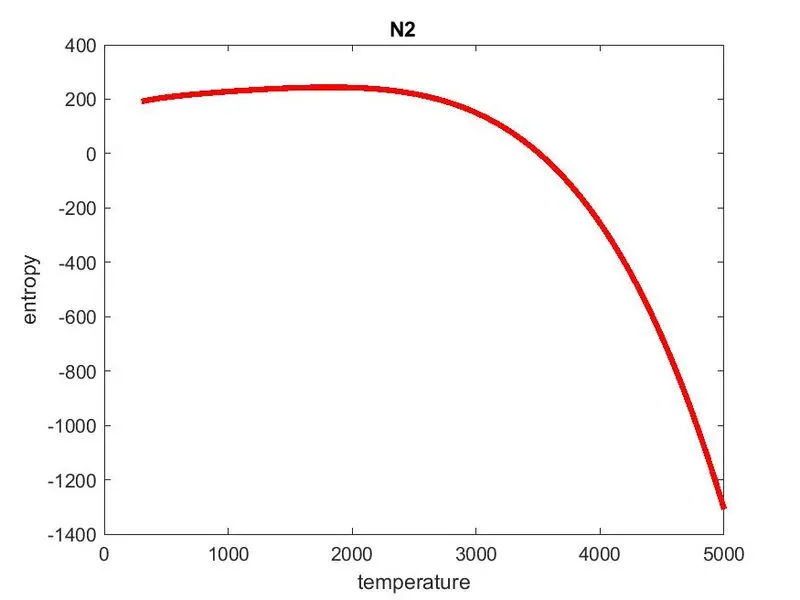
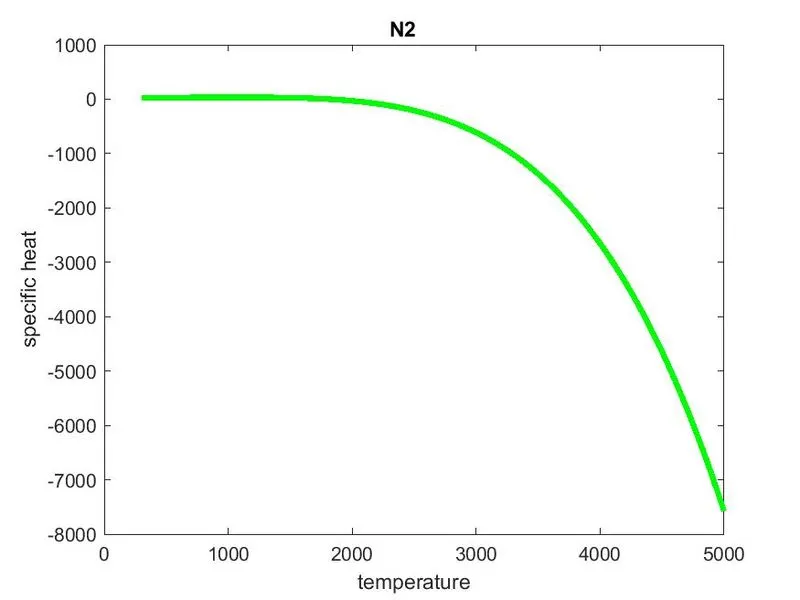
PLOTS FOR O2:
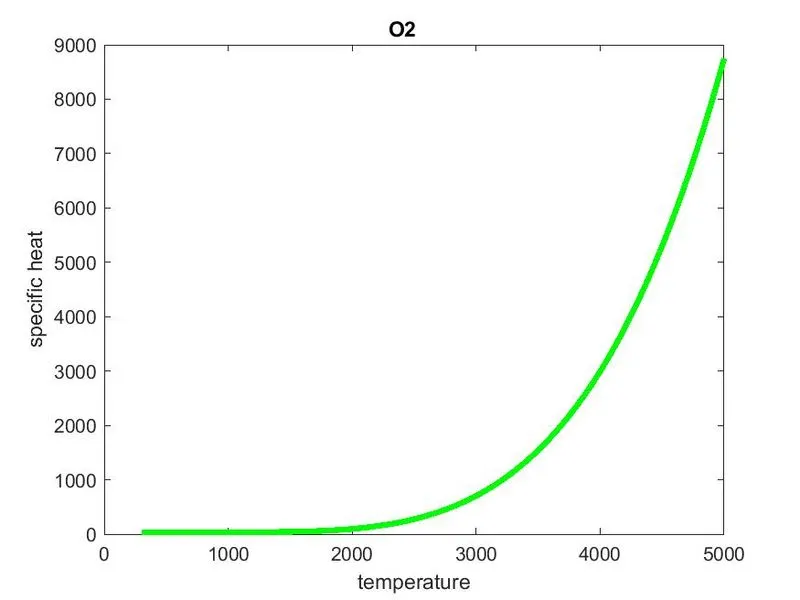
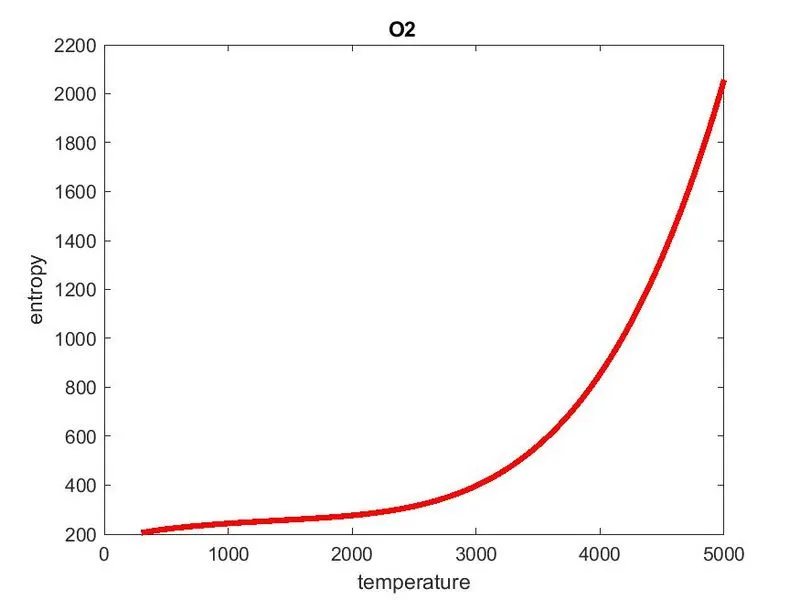
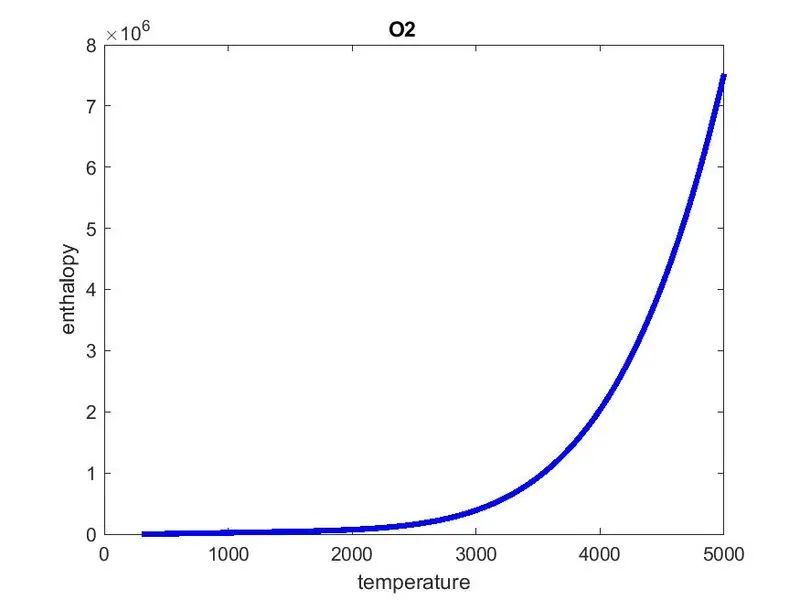
PLOTS FOR CO2:
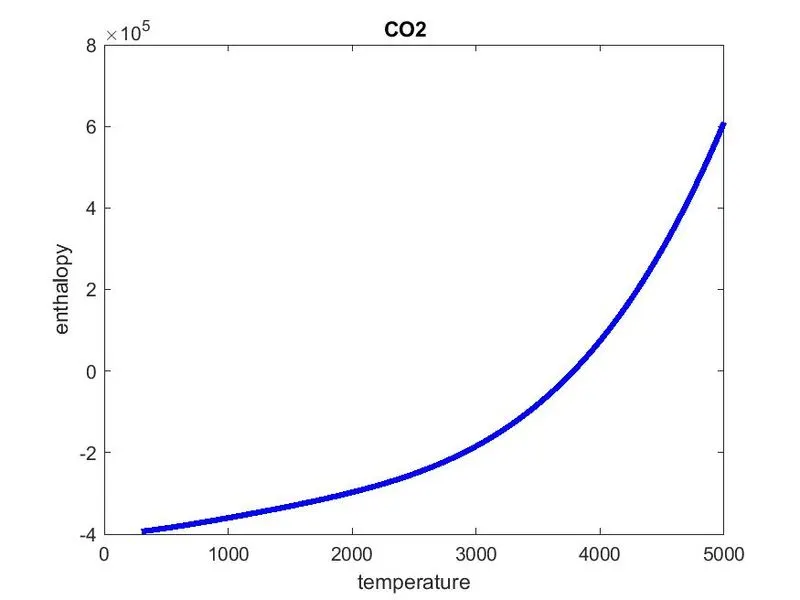
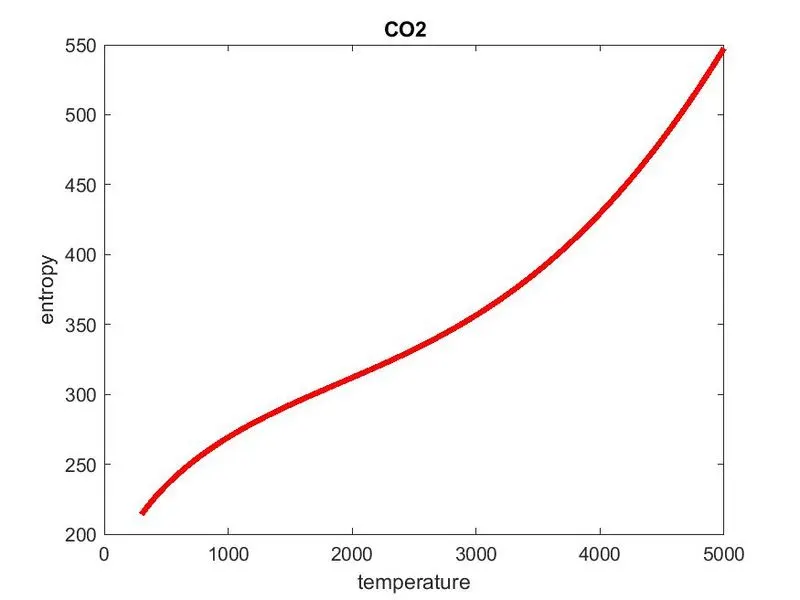
MOLECULAR WEIGHT OF SPECIES:
OUTPUT:
RESULT:
We have written code in matlab for parsing of thermodynamic data and calculated and plotted thermodynamic properties.