Week - 4
1.
Aim:
Implement control logic of a “washing machine” using Stateflow as per given sequence.
Objective:
Implement the below conditions by using stateflow chart,
- If the power supply is available, the system gets activated
- If the Water supply is not available, stop the process & indicate through LED
- Soaking time should be 200s followed by Washing time of 100s.
- Then rinsing happens for next 20s & dryer runs for 50s
What is stateflow?
Stateflow provides a graphical language that includes state transition diagrams, flow charts, state transition tables, and truth tables. You can use Stateflow to describe how MATLAB algorithms and Simulink models react to input signals, events, and time-based conditions.
Stateflow enables you to design and develop supervisory control, task scheduling, fault management, communication protocols, user interfaces, and hybrid systems.
With Stateflow, you model combinatorial and sequential decision logic that can be simulated as a block within a Simulink model or executed as an object in MATLAB. Graphical animation enables you to analyze and debug your logic while it is executing. Edit-time and run-time checks ensure design consistency and completeness before implementation.
Simulink model:
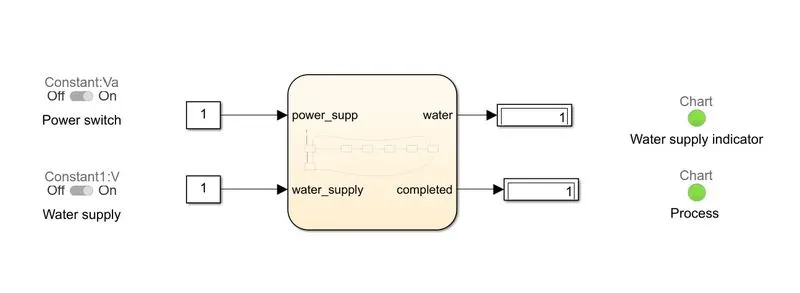
- The above model reperesent the washing machine control panel which consiste of two inputs and two outputs.
- The inputs were water supply & power and the outputs were water supply indicator & process indicator.
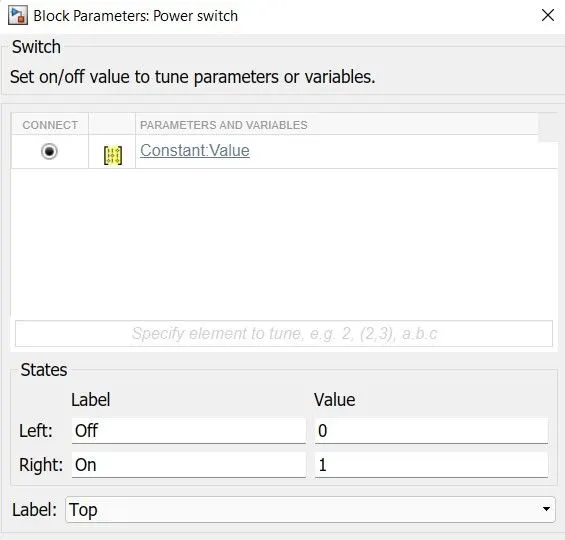
- The slider switch is used to get the input from the user and the values were sent to the constant block because the stateflow can only read 1D values.
- Then the outputs were projected by using disply block.
- The disply block is sync with lamp to get a symbolic output.
Stateflow chart
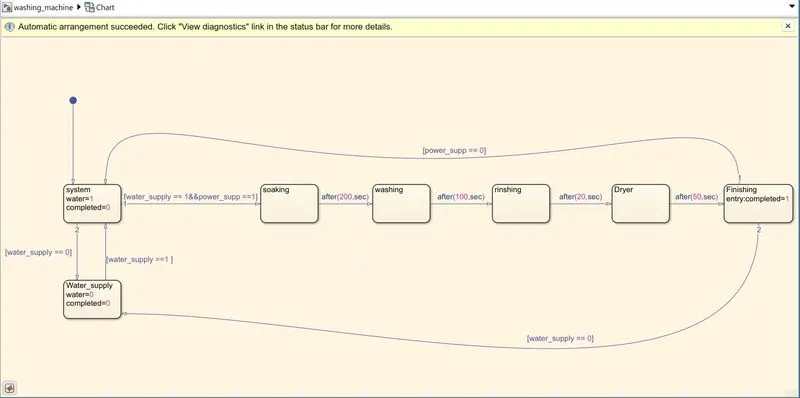
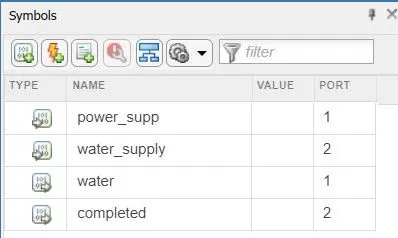
The above stateflow chart was prepared by the logics given and it has two input and two outputs. Those are power & water supply and water supply indicator & process indicator.
2.
Aim: Make a Simulink chart for the “Gear shift” logic
Objective:
To make a Simulink chart for the “Gear shift” logic as per below conditions:
Speed Range(kmph) Gear
0 to 15 1
16 to 25 2
26 to 40 3
41 to 60 4
Above 61 5
To give speed input while the simulation is running & display the gear number.
Simulink moodel:
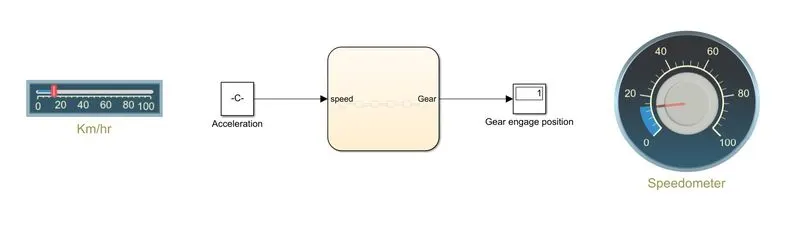
- The above simulik model represent the simulation for the gear shift logic.
- The slider switch used to get a vaiable input from the user while the simulation running.
- The speed input feed to the stateflow chart through constant block.
- Then the stateflow chart arranged as per the logics given then the gear position was got as a output to the display block.
Stateflow chart:
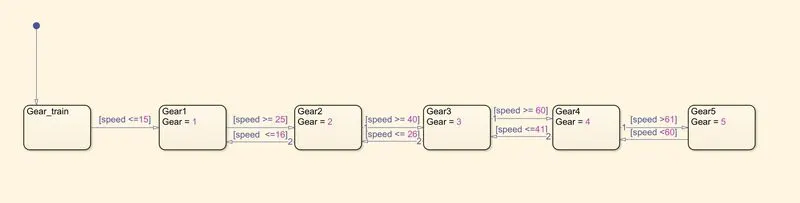
The above logic won't work if the initial input is more than 15km/hr. Because we have to increase the speed gradually from 0.
Reference: