Project 1 - Parsing NASA thermodynamic data
Aim : To write a code to extract the data's from the NASA theromodynamic data file and calculate the parameters defined by the NASA.
Objective :
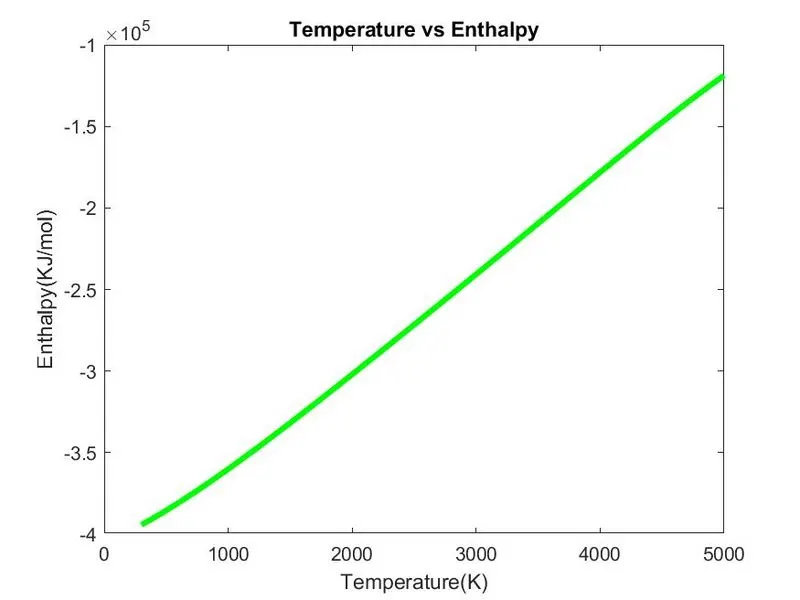
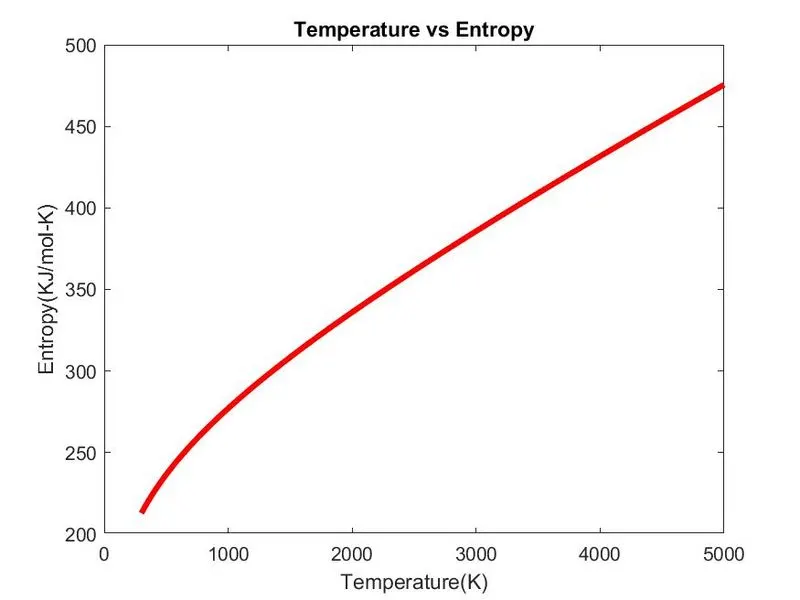
1. To Write a function that extracts the 14 co-efficients and calculates the enthalpy, entropy and specific heats for all the species in the data file by using the below formula.
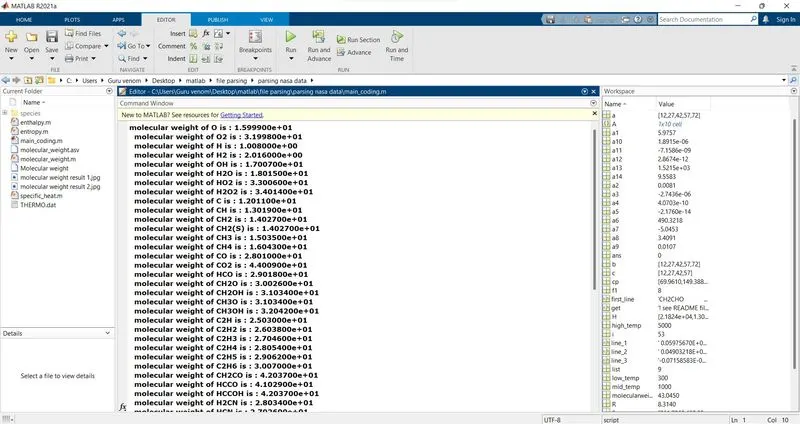
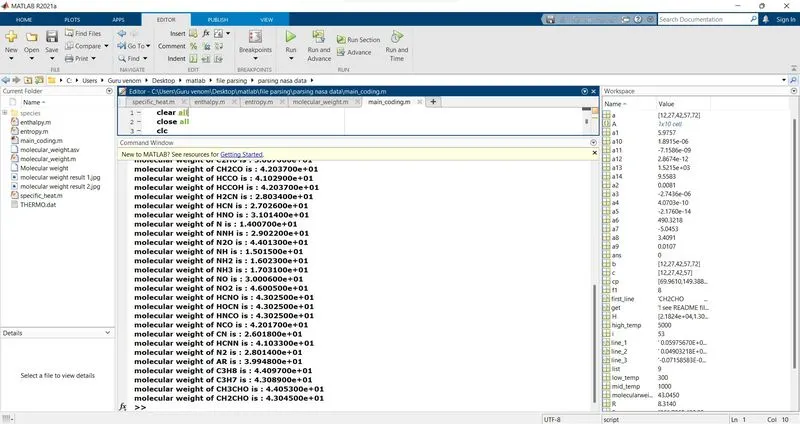
2. To Calculate the molecular weight of each species and display it in the command window.
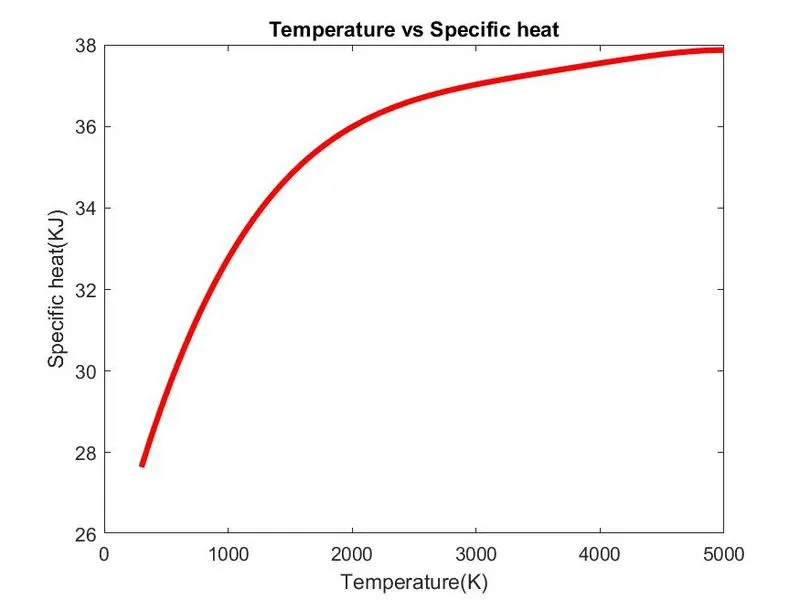
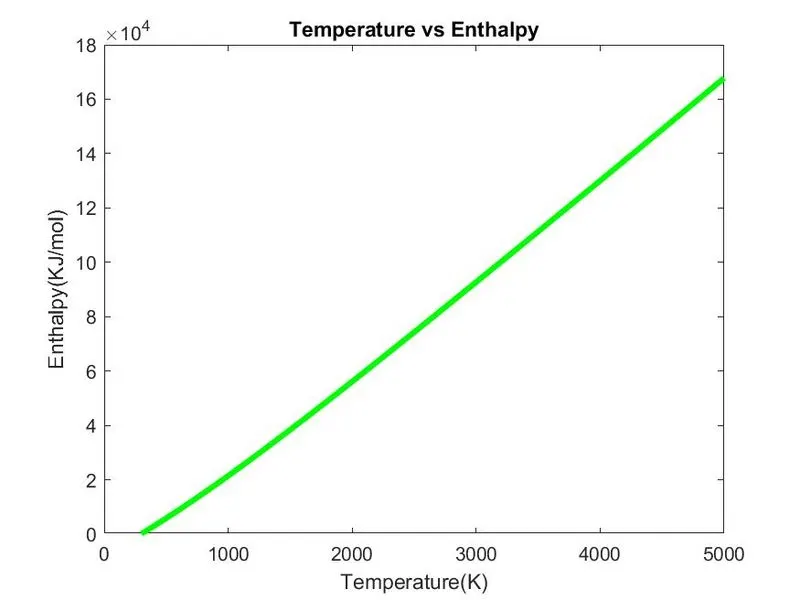
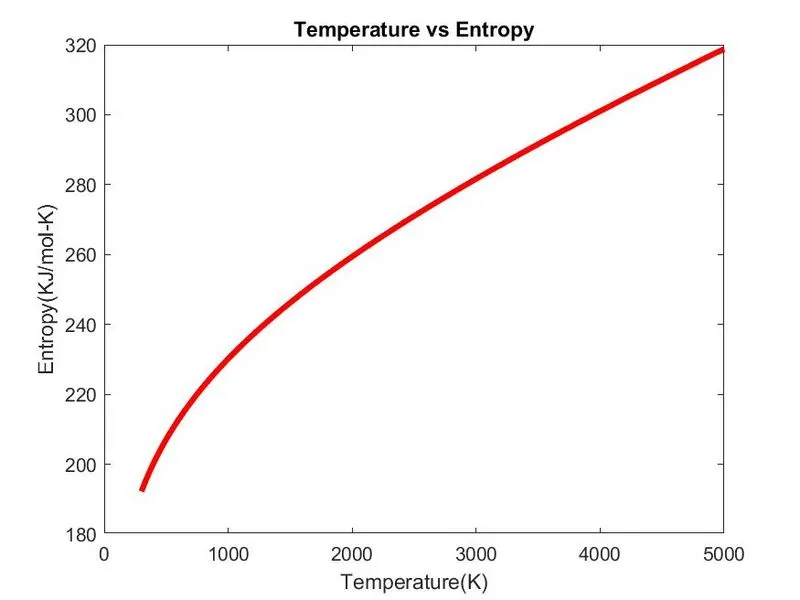
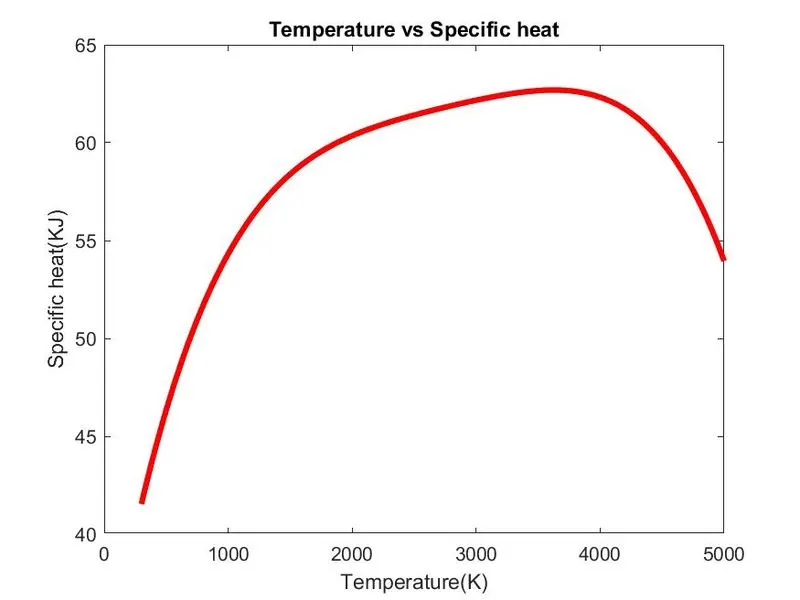
3.To Plot the Cp, Enthalpy and Entropy for the local temperature range specific for each species.
4. Save the plots as images with appropriate names and dump them in separate folders for each species with suitable name.
Main code:
clear all
close all
clc

%gas constant
R = 8.314;

%opening file
f1=fopen('THERMO.dat','r');
get=fgetl(f1);

%getting temerature info
temp_range = fgetl(f1);

%splitting
t= strsplit(temp_range);

%categorizing temp.
lowtemp = str2num(t{2});
midtemp = str2num(t{3});
hightemp = str2num(t{4});

T = linspace(lowtemp,hightemp,500);

%line skiping
for i=1:3
    get = fgetl(f1);
end

%reading data
for  i=1:53
    first_line = fgetl(f1);

    %TO find the species name
    A = strsplit(first_line,'  ');
    species =  (A{1});

    %defining temperature range
    low_temp = str2num(A{end-3});
    high_temp = str2num(A{end-2});
    mid_temp = str2num(A{end-1});

    line_1 = fgetl(f1);
    a = strfind(line_1,'E');

    %extracing the input parameters
    a1 = line_1(1:a(1)+3);
    a1 = str2num(a1);
    a2 = line_1(a(1)+4:a(2)+3);
    a2 = str2num(a2);
    a3 = line_1(a(2)+4:a(3)+3);
    a3 = str2num(a3);
    a4 = line_1(a(3)+4:a(4)+3);
    a4 = str2num(a4);
    a5 = line_1(a(4)+4:a(5)+3);
    a5 = str2num(a5);

    line_2 = fgetl(f1);
    b = strfind(line_2,'E');

    a6 = line_2(1:b(1)+3);
    a6 = str2num(a6);
    a7 = line_2(b(1)+4:b(2)+3);
    a7 = str2num(a7);
    a8 = line_2(b(2)+4:b(3)+3);
    a8 = str2num(a8);
    a9 = line_2(b(3)+4:b(4)+3);
    a9 = str2num(a9);
    a10 = line_2(b(4)+4:b(5)+3);
    a10 = str2num(a10);

    line_3 = fgetl(f1);
    c = strfind(line_3,'E');

    a11 = line_3(1:c(1)+3);
    a11 = str2num(a11);
    a12 = line_3(c(1)+4:c(2)+3);
    a12 = str2num(a12);
    a13 = line_3(c(2)+4:c(3)+3);
    a13 = str2num(a13);
    a14 = line_3(c(3)+4:c(4)+3);
    a14 = str2num(a14);

    %Calculation of specific heat cp
    cp = specific_heat(a1,a2,a3,a4,a5,a8,a9,a10,a11,a12,T,R,mid_temp);

    %Calculation of Enthalpy;
    H = enthalpy(a1,a2,a3,a4,a5,a6,a8,a9,a10,a11,a12,a13,T,R,mid_temp);

    %calculation of Entropy
    S = entropy(a1,a2,a3,a4,a5,a7,a8,a9,a10,a11,a12,a14,T,R,mid_temp);

   %Calculation of molecular weight
   molecularweight = molecular_weight(species);

   %crating file which store the molecular weight info
   list = fopen('Molecular weight');
   fprintf(list,'Molecular weight of %s',species);
   fprintf(list,'is %d \n',molecularweight);
   fclose(list);


   %creating seperate folder for each species
   cd('C:\Users\Guru venom\Desktop\matlab\file parsing\parsing nasa data\species')
   mkdir(species);
   cd(species);

   %plot for CP and T
   figure(1);
   plot(T,cp,'linewidth',3,'color','r');
   xlabel('Temperature(K)');
   ylabel('Specific heat(KJ)');
   title('Temperature vs Specific heat')
   saveas(figure(1),'plot for Specific heat.jpg')

   %plot for H and T
   figure(2);
   plot(T,H,'linewidth',3,'color','g');
   xlabel('Temperature(K)');
   ylabel('Enthalpy(KJ/mol)');
   title('Temperature vs Enthalpy')
   saveas(figure(2),'plot for Enthalpy.jpg')

   %plot for S and T
   figure(3);
   plot(T,S,'linewidth',3,'color','r');
   xlabel('Temperature(K)');
   ylabel('Entropy(KJ/mol-K)');
   title('Temperature vs Entropy')
   saveas(figure(3),'plot for Entropy.jpg')

   cd('C:\Users\Guru venom\Desktop\matlab\file parsing\parsing nasa data\species');

end
Steps:
- First of all the gas constant was defined then the NASA's thermo dat file was read using 'fopen' command.
- Then the first line was skipped using 'fgetl' command then the general themerature range was defined from the file splited by using the 'strsplit' command .
- The string need to converted into number by using 'str2num' command by this method low to high temperature was defined and then the temperature 'T' was definded using 'linspace' command.
- To skip next three lines 'for' loop command was used and again using the same command the remaing datas were get for 53 species.
- Then in the next line the temperature for each species were defined as low, mid and high temperature.
- After that by using 'strfind' command the location of string 'E' was found. By using the location of 'E' the 14 values of every species were defind.
- By using the 14 values of the each species the Specific heat, Enthalpy,Entropy and Molecular weight was calculated by using function programe.
- Then by using 'fopen' command the file was created as 'Molecular weight' and the values for molecular weight was printed out.
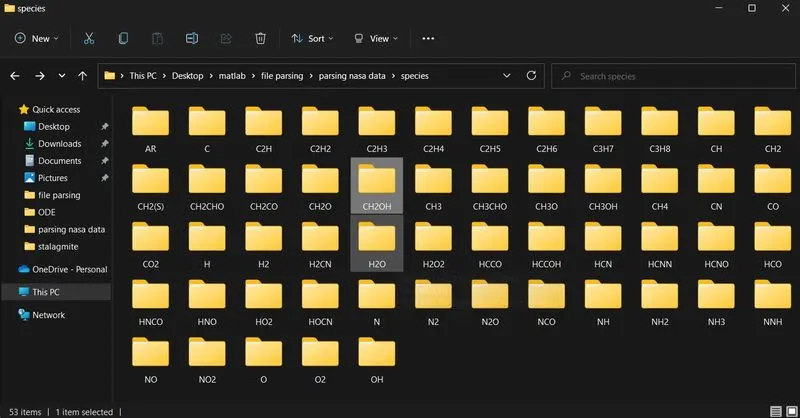
- By using 'cd' and 'mkdir' commands the directry was changed to the folder named as 'species'. In that for each species the separated folder was created.
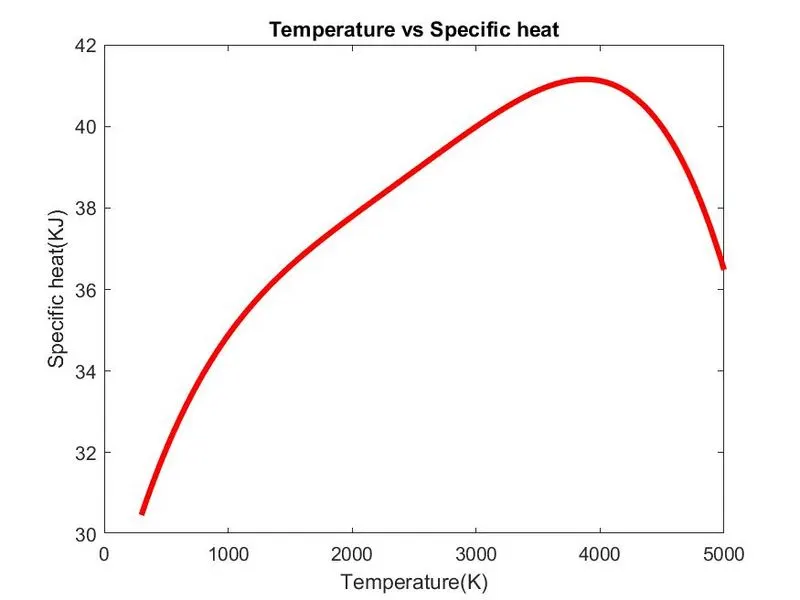
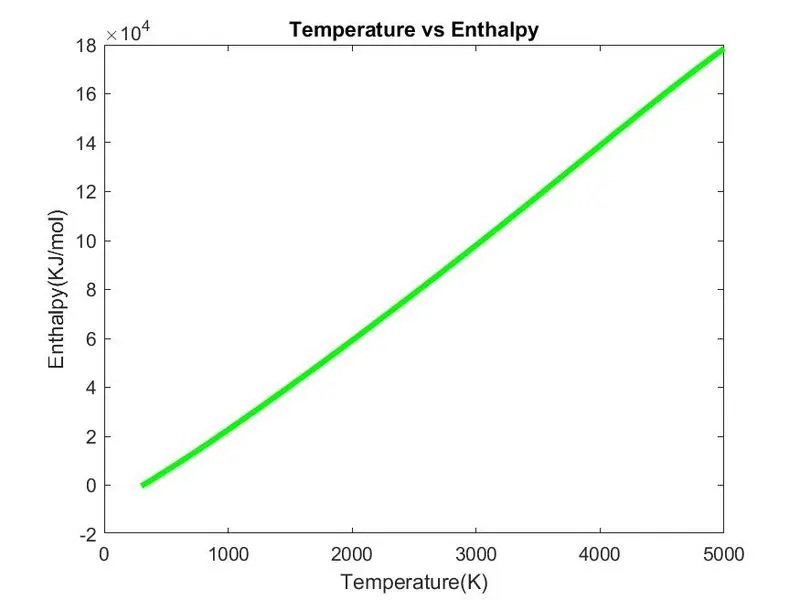
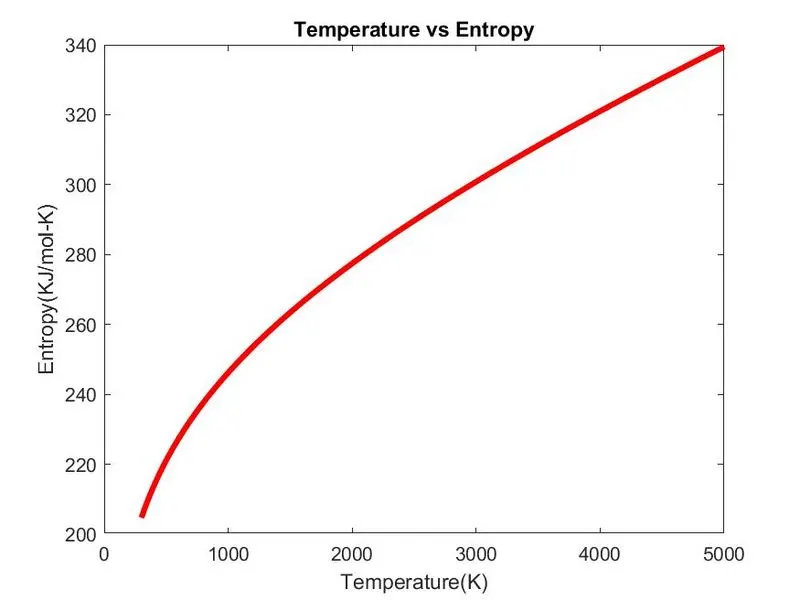
- In that seperated folder the plots were made between Cp, Enthalpy, Entropy and the local temperature range (low temperature : high temperature) specific for each species. And plots were saved by using 'saveas' command in jpg format.
Code for Specific heat(Cp):
function cp = specific_heat(a1,a2,a3,a4,a5,a8,a9,a10,a11,a12,T,R,mid_temp)

 if (T <= mid_temp)

    cp = R*(a8+(a9*T)+(a10*(T).^2)+(a11*(T).^3)+(a12*(T).^4));
else

    cp = R*(a1+(a2*T)+(a3*(T).^2)+(a4*(T).^3)+(a5*(T).^4));
end

end
Code for enthalpy(H):
function H = enthalpy(a1,a2,a3,a4,a5,a6,a8,a9,a10,a11,a12,a13,T,R,mid_temp)

if (T<=mid_temp)

    H = R*T.*(a8+((a9*T)/2)+((a10*(T).^2)/3)+((a11*(T).^3)/4)+((a12*(T).^4)/5)+(a13./T));
else

    H = R*T.*(a1+((a2*T)/2)+((a3*(T).^2)/3)+((a4*(T).^3)/4)+((a5*(T).^4)/5)+(a6./T));
end

end
code for entropy(S):
function S = entropy(a1,a2,a3,a4,a5,a7,a8,a9,a10,a11,a12,a14,T,R,mid_temp)

if (T<=mid_temp)

    S = R*(a8.*log(T)+(a9*T)+((a10*T).^2)/2+((a11*T).^3)/3+((a12*T).^4)/4+a14);
else

    S = R*(a1.*log(T)+(a2*T)+((a3*T).^2)/2+((a4*T).^3)/3+((a5*T).^4)/4+a7);
end

end
Steps:
- By using function the seperate programs were created for Specific heat,Enthalpy and Entropy
- In this function first we have to sperate low temperature and high temerature by using 'if' or 'else' command 0(the first 7 were high temerature and the last 7 were low temperatures.
- By using the provided formula we can define the both of three terms.
Code for molecular weight:
function molecularweight = molecular_weight(species)
        atomic_name = ['H','C','O','N','A'];  %hydrogen,carbon,oxygen,nitrogen,argon

        %atomic mass
        atomic_weight = [1.008 12.011 15.999 14.007 39.948];
        %molecular starting value
        molecularweight = 0;

        for i = 1:length(species)
            for j = 1:length(atomic_name)
                if strcmp(species(i),atomic_name(j))
                    molecularweight = molecularweight + atomic_weight(j);
                   J = j;
                end

            end

               n = str2num(species(i));
            if n>1
                molecularweight =  molecularweight + atomic_weight(J)*(n-1);
            end
        end

        fprintf('molecular weight of %s is : ',species);
        fprintf('%d',molecularweight);
        fprintf('\n')
        fprintf('  ')
end
Steps:
- In this function we have to define molecular weight for each species by adding the atom weights presented in the each species.
- For that first the atomic weights need to define for each atoms(H,C,O,N,A).
- After that by using if loop command the molecular weight was calculated by adding the value of atoms preesented.
- For that we need to find how many atoms were presented in each species by using two if loop command.
- Then we will create an condition using if condition and use strcmp command to compare the species and atomic_name strings to calculate molecular masses by comparing both string found same then we will assign its molecular weight.
- Then using fprintf command the values were printed.
Results:
Screenshot of the window where all the folders are saved
Plots for o2
1.T vs Cp
2.T vs Enthalpy
3. T vs Entropy
Plots for N2
1. T vs Cp
2. T vs H
3. T vs S
Plots for CO2
1. T vs Cp
2. T vs H
3. T vs S
Molecular weight for each species
Reference:
1.https://www.mathworks.com/matlabcentral/answers/497882-parsing-text-files-for-beginners
2.https://www.mathworks.com/matlabcentral/answers/?search_origin=ans_browse&term=strcmp
3.https://stackoverflow.com/questions/15750351/parse-text-file-in-matlab