Week - 4
AIM:
- To create a Simulink Stateflow for the various running circumstances of a “washing machine” utilising control logic.
- To create a Simulink chart for the “Gear shift” logic.
OBJECTIVE:
- Implement control logic of a “washing machine” using Stateflow as per the given sequence:
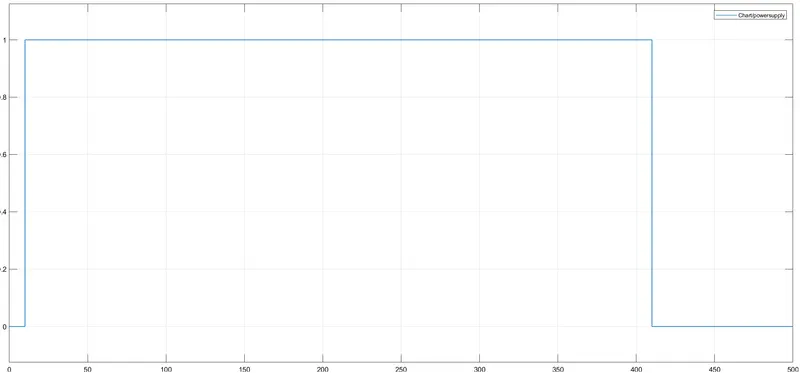
- If the power supply is available, the system gets activated.
- If the water supply is not available, stop the process & indicate through LED
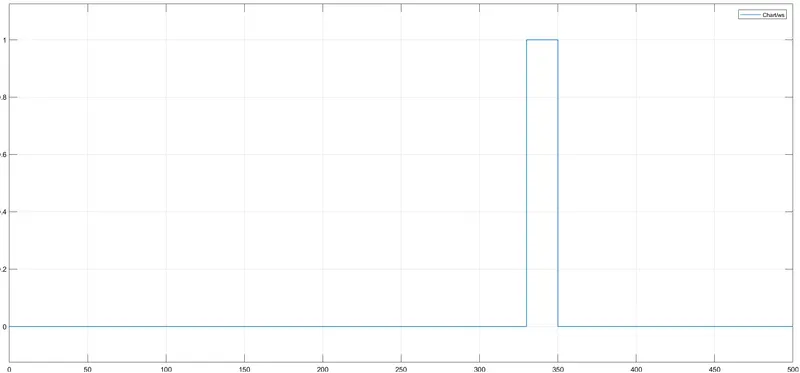
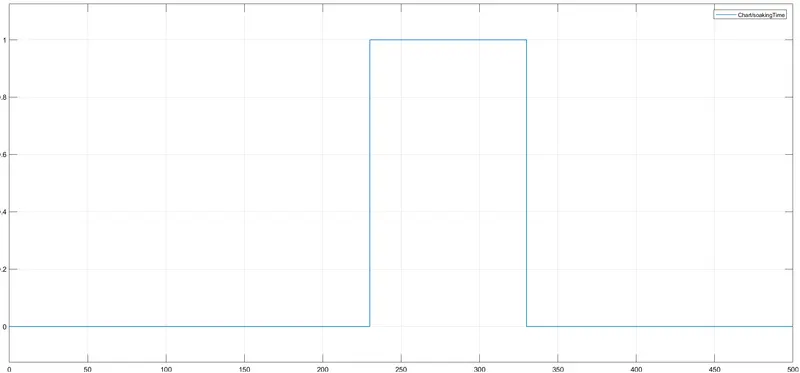
- Soaking time should be 200s followed by washing time of 100s
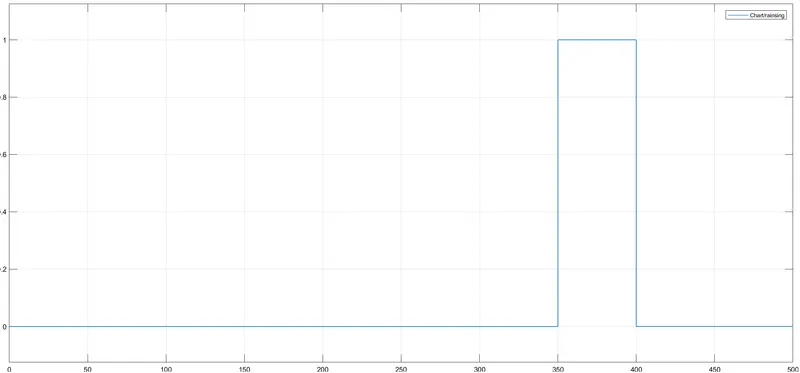
- Then rinsing happens for the next 20s & dryer runs for 50s
After all the processes have been completed turn on the finished LED
- Make a Simulink chart for the “Gear shift” logic as per the below conditions:
Speed Range (kmph)
Gear
0 to 15
1
16 to 25
2
26 to 40
3
41 to 60
4
Above 61
5
Give speed input while the simulation is running & display the gear number.
OBJECTIVE1:
THEORY:
STATEFLOW:
Stateflow is a tool that allows you to convert the logic into a systematic system. A Stateflow is a Simulink component, much as Simulink is a part of MATLAB.
Stateflow features state transition diagrams, flow charts, state transition tables, and truth tables as part of its graphical language. Stateflow is a language for describing how MATLAB algorithms and Simulink models respond to signals, events and time-based circumstances.
Supervisory control, job scheduling, fault management, communication protocols, user interfaces, and hybrid systems may all be designed and developed with Stateflow.
Stateflow allows you to simulate combinational and sequential decision logic as a block in a Simulink model or as a MATLAB object. While your logic is running, you may use graphical animation to evaluate and debug it. Before implementing a design, edit-time and run-time tests guarantee that it is consistent and comprehensive.
INPUT CONDITIONS:
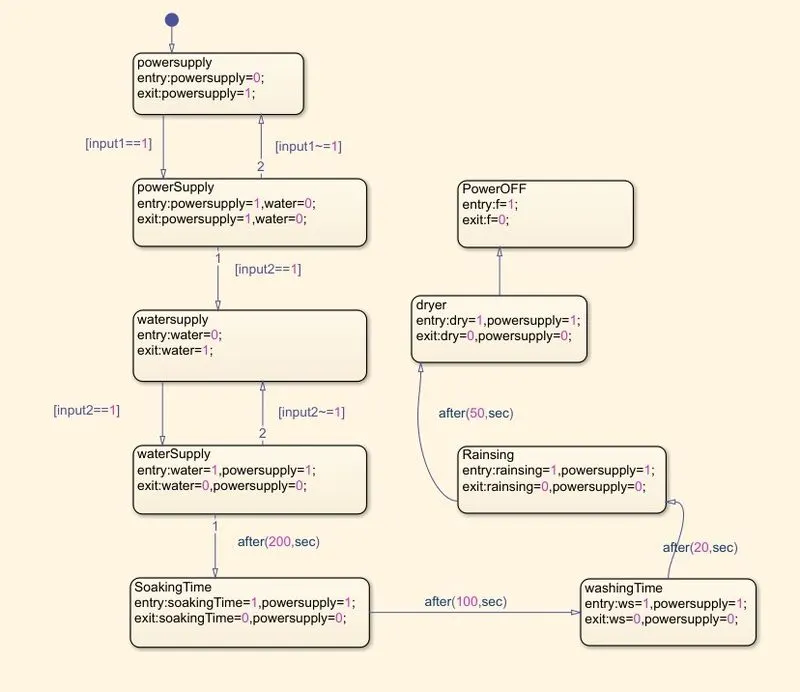
- If the power supply is available, the system gets activated.
- If the water supply is not available, stop the process & indicate through LED
- Soaking time should be 200s followed by washing time of 100s
- Then rinsing happens for the next 20s & dryer runs for 50s
SIMULINK-MODEL OF STATEFLOW OF WASHING MACHINE:
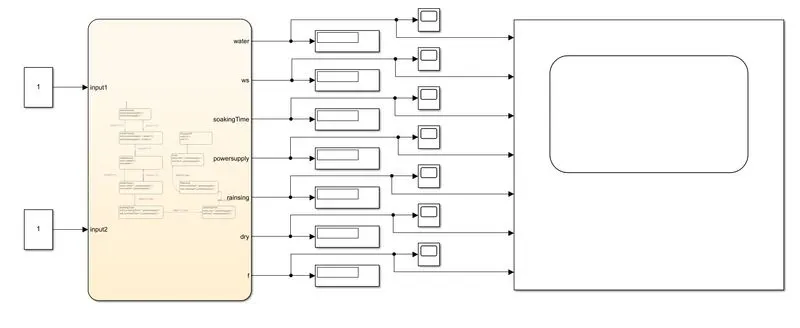
Chart:
STEPS:
- Chart Block: In this block, the conditions are given as per the requirements by using blocks in the left sidebar, and connections are made to each and every block in the subsystem flow chart.
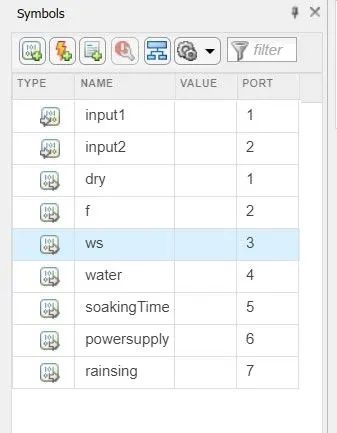
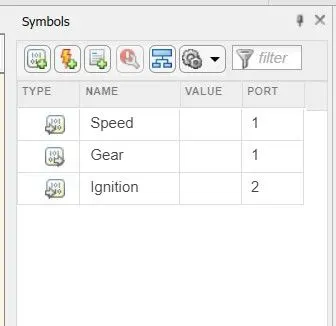
- Symbols Pane: In the menu select symbols pane, in the inputs and output data’s have to be assigned.
- The two inputs are given to the model and output is water, dry, washing, f, rinsing, soaking, power supply.
- The display blocks and scope are connected to each and every block to get the graphical plots and values.
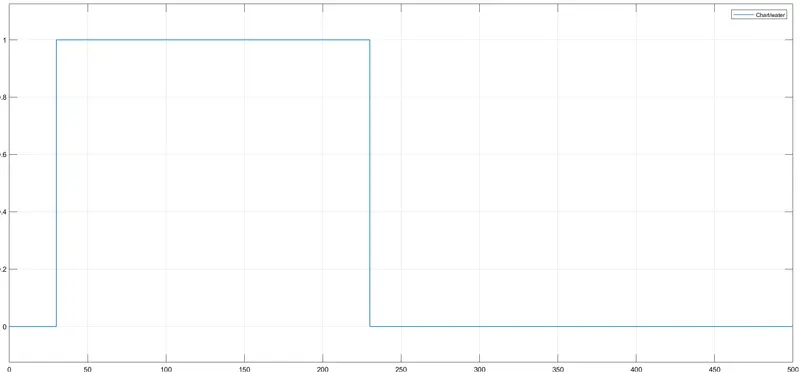
- The run time is set to 500sec to get the output data values.
OUTPUT:
SIMULATION GRAPHS:
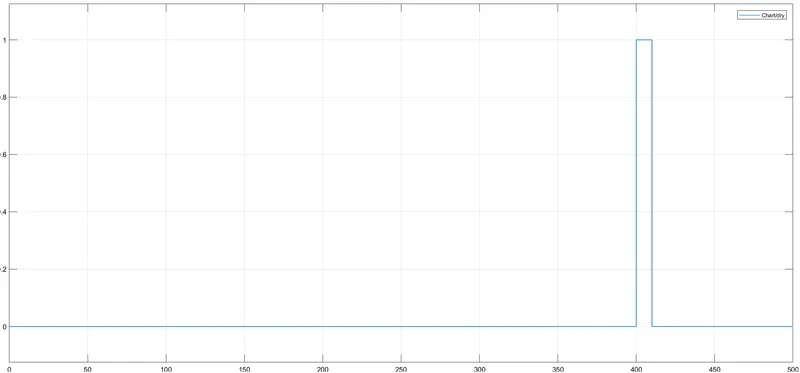
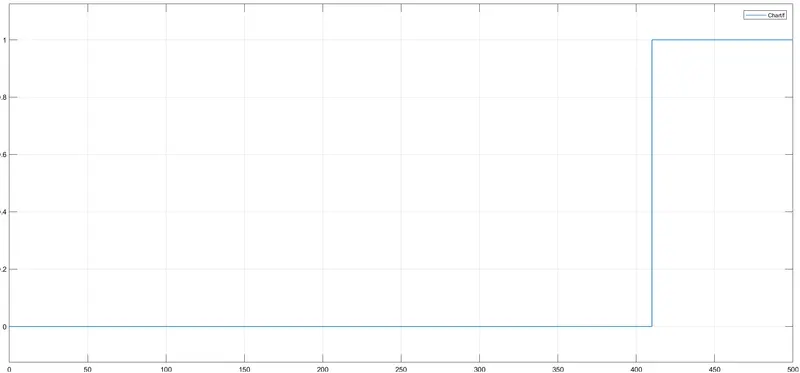
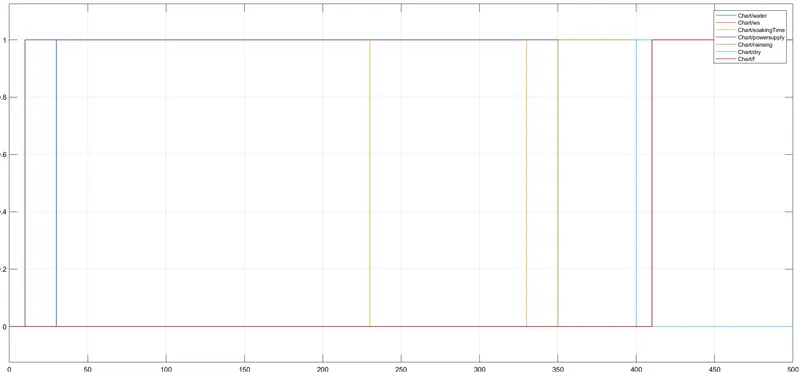
OBJECTIVE2:
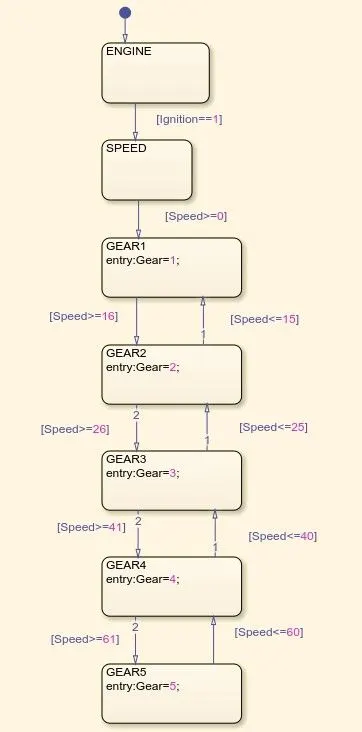
- Make a Simulink chart for the “Gear shift” logic as per the below conditions:
|
Speed Range (kmph) |
Gear |
|
0 to 15 |
1 |
|
16 to 25 |
2 |
|
26 to 40 |
3 |
|
41 to 60 |
4 |
|
Above 61 |
5 |
Give speed input while the simulation is running & display the gear number.
SIMULINK-MODEL:
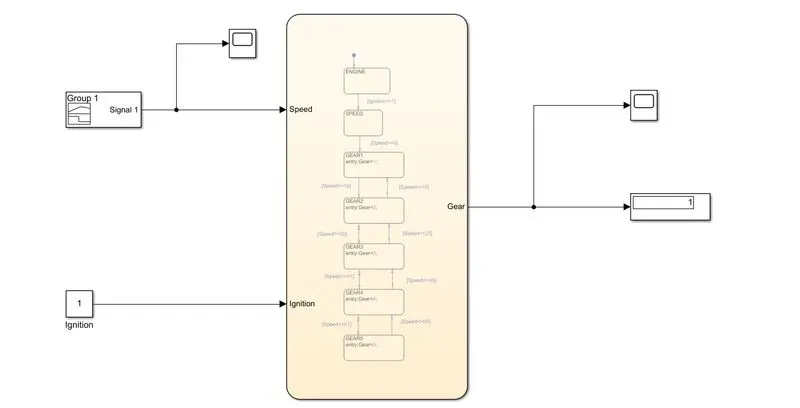
CHART:
SIMULATION:
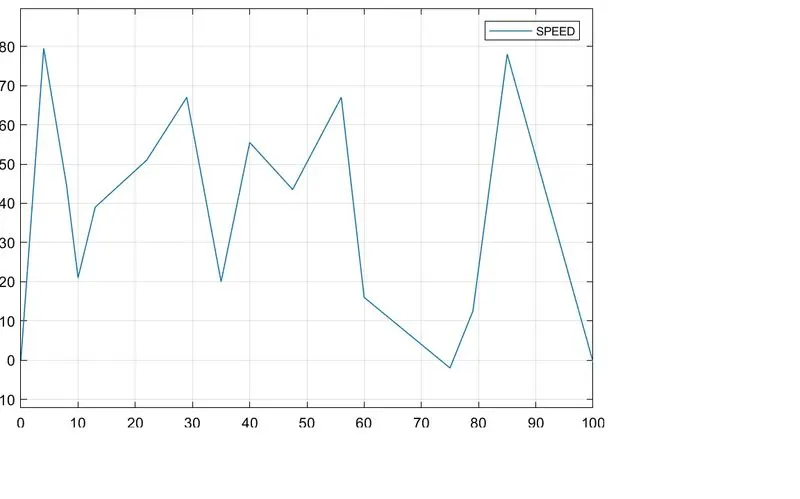
Different various speeds are given as input using the signal builder.
OUTPUT:
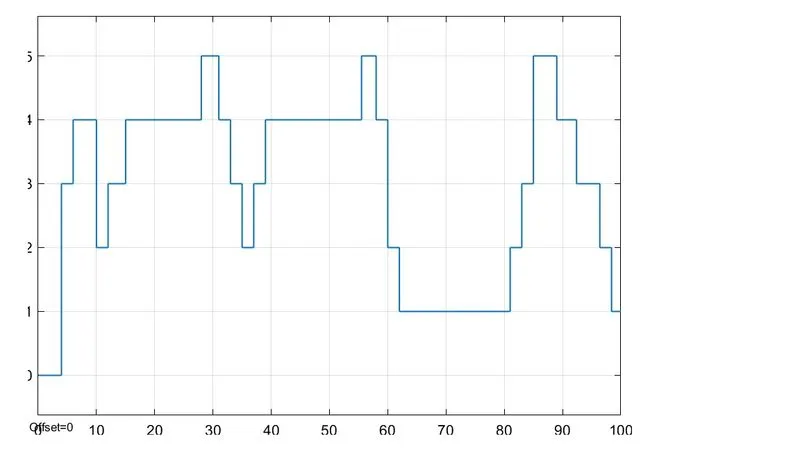
Gears are shifting according the speed variations and limits of gears.