Week - 4 Logic Of Washing Maching Using Stateflow
ANSWER 1:-
AIM:-
To Implement control logic of a “washing machine” using Stateflow as per the given sequence.
GIVEN CONDITIONS:-
- If the power supply is available, the system gets activated
- If the Water supply is not available, stop the process & indicate through LED
- Soaking time should be 200s followed by Washing time of 100s.
- Then rinsing happens for the next 20s & dryer runs for 50s.
WORKING PRINCIPLE:-
It works on the principle of Centrifugal force and centripetal forces. Where centrifugation helps quicken the process of sedimentation of different density particles to clean the laundry in the washing machine.
CONTROL LOGIC OF WASHING MACHINE USING STATEFLOW:-
Stateflow provides a graphical language that includes state transition diagrams, flow charts, state transition tables, and truth tables. You can use Stateflow to describe how MATLAB algorithms and Simulink models react to input signals, events, and time-based conditions.
Stateflow enables you to design and develop supervisory control, task scheduling, fault management, communication protocols, user interfaces, and hybrid systems.
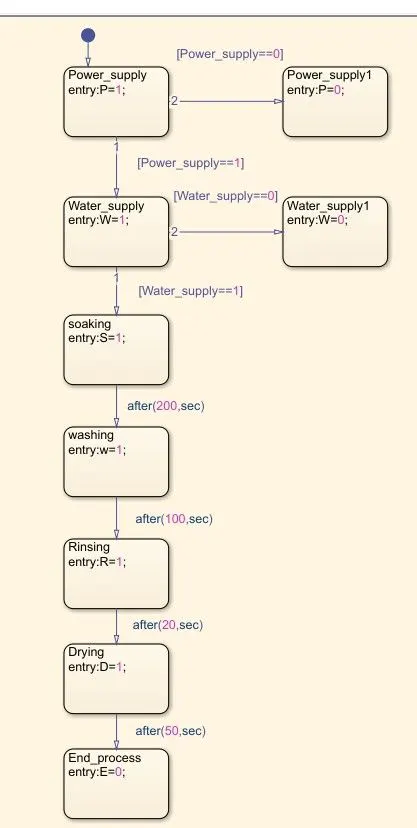
- In the above image of state flow, we used control logic which can be implemented in the washing machine to wash the clothes.
- We defined the condition it according to that given condition it will work.
- For the first, We have given the condition if the power supply is provided the system gets activated that if the power supply gets cut off then the system will not work.
- If the water supply is not available then the system will stop the process and the supply get turned off. And it will turn back on whenever the water comes back.
- Our ON condition is 1 and the OFF condition is 0.
- The process after the water supply is presented is soaking for that entry:S=1; the process is going to run for 200 sec as this is our given condition after 200sec it will go to the washing process.
- In the washing process entry:w=1; this process will continue for 100 sec after 100-sec rinsing process comes into action where the entryR=1;
- The rinsing process will remain to continue for 20sec After 20 sec it will go into the drying process where entry:D=1;
- Drying will continue for 50 sec after 50sec the process will end and the supply will cut off.
- Only the power supply and water supply is the input condition and the remaining are the output process. we need to define that it by going in symbol pane feature.
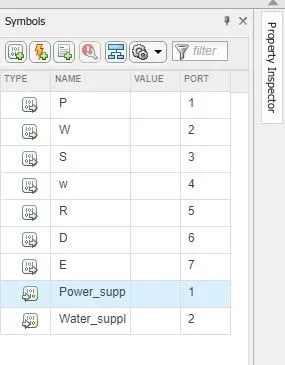
Here you can define the types whether it is input data or output data.
INITIAL CONDITION OF THE WASHING MACHINE:-
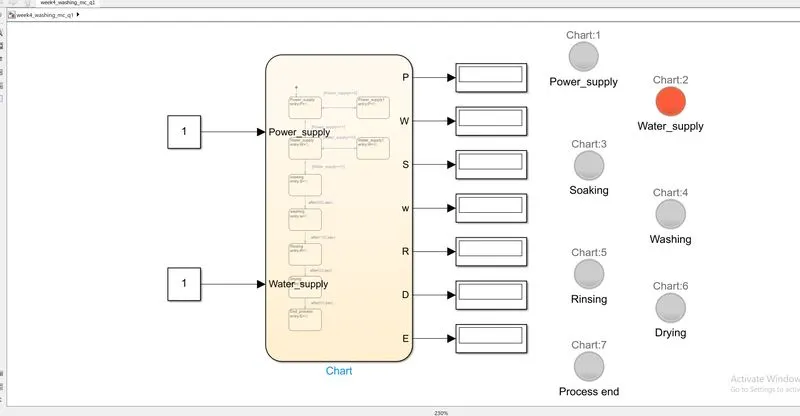
There is no water supply in the machine then the process will not be turned on.
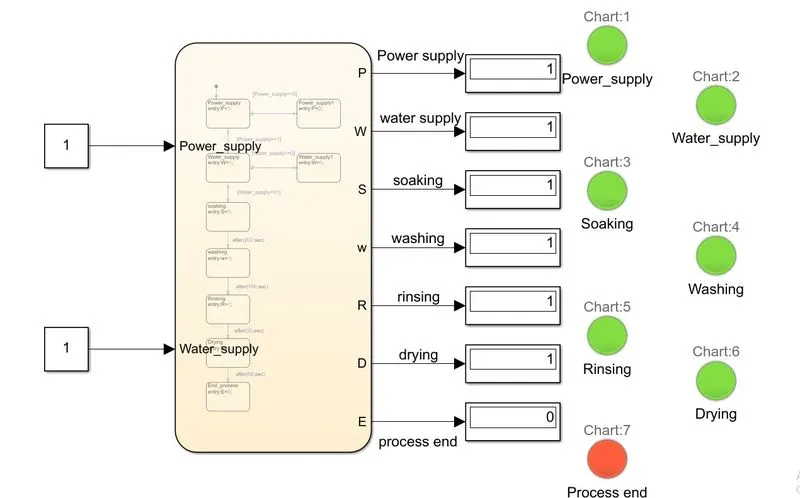
FINAL CONDITION OF THE WASHING MACHINE:-
SIMULINK BLOCKS USED:-
- Constant
- Chart
- Display
- Lamp
All the outputs are being shown on the display. And also all the process is being indicated by using the lamp.
ANSWER 2:-
AIM:-
To Make a Simulink chart for the “Gear shift” logic as per the below conditions
CONDITIONS:-
Speed Range(kmph) Gear
0 to 15 1
16 to 25 2
26 to 40 3
41 to 60 4
Above 61 5
STATEFLOW CHART:-
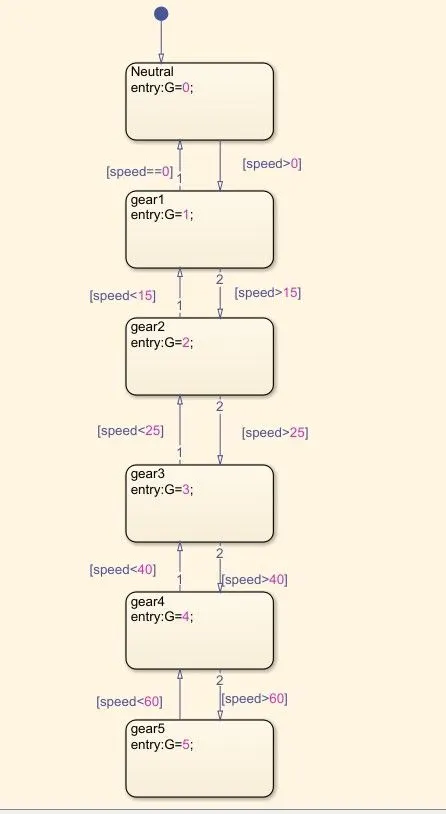
- In the above chart, all the programs are being assigned to show the gear shift indicator.
- When the speed increased the given speed will change gear with respect to the speed limit given to it.
- Here we defined the speed as input data and gear data as output data.
- Within the speed limit of 0 to15 kmph then gear 1 will be selected
- If the speed undergoes 16 to 25 Kmph then gear 2 will be selected.
- If the speed undergoes 26 to 40 Kmph then gear 3 will be selected.
- If the speed undergoes 41 to 60 Kmph then gear 4 will be selected.
- If the speed undergoes 61 and above gear 5 will be selected.
- In this process, if the speed varies below or above the speed range then the gear will upshift or downshift with respect to each condition.
- We used state block within that state block we given condition that we wanted as the output.
SIMULINK BLOCKS USED:-
- Circular gauge
- Constant
- Chart
- Display
- Lamp
- Slider
SIMULINK BLOCKS EXPLANATION:
- A circular gauge is used to show the speed in kmph also to show whether the driver is driving at the economy speed or at the high speed. And it is connected with the accelerometer to show the speed.
- The constant block is connected with the slider which is further connected to the chart which is the input data is been given to the chart which is know as gear shifter when we increase the speed in the slider it will going to show on the constant block which will going to send it to the program which is inside the chart and after running the simulation it will show the gear with respect to the input speed.
- The chart is used to give the control logic to the system inside the chart we can give the input and output condition and then it will run the system by using the given condition.
- The display is used to show which gear has been selected.
- The lamp is connected to the output display and it will indicate which gear has been selected.
WORKING DEMONSTRATION:-
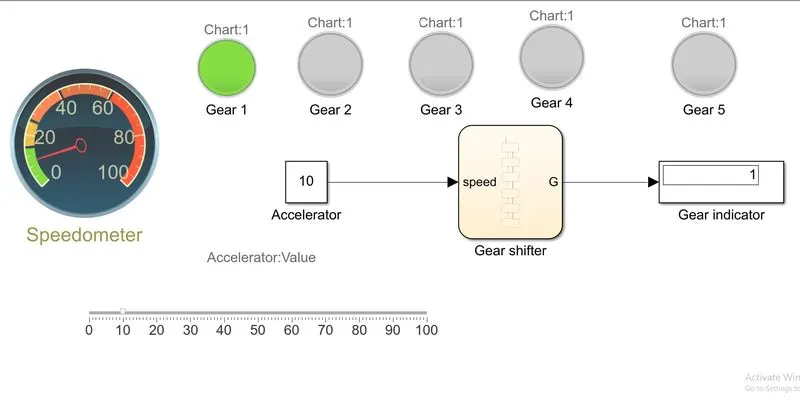
1. When the speed goes within 0 to 15 kmph.
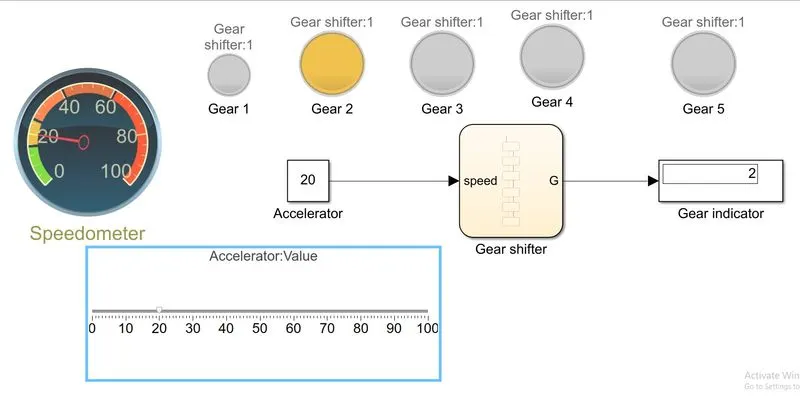
2. When the speed goes within 16 to 25 Kmph.
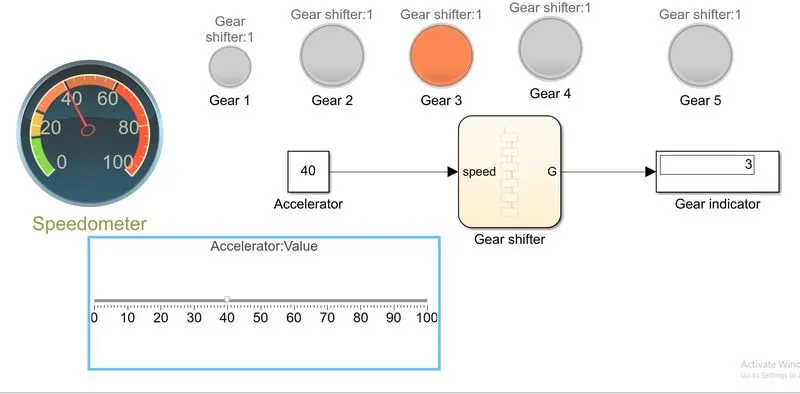
3. When the speed goes within 26 to 40 Kmph.
4. When the speed goes within 41 to 60 Kmph.
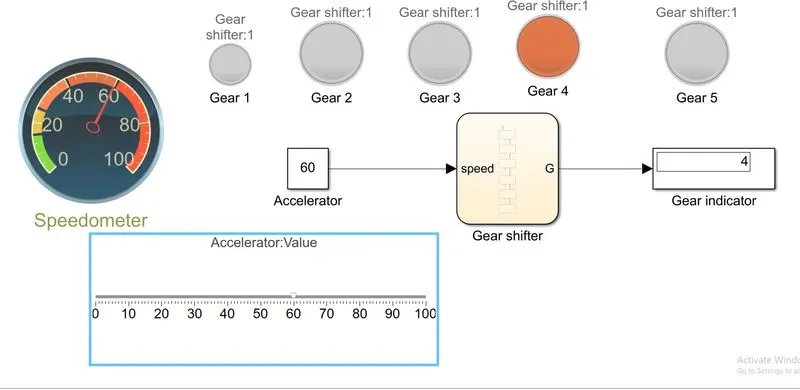
5. When the speed goes 61 kmph and above.
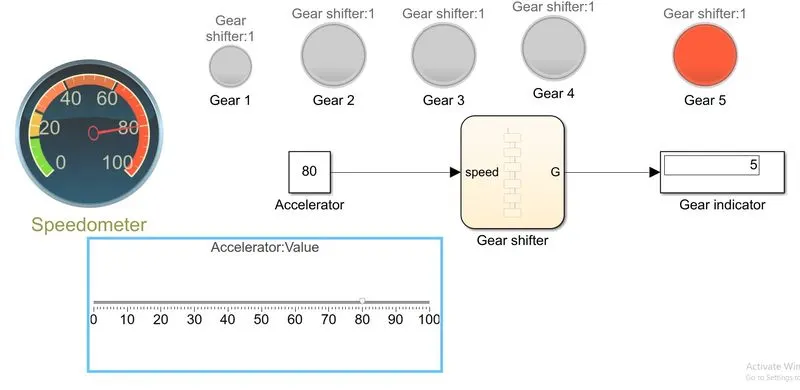
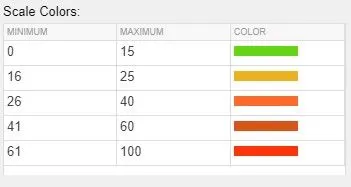
When the speed range varies the speedometer colour will change with respect to speed if the speed goes high it will indicate that the vehicle is going fastly.
RESULT:-
Simulation of the gear shifter corresponding to the speed has been carried out.