Week 4.1 - Genetic Algorithm
AIM:-
To understand the concept of the genetic algorithm by referring to various sources before you attend this challenge. Look out for information regarding the stalagmite function and ways to optimize it.
OBJECTIVE:-
- To write a code in MATLAB to optimize the stalagmite function and find the global maxima of the function.
- To Clearly explain the concept of genetic algorithm in your own words and also explain the syntax for ga in MATLAB in your report.
- To Make sure that your code gives the same output, even if it is made to run several times.
- To Plot graphs for all 3 studies and F maximum vs no. of iterations. Title and axes labels are a must, legends could be shown if necessary.
THEORY:-
Optimization:-
Optimization is the area of study that deals with maximizing or minimizing a particular function that depends on multiple input parameters. By doing the optimization we will be able to find minimum variations in the value lets say if we design the aircraft wing by using optimization we will be able to find minimum drag in it.
Genetic algorithm:-
It is proposed by Charles Darwin which is an evolution theory. Genetic algorithm is one of the optimization processes. It is a search-based optimization technique based on the process of genetic and natural selection. It is frequently used to find optimal or near-optimal solutions. It is frequently used to solve optimization problems in research and machine learning.
- Genetic algorithm optimization starts with population initialization. In the initialization first, we need to decide the population size, the higher the population size we will get more combinations hence will get more accurate results.
- In the selection process, the parents are selected from sample data points the main objective of the selection process is to select highly fit individuals.
- Cross-over is the process of taking two parents and producing the children from them by interchanging the genes.
- One of the methods of cross-over is mutation it is carried out to maintain the genetic diversity from one generation of populations of chromosomes to the next. In this process, the genes will be replaced by random integers. If a mutation is not performed the chromosomes will become too similar to each other. Convergence takes place soon and the result is local minima.
- Fitness function is a function that measures how good your solution is. The fitness function takes the solution as input and produces the suitability of the solution as the output. This evaluates how close the solution is to the optimal solution of the desired problem.
- Where GA is used?
Genetic Algorithms are primarily used in optimization problems of various kinds, but they are frequently used in other application areas as well.
The areas in which Genetic Algorithms are frequently used are listed below.
Optimization - Genetic Algorithms are most commonly used in optimization problems wherein we have to maximize or minimize a given
objective function value under a given set of constraints.
• Economics - GAs are also used to characterize various economic models like the cobweb model, game theory equilibrium resolution, asset
pricing, etc.
• Neural Networks - GAs are also used to train neural networks, particularly recurrent neural networks.
• Image Processing - GAs are used for various digital image processing (DIP) tasks as well as dense pixel matching.
The above are some of the areas where the Genetic Algorithm is extensively used for optimization.
Stopping criteria:-
Stopping criteria refers to conditions that must be reached to stop the execution of the algorithm. Some of the most common stopping conditions are execution time, a total number of iterations, non-improving iterations, optimal (lower bound for a min, upper bound for max) solution found, etc.
Syntax for GA:-
Description:-
x = ga(fun,nvars,A,b,Aeq,beq,lb,ub,nonlcon)nonlcon. The function nonlcon accepts x and returns vectors C and Ceq, representing the nonlinear inequalities and equalities respectively. ga minimizes the fun such that C(x) ≤ 0 and Ceq(x) = 0. (Set lb=[] and ub=[] if no bounds exist.)
[, for any previous input arguments, also returns x,fval] = ga(___)fval, the value of the fitness function at x.
Stalagmite function:-
A stalagmite function generally refers to the function with which we are generating values over a stalagmite kind of surface for finding out the local and global maxima and minima of that particularly given function. This is the three-dimensional function.
FUNCTION CODE OF STALAGMITE:-
This is the function code for the stalagmite function which is used to calculate global maxima and minima of the, particularly given function. We have used the exponential function and the sin function to calculate the values of the stalagmite function. And multiply all the individually calculated values of the stalagmite function.
% Function of stalagmite
function f = stalagmite(input_vector)
x = input_vector(1);
y = input_vector(2);
f1_x = (sin(5.1*pi*x+0.5))^6;
f1_y = (sin(5.1*pi*y+0.5))^6;
f2_x = exp(-4*log(2)*((x-0.0667)^2)/(0.64));
f2_y = exp(-4*log(2)*((y-0.0667)^2)/(0.64));

f = -(f1_x*f1_y*f2_x*f2_y);
end
MATLAB CODE FOR GENETIC ALGORITHM:-
- If you don't know the value of the function you can calculate it by optimization method which we are studying in this challenge in this problem we have the known function so we can march towards the global maxima function for this we are using genetic algorithm.
- It is the evaluation theory that was proposed by Charles Darwin and Matlab that provides an inbuilt function that helps us do GA efficiently.
- We need two-dimensional arrays for that so we converted the one-dimensional arrays into 2-dimensional arrays.
- We have used the different syntax of the genetic algorithm to see how the variations occur in the output plot.
- We have studied the three different studies in this code to see how the genetic algorithm varies from each other.
- The first study was the statistical behavior of the unbounded inputs. In this method, we have generated the outputs but they vary much that is why we run the second study.
- In the second study, we have studied the statistical; behavior with upper and lower bonds In that also we get many random values as our graph was not stable.
- In the third study, we increase the iterations of the genetic algorithm. And define the population as 150 so we get more accurate results from it.
- And in the third study, we get the more accurate result with minimum random values in it.
clear all
close all
clc

% For defining the search space using linspace command

x  = linspace(0,0.6,150);
y  = linspace(0,0.6,150);
num_cases = 50;

% Creating 2 dimensional mesh using meshgrid command
[xx,yy] = meshgrid(x,y);
% Evaluating the stalagmite function
for i = 1:length(xx)
    for j = 1:length(yy)
        input_vector(1) = xx(i,j);
        input_vector(2) = yy(i,j);
        f(i,j) = stalagmite(input_vector);

   end
end

tic

% Study 1 - Statistical behavior

for i = 1:num_cases
    [inputs,fopt1(i)] = ga(@stalagmite,2);
    xopt1(i) = inputs(1);
    yopt1(i) = inputs(2);
end
study1_time = toc;
figure(1)
subplot(2,1,1)
surfc(x,y,f)
shading interp
hold on
plot3(xopt1,yopt1,fopt1,'marker','o','markersize',5,'markerfacecolor','r')
title('Unbounded inputs')
subplot(2,1,2)
plot(fopt1)
xlabel('Interations')
ylabel('Function minimum')


tic
% Study2- Statistical behavior With upper and lower bonds
for i = 1:num_cases
    [inputs,fopt2(i)] = ga(@stalagmite,2,[],[],[],[],[0;0],[1;1]);
    xopt2(i) = inputs(1);
    yopt2(i) = inputs(2);

end
study2_time = toc
figure(2)
subplot(2,1,1)
hold on
surfc(x,y,f)
shading interp
plot3(xopt2,yopt2,fopt2,'marker','o','markersize',5,'markerfacecolor','r')
title('Bounded inputs')
subplot(2,1,2)
plot(fopt2)
xlabel('Interations')
ylabel('Function minimum')


%Study 3 - Increasing GA iterations

options = optimoptions('ga','populationSize',150);
tic
for i = 1:num_cases
    [inputs,fopt3(i)] = ga(@stalagmite,2,[],[],[],[],[0;0],[0.6;0.6],[],[],options);
    xopt3(i) = inputs(1);
    yopt3(i) = inputs(2);
end
study3_time = toc
figure(3)
subplot(2,1,1)
hold on
surfc(x,y,f)
shading interp
plot3(xopt3,yopt3,fopt3,'marker','o','markersize',5,'markerfacecolor','r')
title('Bounded inputs Minimize a Nonlinear Function with Integer Constraints ')
subplot(2,1,2)
plot(fopt3)
xlabel('Interations')
ylabel('Function minimum')
Output of Study 1:-
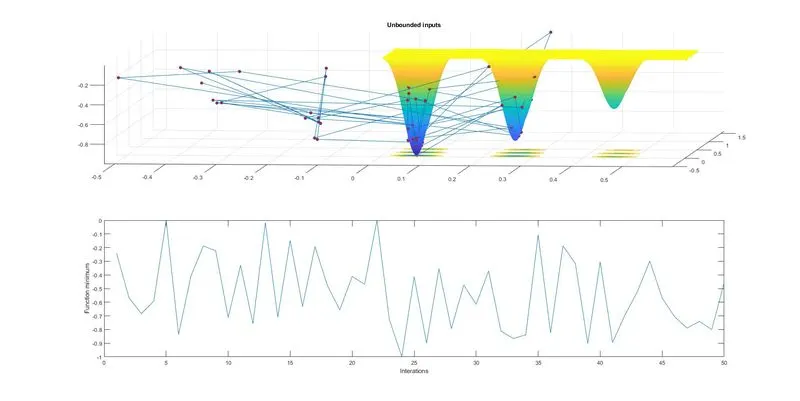
- For the first case, we are analyzing GA for statistical behavior
- As we can see in the output plot of the first study here we analyzed and calculated the statistical behavior of GA. The stalagmite function that we used we put the negative sign on the formula we achieved the global maxima.
- The iteration is giving lots of values and changes rapidly all over the 3D plot which shows it is a random sampling from the initial population.
- It does not help us fin the global maxima as the values generating are very random in the curve plot we can see the iterations and function minimum the curve is fluctuating.
- As the ga(@stalagmite,2) as we are calling our stalagmite function with the variable 2 to our GA code but this gave us so many random values and does not help achieve the global maxima.
Output of Study 2:-
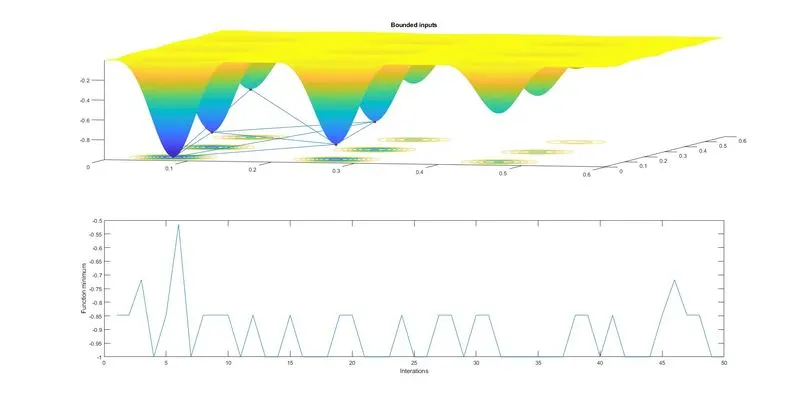
- In the second study, we are analyzing the genetic algorithm for statistical behavior with upper bonds and lower bonds.
- with the help[p of upper and lower bonds we get better results as compared to the first study.
- All though the process is same as first case except the Upper bonds and Lower bonds values which are provided as [inputs,fopt2(i)] = ga(@stalagmite,2,[],[],[],[],[0;0],[0.6;0.6]);
- The iterations are generating fewer values than that of the first one in the result because these variations are also less.
- Only five iterations values are generated here so it is a little easy to find the local and global maxima here. Because we have given the upper and lower bonds we were able to achieve lesser values than the first study.
- But we wanted only one local and global maxima for that we used the third study.
Output of Study 3:-
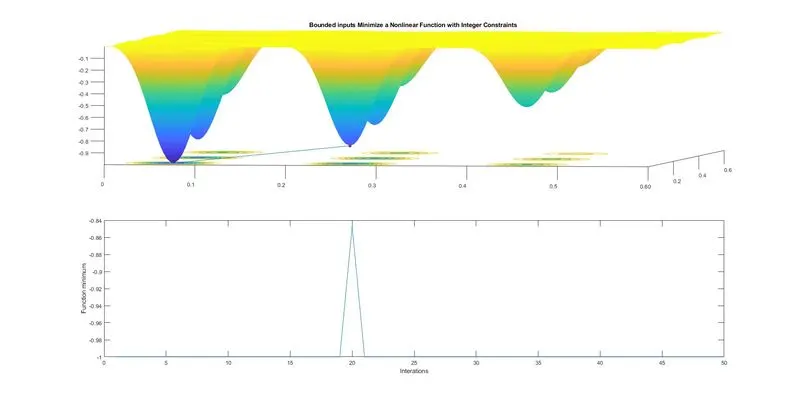
- After running the third study for analyzing genetic algorithms for increasing genetic iterations.
- All the coding process is the same as the first and second study except the GA iterations are increasing.
- For that we used the different GA syntax [inputs,fopt3(i)] = ga(@stalagmite,2,[],[],[],[],[0;0],[0.6;0.6],[],[],options);
- Also, we have defined the population size as 150 we can also increase the population size to get the optimum result.
- The iterations are generating only one value which is more accurate than that of the second study.
- And from the plot, we see the iterations are constant it is only showing one value which is our global maxima values.
So with the different syntax of GA and some values, we can have fewer variations in the plot.
CONCLUSION:-
With the help of MATLAB, we understand the concept of the genetic algorithm by referring to various sources before we attended this challenge, and then we successfully get the value of global maxima by studying the various syntaxes of GA.
REFERENCES:-
https://in.mathworks.com/discovery/genetic-algorithm.html
https://skill-lync.com/knowledgebase/genetic-algorithm-explained