State flow modelling using simulink
1. Implement control logic of a “washing machine” using Stateflow as per given sequence:
Conditions:
- If the power supply is available, the system gets activated
- If the Water supply is not available, stop the process & indicate through LED
- Soaking time should be 200s followed by Washing time of 100s.
- Then rinsing happens for next 20s & dryer runs for 50s
After all the processes have completed turn on the finished LED
Study-1
The typical outlook of a washing machine is shown below. It consist of the following parts as marked below which is visible to our naked eye. Most of the automation in the washing machine is done by software programming. In this study one such part of the program is executed with the certain given conditons.
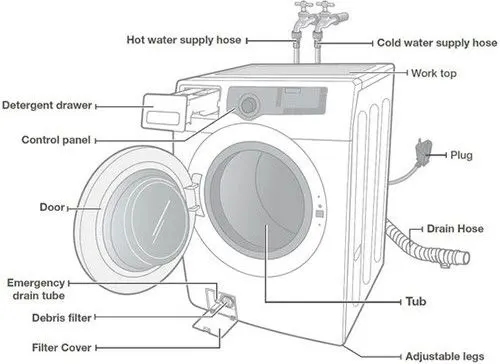
Inner drum is the part you see as it is where you put clothes when washing. This inner drum has holes. For a front loader, the drum faces forward while in a top loader, the drum faces up. Outer drum is bigger than the inner drum and cannot be seen. Its basic function is to hold water as the inner drum rotates. The pump pushes water from the drum when washing is complete. Programmer tool assists in helping the machine follow through the series of steps, from spinning clothes to rinsing and wringing. There are three pipes. One is for hot clean water; the second one for cold water while the third throws dirty water out of the machine. The efficiency of a machine heavily depends on a programmer. With the help of a programmer, washing machines can easily wash clothes while diligently following the series of orders. Our focus here is on the programmer and how the output is indicated in the control pannel.
Thus a simulink model of the washing machine with a series of condition of conditions stated above is made and simulated is shown below. The red indicates 0 value or the OFF state and the green indicates 1 value or the ON state. Two switches are connected one for the power and other is to control the water flow. Based on their state (ON or OFF) the lamp color is shown.
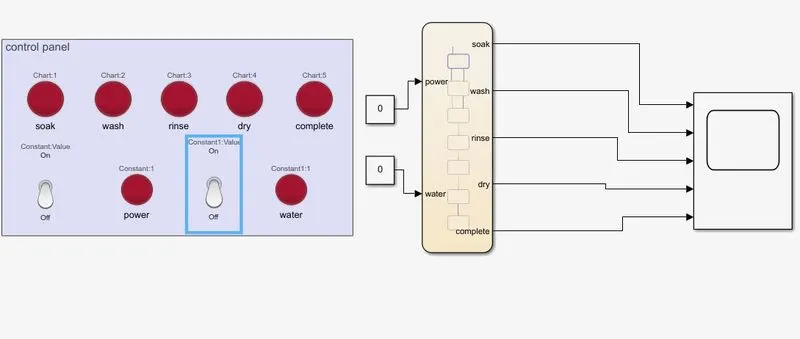
Since initially when the machine is idle and when we run the simulation the indications to all the process shown red color which means it is initially in OFF state.
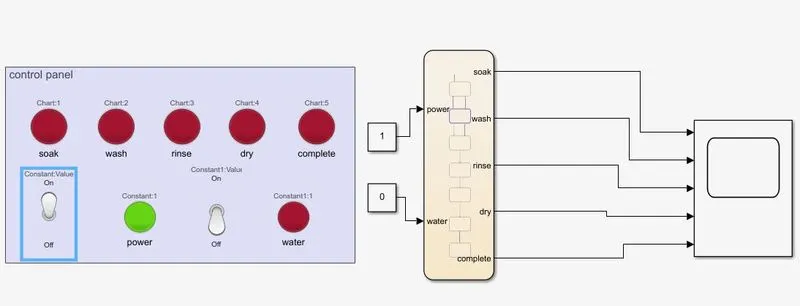
Now the power is turned ON and the the value is changed to 1 in the constant block. The remaining processes are yet to be started hence it still shows the red indication.
As per the condition only when both power and water are available the machine follows the remaining process. The conditions for the simulation of the model is given in the chart as shown below. The inputs and the ouput ports are necessary and to be mentioned to have an error free simulation.
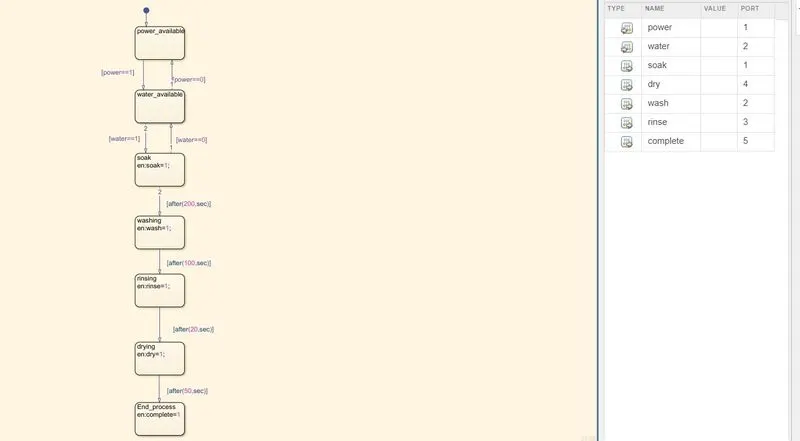
Now the water is made available by turning on the switch and once the water level is reached the other processes starts automatically since the initial conditions are met.
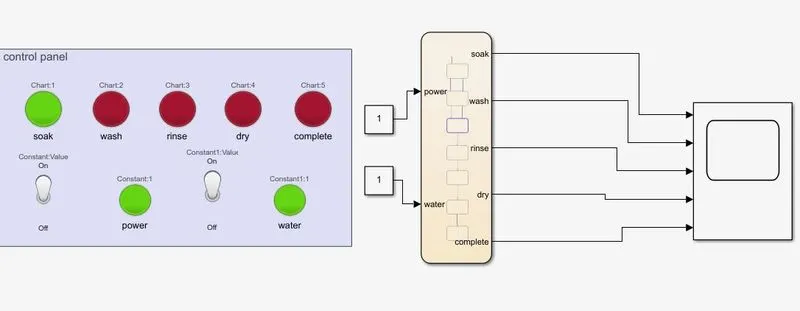
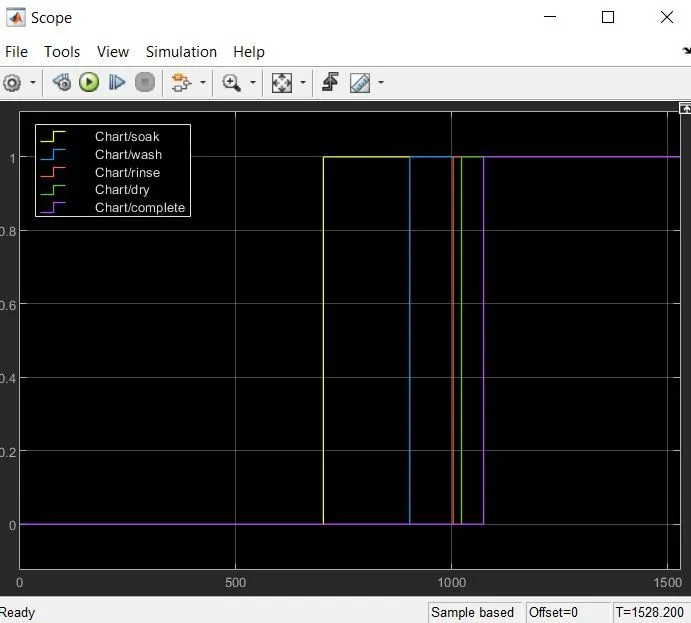
It starts with soaking and a period of 200 seconds it proceeds with the next process of washing which has a time period of 100 seconds.
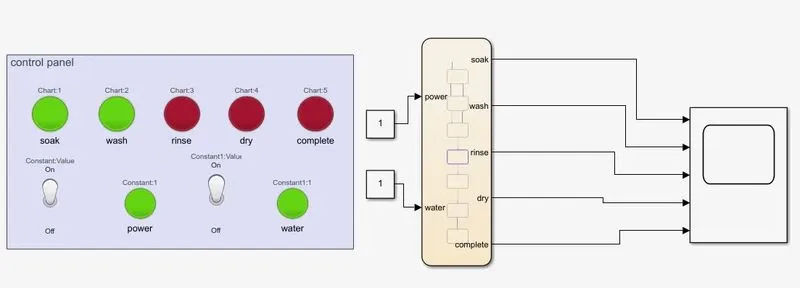
It then proceeds to the rinsing process.
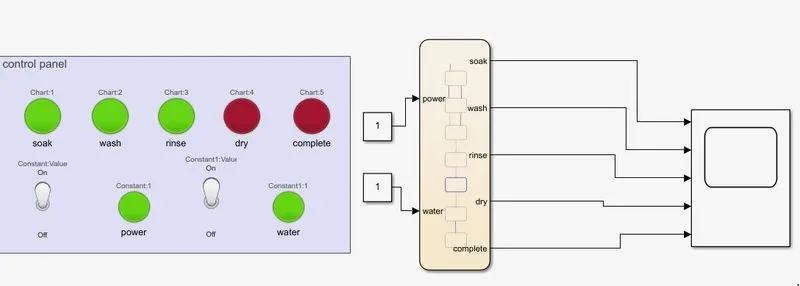
This action takes place for a time period of 20 seconds and then for the next 50 seconds the dryer is ON and the drying process is carried out.
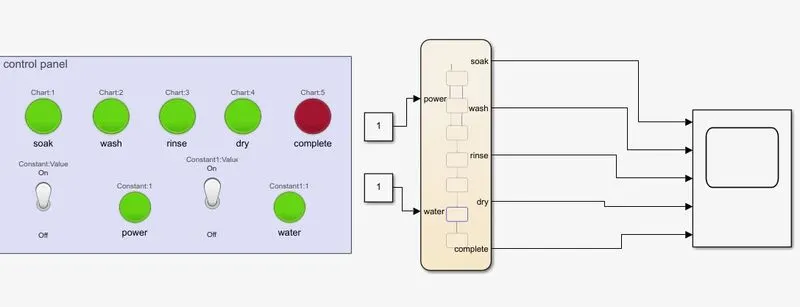
This is the end process where the clother after rinsing, spinning and wriggling gets completely removed from dirt and heavy water. Once this process is complete the machine indicated the work complete. Usually with an automatic sound but here it is indicated with the green lamp as shown below.
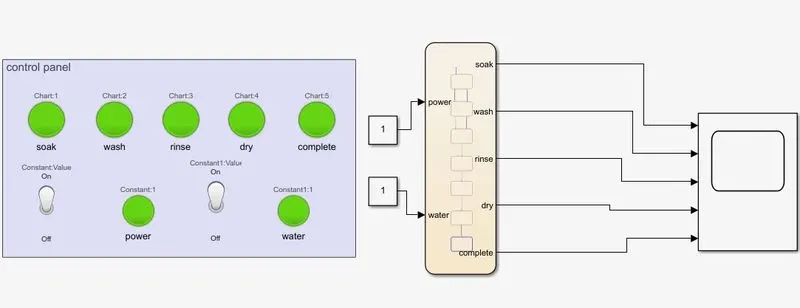
We have connected the output to the scope to visualize the wave format of the sequence of process. The output is displayed below.
Study-2:
Make a Simulink chart for the “Gear shift” logic as per below conditions:
| SpeedRange(Kmph) | Gear |
| 0 to 15 | 1 |
| 16 to 25 | 2 |
| 26 to 40 | 3 |
| 41 to 60 | 4 |
| above 61 | 5 |
Give speed input while the simulation is running & display the gear number.
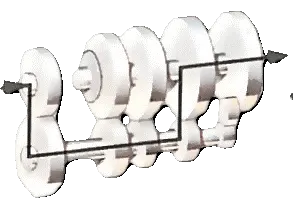
Here the gear shift in the car is studied. The picture below shows the real-time gear system handled in the car. As depicted it has first gear followin through the sixth gear and then a reverse gear. All the gears except those needed for reverse are constantly in mesh. For reversing, an idler gear is interposed between gears on the two shafts, causing the mainshaft to reverse direction.
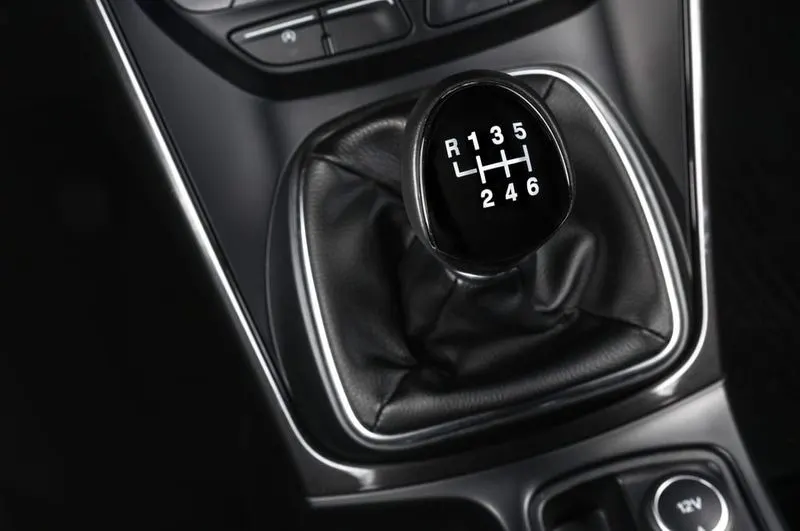
Initial point is the neutral gear. The gears on the output shaft revolve freely around it, while those on the layshaft are fixed. No drive is being transmitted in the neutral gear position.
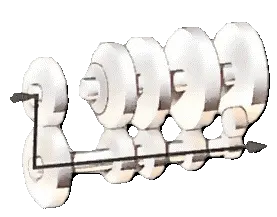
Neutral gear
As per the given conditions the simulink model is made and the conditions to run the simulation is given in the chart as shown below. The input and the ouput parameter should be specified from the symbols pane. The input and output variables should be given properly to get the correct ouput. Here the speed is the input variable and the gear represent the ouput.
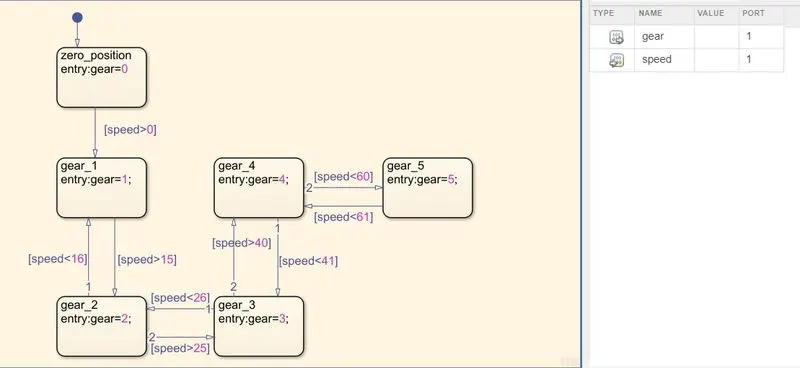
Once the speed increases the ouput gear value changes accordingly similar to the real time process but there the gear is changed before we increase the speed. This simulation model is to have an understanding about the gear shifts based on the speed variation. Hence we consider the speed as input and the gear to be the ouput.
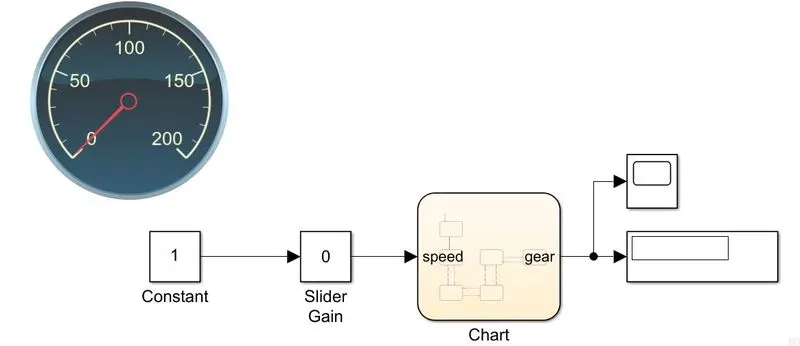
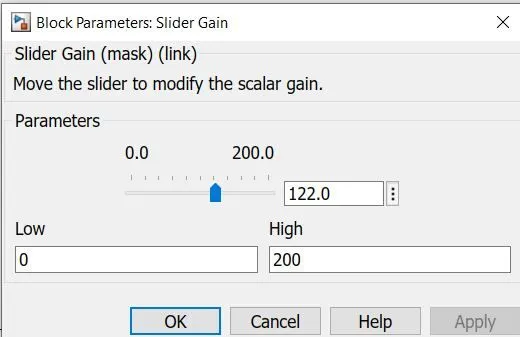
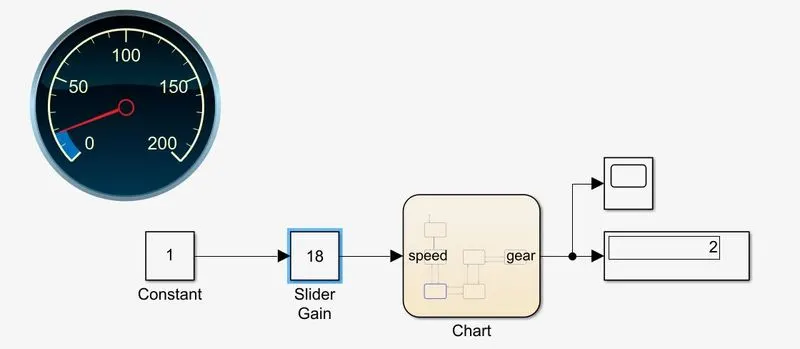
The model shown above depicts the the gear system where the slider gain is the throttle where we can accelerate and decelerate the speed according to the road conditions and the traffic. Here the slide bar in the block parameter of the slide gain is adjusted to vary the input value of the speed.
In first gear, the smallest gear on the layshaft (with the fewest teeth) is locked to it, passing drive through the largest gear on the mainshaft, giving high torque and low speed for a standing start.
In second gear, the difference in diameter of the gears on the two shafts is reduced, resulting in increased road speed and lower torque increase. The ratio is ideal for climbing very steep hills.
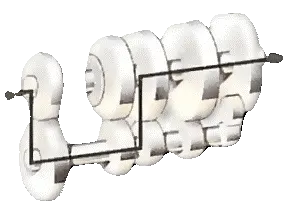
The picture shown below is an example of the vehicle in the second gear as the speen value is 18 Kmph.
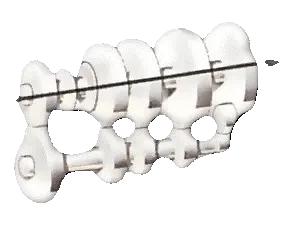
Similar to the second gear is the third gear but there is a slight variation in the fourth gear. In fourth gear, the input shaft and mainshaft are locked together, providing 'direct drive': one revolution of the propellor shaft for each revolution of the crankshaft. There is no increase in torque.
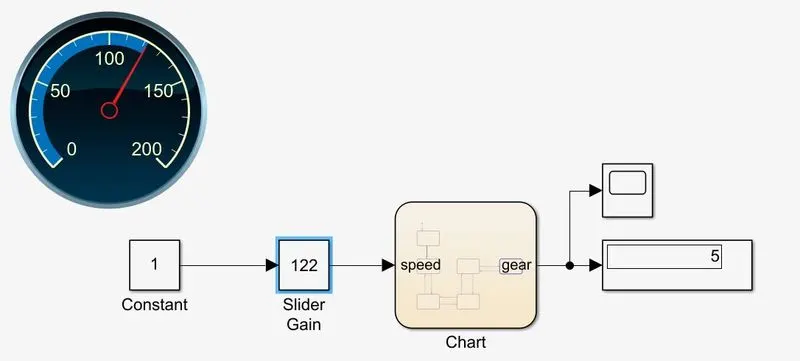
Now, the speed is increased by varying the slider gain value to obtain the fifth gear as shown below.
To run a real time simulation the throttle (slider gain) is moved to various positions as such increasing and decreasing the speed and the output is observed in the scope.
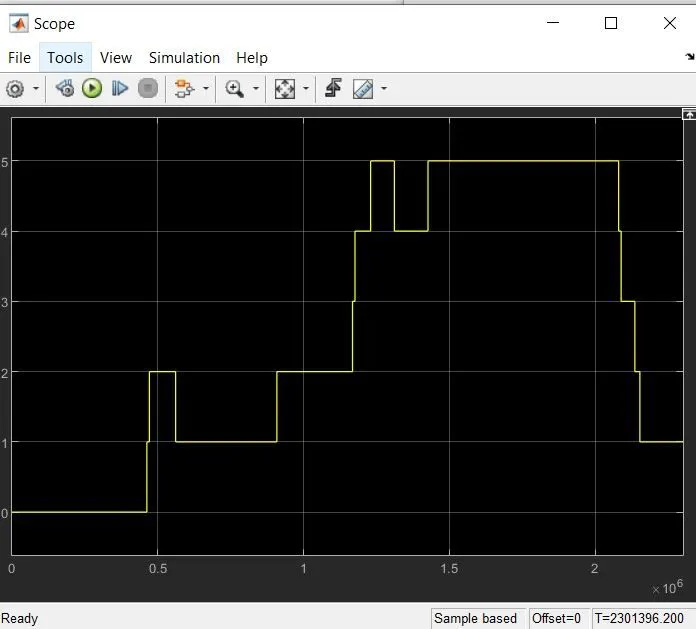
The values shown in the scope, slider gain and the speedometer are the same which represents the speed in Kmph and the value shown in the display and the y-axis of the scope represents the gear values.
Thus, the models of the real-world environment is studied in the simulink and the respective outputs are obtained.