Week 4.2: Project Transient simulation of flow over a throttle body
TRANSIENT SIMULATION OF A FLOW OVER A THROTTLE BODY
Introduction:
A throttle is the mechanism by which fluid flow is managed by constriction or obstruction.
An engine's power can be increased or decreased by the restriction of inlet gases (by the use of a throttle). The term throttle has come to refer, informally, to any mechanism by which the power or speed of an engine is regulated.
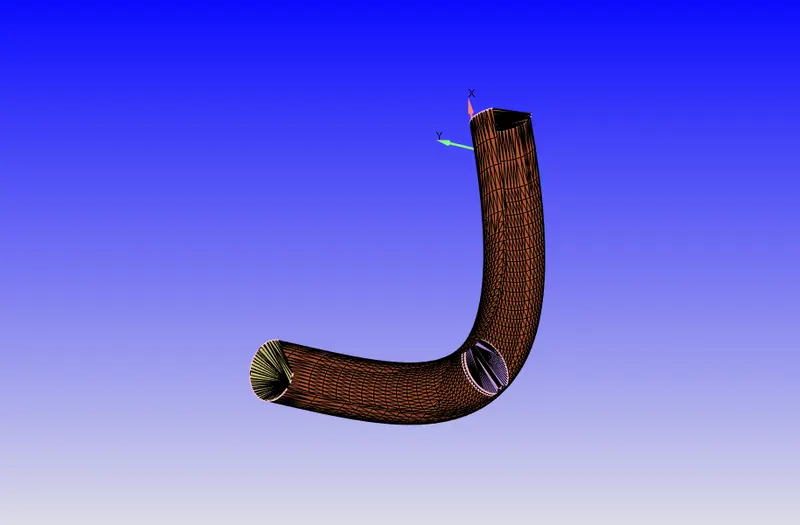
Objective:
In this project we have to simulate flow of fluid over a throttle body in transient and post process the results.
Given data's:
Application: General Flow
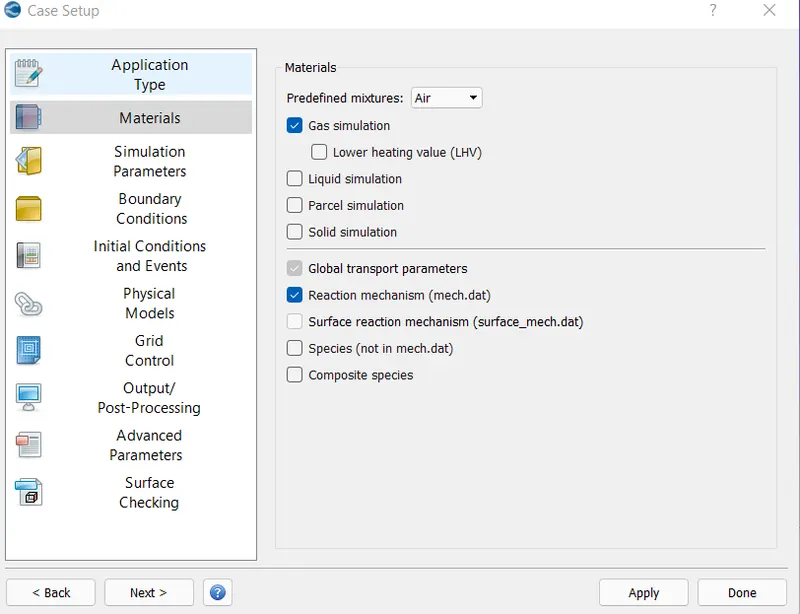
Materials:
Predefined mixture: Air
Simulation parameters:
Solver: Transient
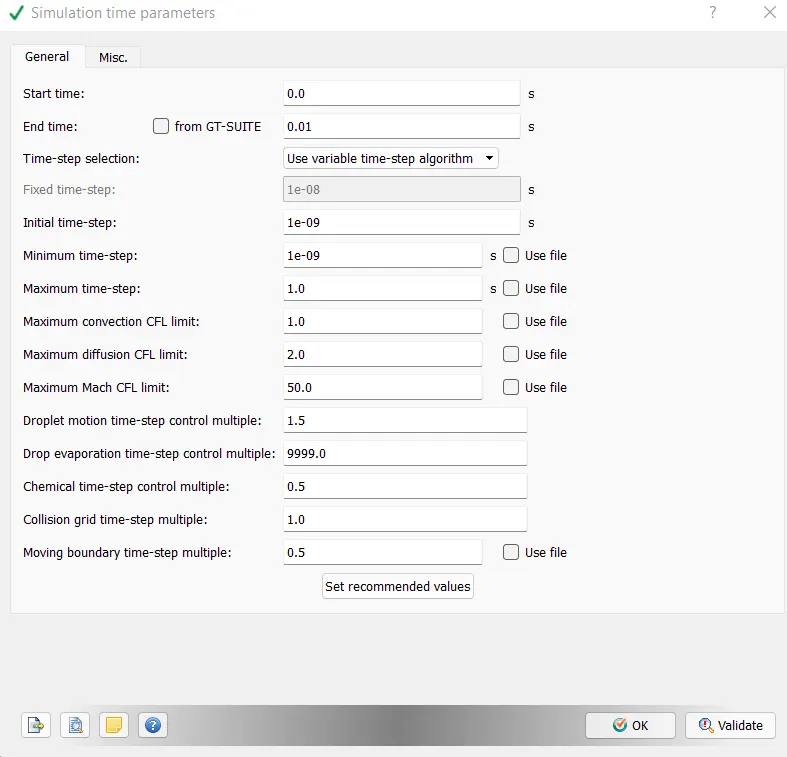
Simulation time calculation parameters:
Time taken for a flow through the elbow:
Time = Length of elbow/flow velocity
Approximate length = 0.2m
Velocity - 200m/s
Therefore the time taken for a single flow simulation = 1m/s
And for 10 simulation - 10m/s
Start time = 0
End time = 0.01s
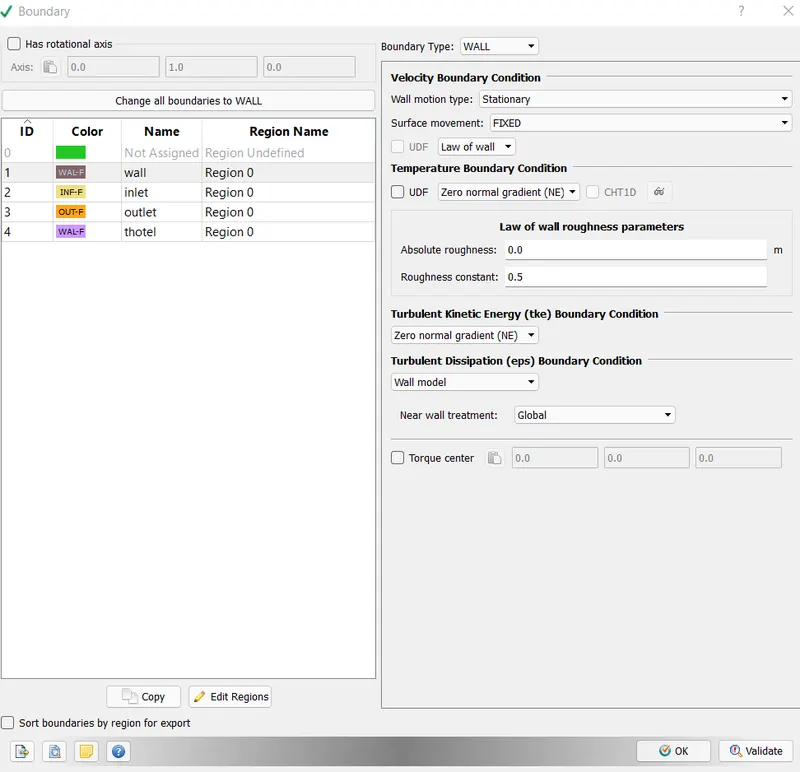
Boundary Conditions:
Elbow: wall
Throttle: wall
From 0 to 2 ms the valve will rotate about 25 degrees. • Then From 2 to 4ms it will stay at 25 degrees.
After which by 8ms the valve will get back to it's original position
Inlet: Inflow
• Pressure: 1.5e5
Outlet: Outflow
• Pressure: 1e5
Grid Control:
Base grid:
. dx-dy-dz-0.002
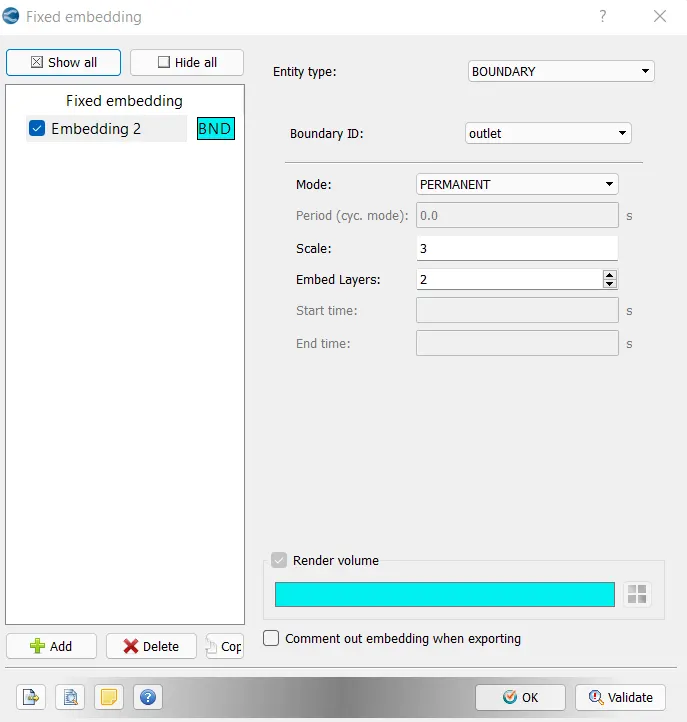
Fixed Embedding At throttle
• Scale: 3
Embedding layers:2
Base Setup:
Export all the output files in the folder and run with the CIGWIN command
after the complition of the code post process the files and exicuite the plots and animation
Explanation of the plots
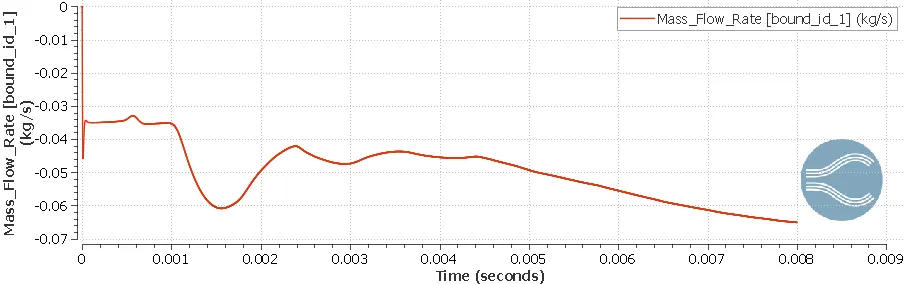
* Mass Flow Rate
By analyzing the plot we can understand that the mass of air flows inside is equal to the mass of air flows out.
But initially when the throttle opens there are extreme changes until 2m/s and at 2-4m/s the flow is steady and it increases gradually until the valve reaches the initial position.
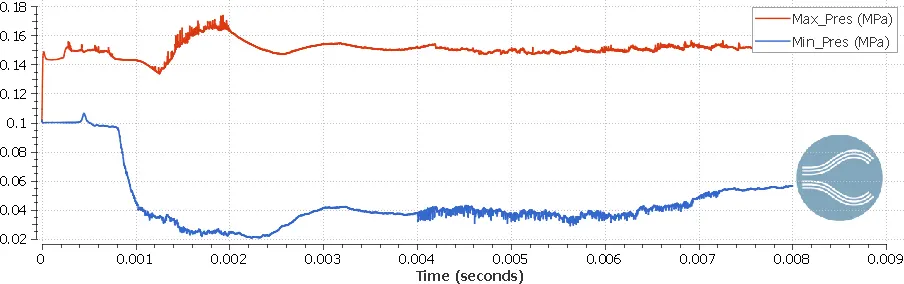
* Pressure
By analyzing the plot we can understand that initially the static pressure is high at inlet and tends to decrease.
This is because when throttle opens the low pressure region is created because of change in geometry and thus the pressure decreases before 2m/s and at 2-4m/s it increases and stays constant that is because the throttle position is remains constant and then decreases as the valve moves to its original position.
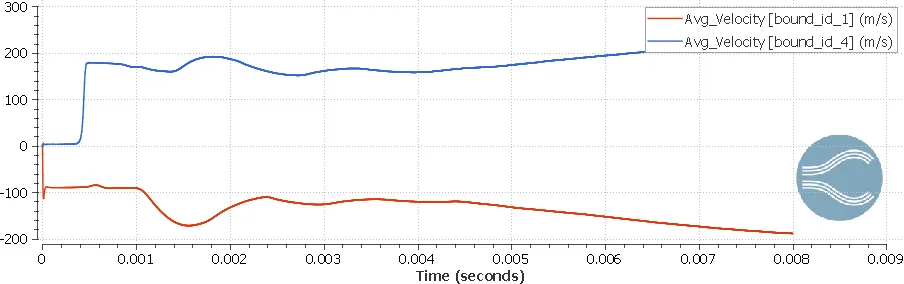
* Velocity
The Velocity of air at inlet is low and it is increased when it reaches the oulet.
This is because the applied inlet pressure is high and oulet pressure is low. • But initially when the throttle opens there are extreme changes until 2m/s after 2-4m/s the flow is steady and it increases gradually until the valve reaches the initial position.
* Total cell count
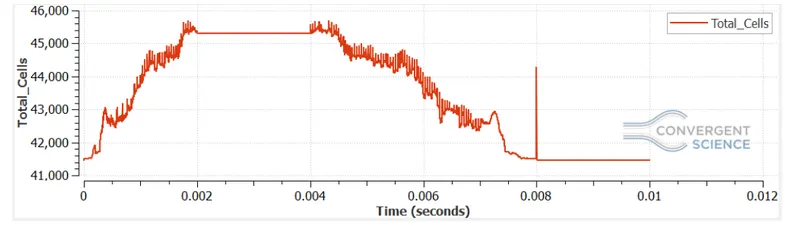
As we see the plot the cell count tends to increase when the throttle valve is opening about 25 degree until 2m/s. Then from 2-4m/s the cell count remains constant so as the throttle then it decreases when the throttle is moving to its original position.
YouTube link for the Animation
Conclusion
Pressure at outlet of pipe builds up as air flow throgh elbow.
The veolcities are higher around throttle.
Mass flow rate can be controlled according to throttle position.
**********************************************************************************