Week - 4
Aim: Implement control logic of a “washing machine” using Stateflow as per given sequence and make a Simulink chart for the “Gear shift” logic as per given conditions.
Objective:
- Implement control logic of a “washing machine” using Stateflow as per given sequence:
- If the power supply is available, the system gets activated.
- If the Water supply is not available, stop the process & indicate through the LED.
- Soaking time should be 200s followed by Washing time of 100s.
- Then rinsing happens for the next 20s & dryer runs for 50s.
- After all the processes have completed turn on the finished LED.
2. Make a Simulink chart for the “Gear shift” logic as per below conditions:
Speed Range(kmph) Gear
0 to 15 1
16 to 25 2
26 to 40 3
41 to 60 4
Above 61 5
Give speed input while the simulation is running & display the gear number.
Solution of Objective-1:
Simulink Model of Washing Machine:
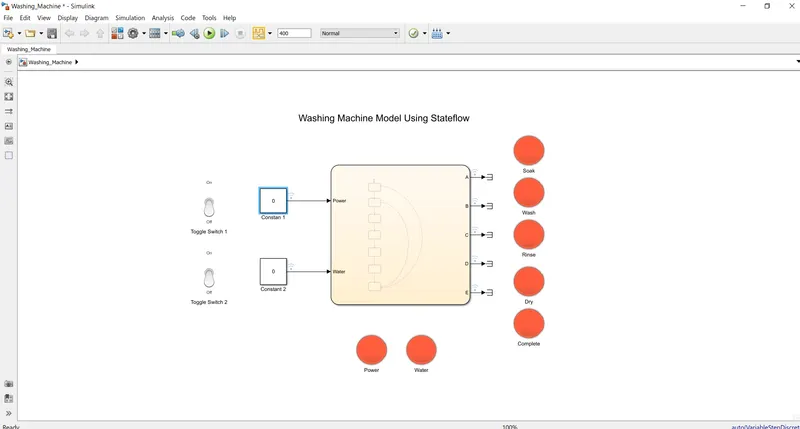
Case-1: Power & Water supply off
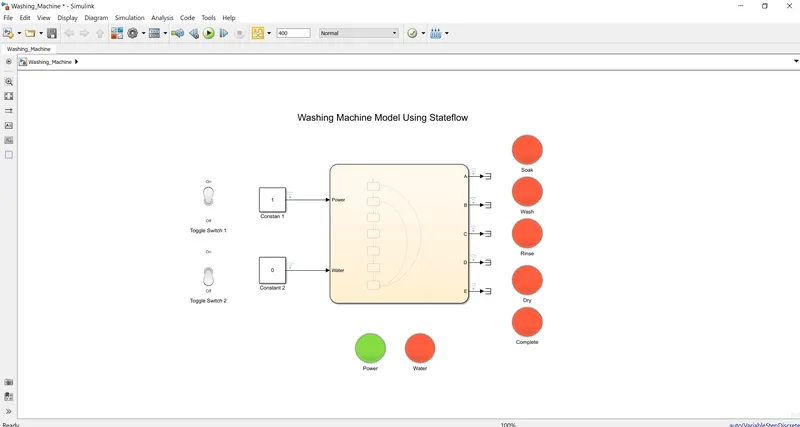
Case-2: Power on and Water supply off
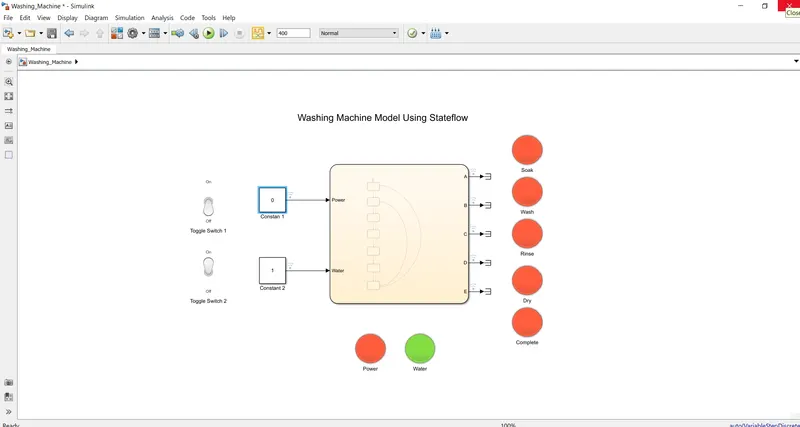
Case-3: Power off and Water supply on
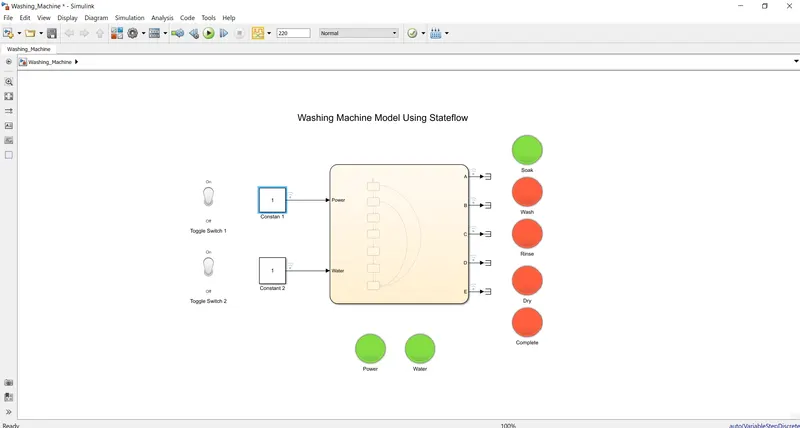
Case-4: Power on, Water supply on, Only Soak completed
Case-5: Power on, Water supply on, Only Soak & Wash completed
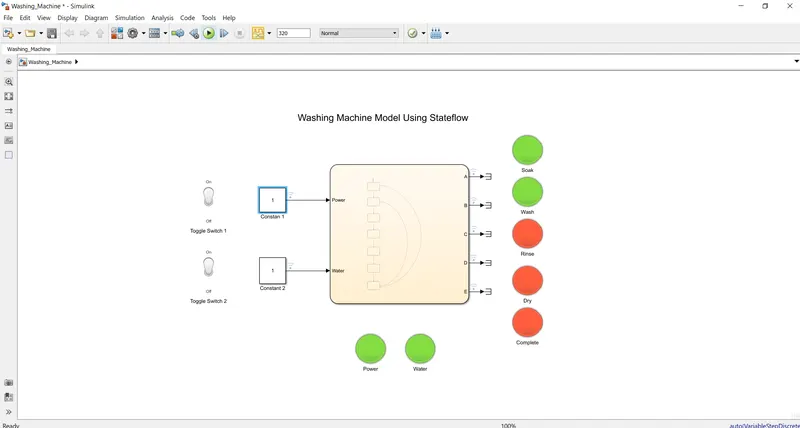
Case-6: Power on, Water supply on, Only Soak, Wash & Rinse completed
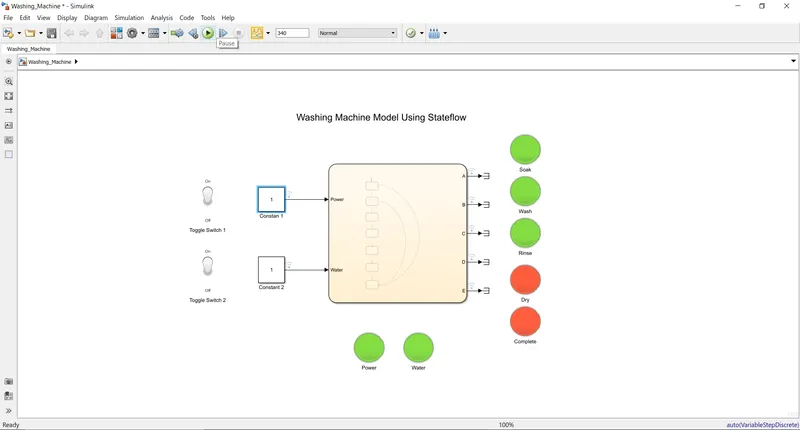
Case-7: Power on, Water supply on, All process completed
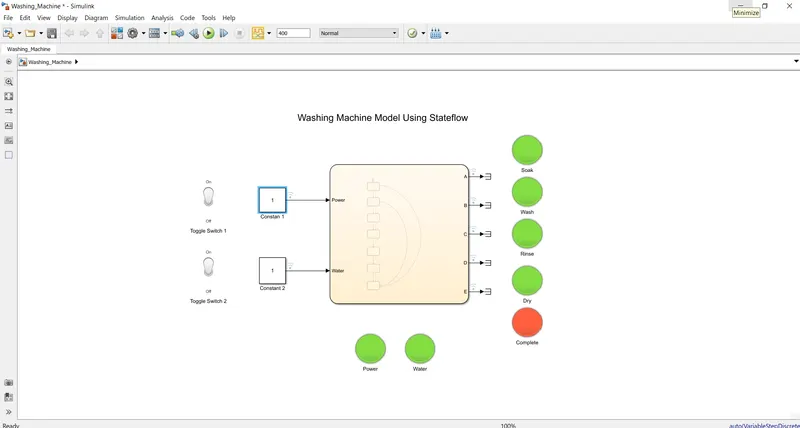
Block Used in Model:
- Constant- The Constant block generates a real or complex constant value.
- Chart- The Simulink chart is used to implement control logic with a finite state machine.
- Lamp- The Lamp block displays a color indicating the value of the input signal.
- Toggle Switch- The Toggle Switch block toggles the value of the connected block parameter between two values during simulation.
- Terminator- Terminator block is used to cap blocks whose output ports do not connect to other blocks.
Model Explanation:
The image below is the chart of the model conditions:
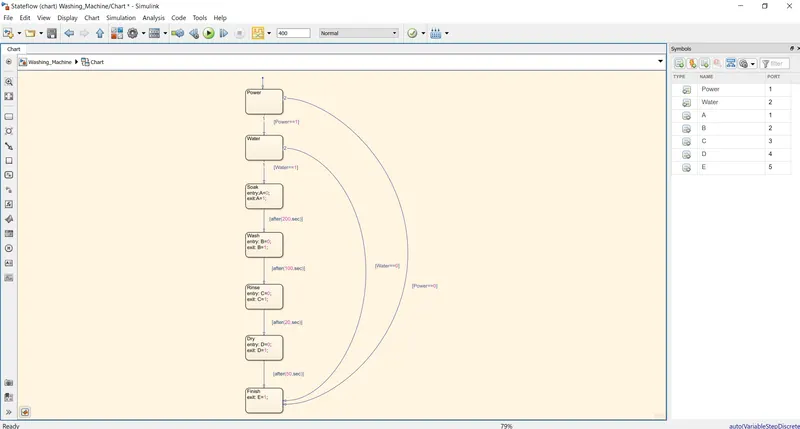
The variables Power and Water (inputs) are connected to toggle switches named toggle switch 1 and toggle switch 2. The chart is prepared as per the given conditions. Variables A, B, C, D, and E are the outputs for soak, wash, rinse, dry, and complete respectively.
- If there is no power then the cycle will end and all the LED will show in red colour.
- If power is on but the water supply is off then the cycle will end. Power LED will show green colour and rest will show red colour.
- If power and water both are available then the cycle goes through all the process. Firstly, it will go for soak, then wash, then rinse and after that go for dry, and then it will end after completing all processes.
- The soak time entry A=0 and exit A=1 and the processing time is given 200 seconds. After 200 seconds it will go to the next process which is wash, where entry B=0 and exit B=1 and time is 100 sec.
- The rinse time entry C=0 and exit C=1 and the processing time is given 20 seconds. After that, it will go to the next process which is dry, where entry D=0 and exit D=1.
- After all the processes, the cycle will end where the exit E=1.
------------------------------------------------------------------------------------------------------------------------ END of Solution for Objective- 1 ------------------------------------------------------------------------------------------------------------------------------------------
Solution of Objective-2:
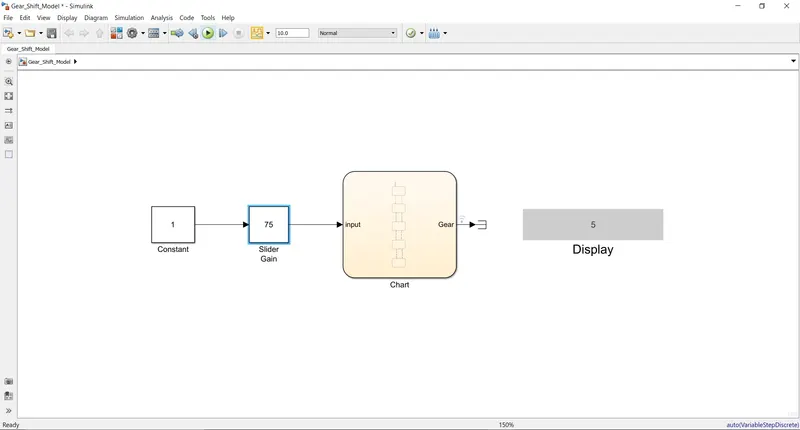
Simulink Model of Gear Shift Model:
Case-1: When Speed range from 0 to 15 Km/hr
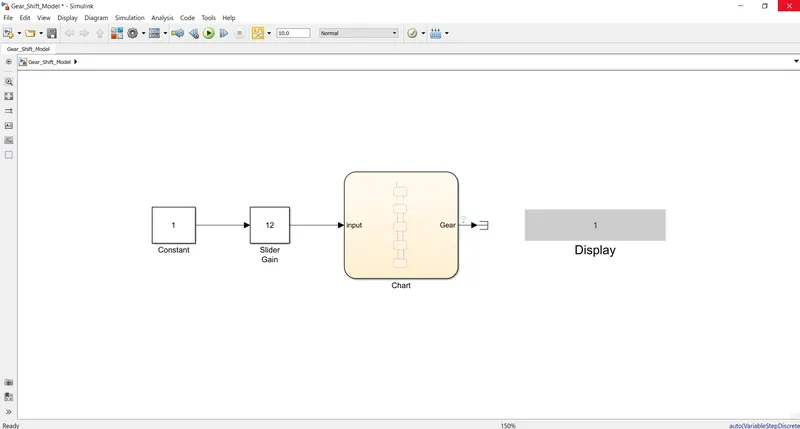
Case-2: When Speed range from 16 to 25 Km/hr
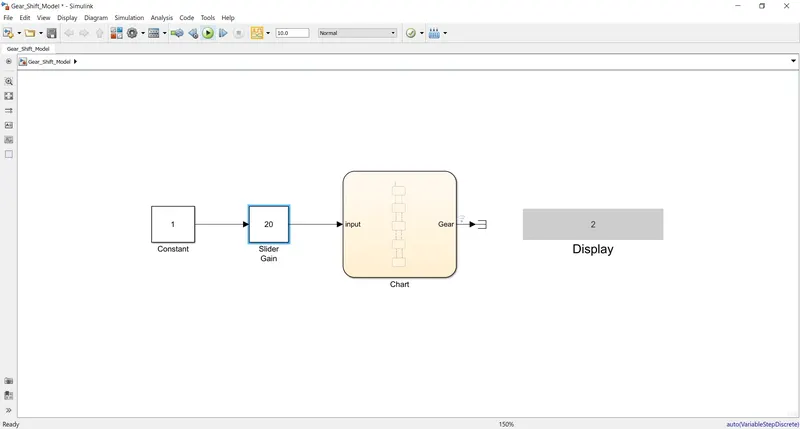
Case-3: When Speed range from 26 to 40 Km/hr
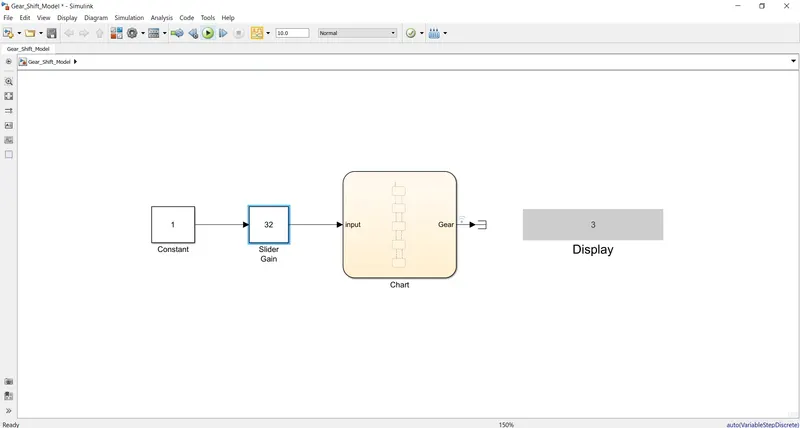
Case-4: When Speed range from 41 to 60 Km/hr
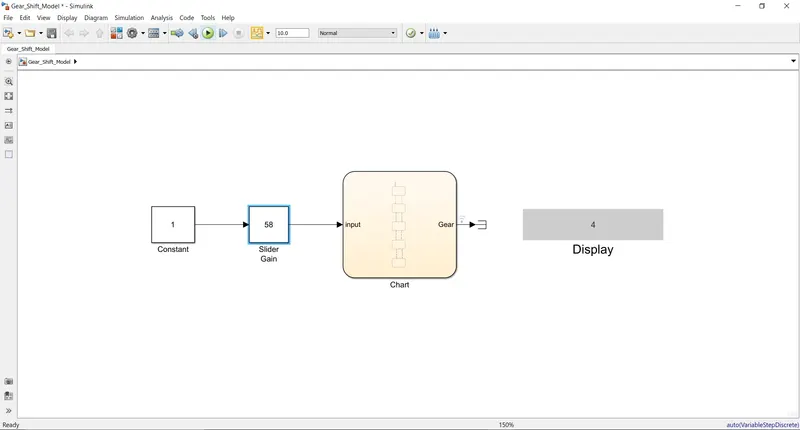
Case-5: When Speed range above 61 Km/hr
Block Used in Model:
- Constant- The Constant block generates a real or complex constant value.
- Slider Dain- The Slider Gain block performs a scalar gain that you can modify during simulation. Modify the gain using the slider parameter.
- Terminator- Terminator block is used to cap blocks whose output ports do not connect to other blocks.
- Chart- The Simulink chart is used to implement control logic with a finite state machine.
- Display- The Display block connects to a signal in your model and displays its value during simulation.
Model Explanation:
The image below is the chart of the model conditions:
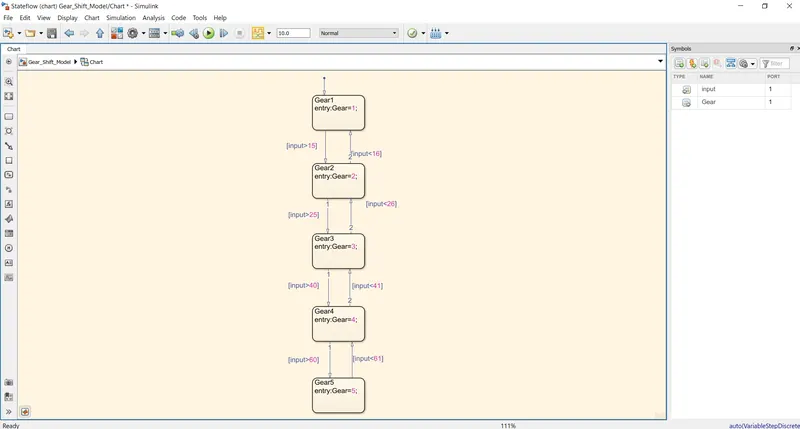
In this model, the slider gain is used to provide the input to the chart. The input is in the form of speed. The chart is prepared according to the given conditions.
------------------------------------------------------------------------------------------------------------------------ END of Solution for Objective- 2 ------------------------------------------------------------------------------------------------------------------------------------------