Week - 4
AIM - 1) To Implement control logic of a “washing machine” using Stateflow as per given sequence
2) To make a simulink chart for the Gear shift logic as per the conditions
OBJECIVES - 1) To implement control logic of a “washing machine” using Stateflow as per given sequence
- If the power supply is available, the system gets activated
- If the Water supply is not available, stop the process & indicate through LED
- Soaking time should be 200s followed by Washing time of 100s.
- Then rinsing happens for next 20s & dryer runs for 50s
- After all the processes have completed turn on the finished LED
2) To make a simulink chart for the “Gear shift” logic as per below conditions:
Speed Range(kmph) Gear
0 to 15 1
16 to 25 2
26 to 40 3
41 to 60 4
Above 61 5
Give speed input while the simulation is running & display the gear number.
PROCEDURE - For the first part - for implementing the control logic of a washing machine i will use the chart block from the simulink library.
- so first i will get all the blocks that i require in the operation such as chart, a constant block, display block and lamp for indicating the proceses
- In the chart as per the given conditions if the power supply is available the system gets activated so here the constant block is used for giving the inputs and the input will be greater than 0 for running the system and it will be 0 if we want to stop the system.
- here another input b is used because i want to show the condition of water supply so for here also the constant block is used to indicate on and off condition
- The flow chart for the process is mentioned below:
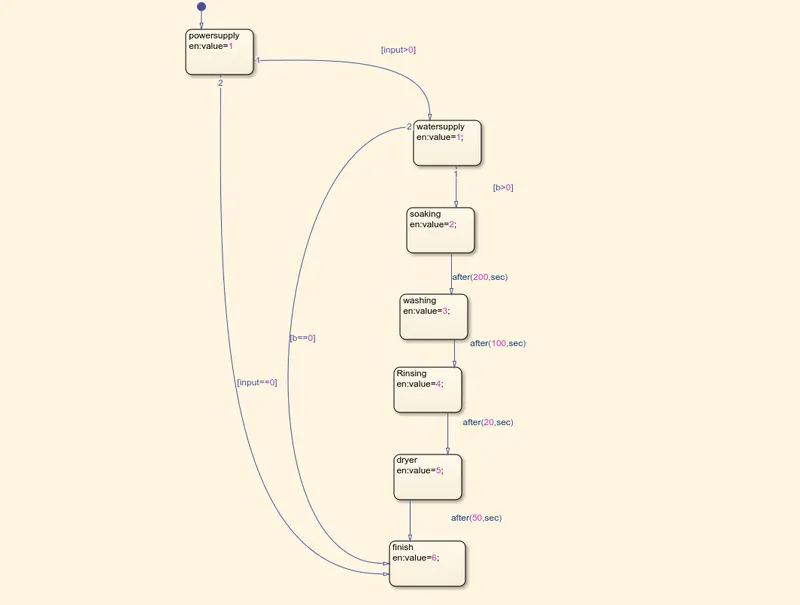
- here "after" is used because i want to show the delay that is given in the condition
The simulink model for the process is shown below
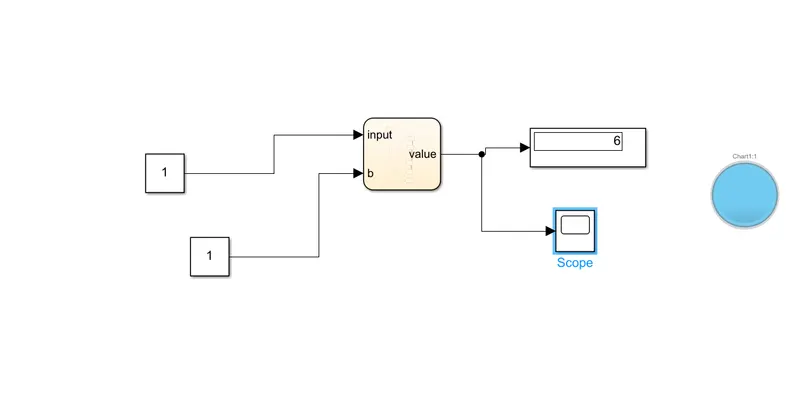
- in the above shown process, display is used to show the output that is after like a specific running time what process is completed
- lamp is used as a led to show the colour of the process completed.
- Finally i have used scope to show the plot
Here i have used numerical values to display the individual processes and they are
2 shows that soaking process is completed
3 shows that washing process is completed
4 shows that rinsing process is completed
5 shows that drying process is completed
6 shows that either the whole operation is completed or it is stopped depends on the input
- First i have run the simulation for 201s and following are the observation
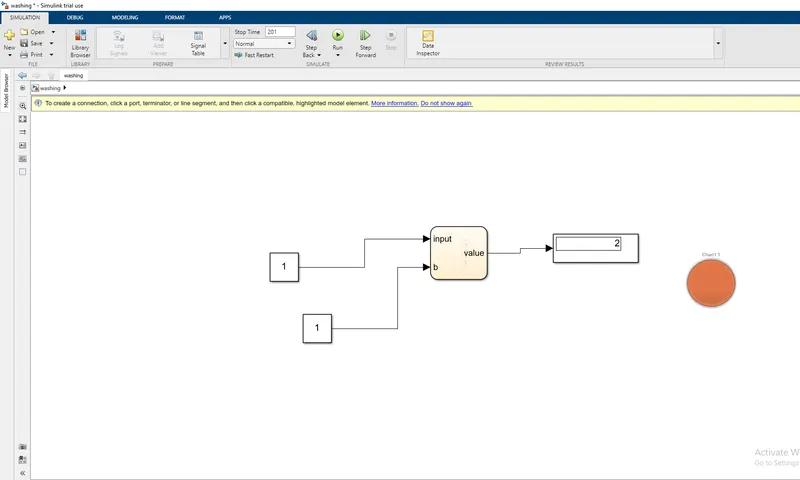
- the above fig. shows that saoking process is completed
- now if i increase the run time to say 301s the following will be displayed
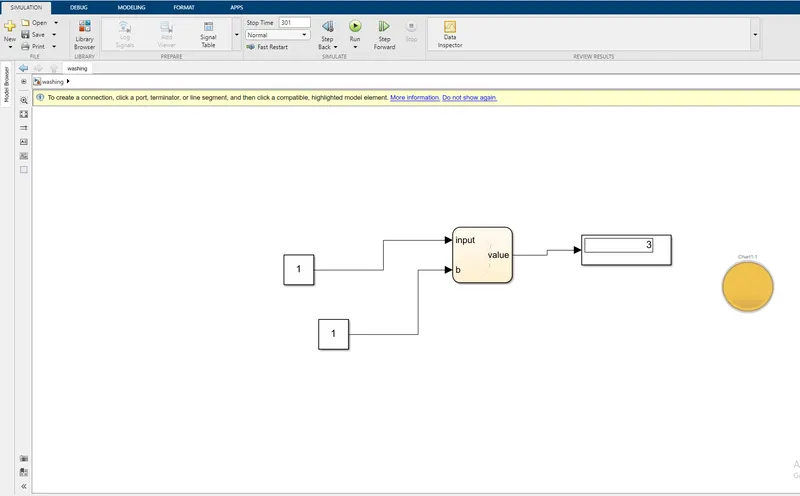
- the above fig. shows that washing process is completed
- now again if i increase the run time say to 321s the following will be displayed
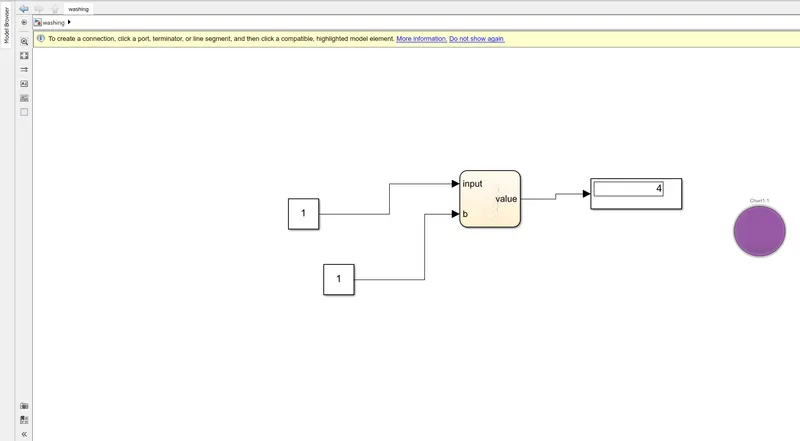
- the above fig shows that rinsing process is completed
- now aagin if i increase the run time to 371s the following will be displayed
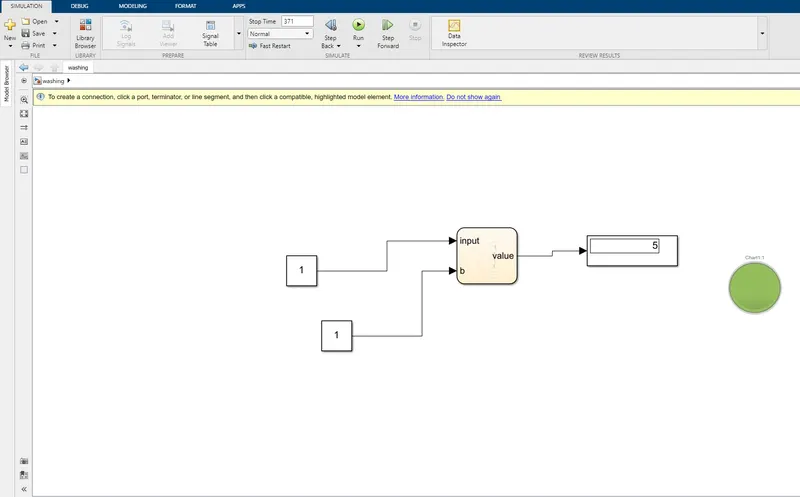
- the above fig. shows that drying process is completed
- now finally if i run the simulation for say 400s the following will be displayed
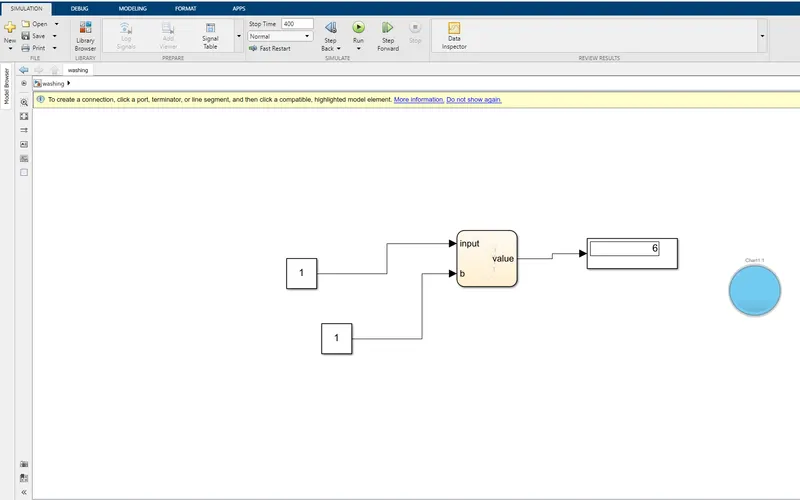
- the above fig shows that the whole process is completed.
For the second part - For the simulink chart of gear shift logic i will agin use the state flow
- so first i will get all the blocks from the simulink library browser that i require in simultion which are chart block,slider gain block,constant block,display,circular guage and lamp block
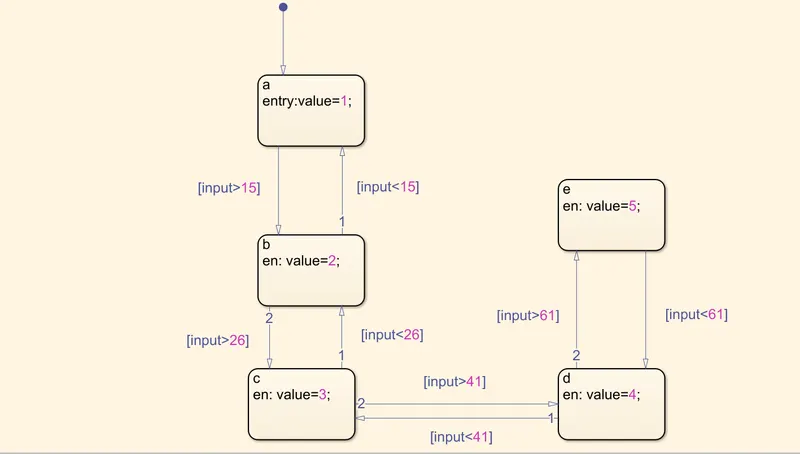
- first i have to create the state flow acc. to the conditions that are given to me and those are
- when the speed range is between 0 to 15kmph the output should be gear 1
- when the range is between 16 to 25kmph the output should be gear 2
- when the range is between 26 to 40 kmph the output should be gear 3
- when the range is between 41 to 60kmph the output should be gear 4
- Finally when the speed is above 61 the output should be gear 5
the state flow chart for gear shift is mentioned below
- the simulink model for the gear shift is mentioned below
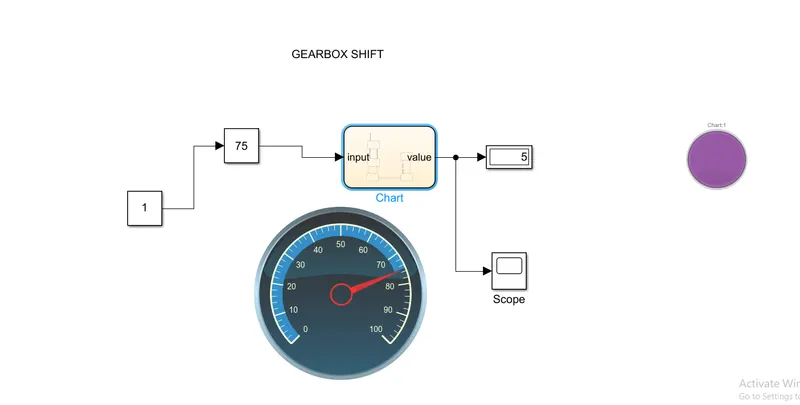
- here the slider gain is used to increase the speed during the simulation of model
- the ouput is connected a display block which will desplay the gear number
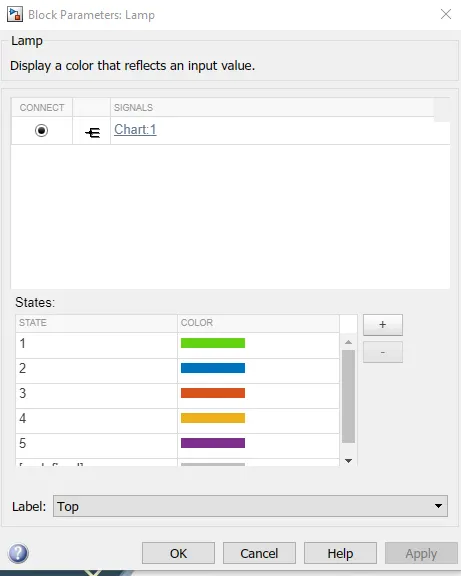
- lamp is used to specify individual gear with their specific colour
- a circular guage is also used just to indicate the speed given as the input.
- the lamp parameters are mentioned below
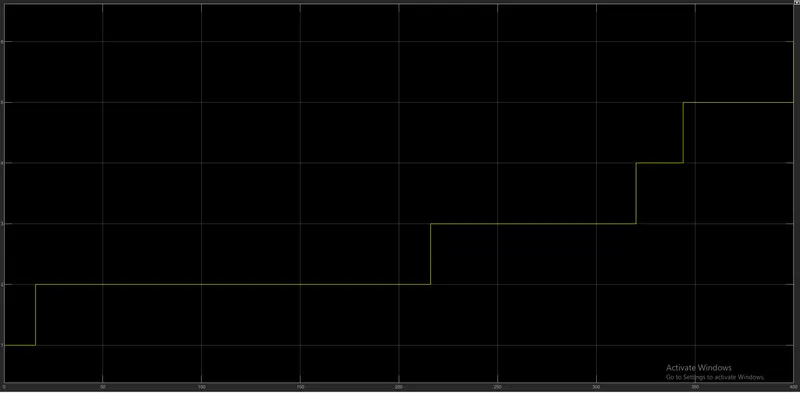
RESULTS - 1) The plot of the complete system observed when the simulation is completed is shown below
but when the water supply is not provided then the simulation looked it following
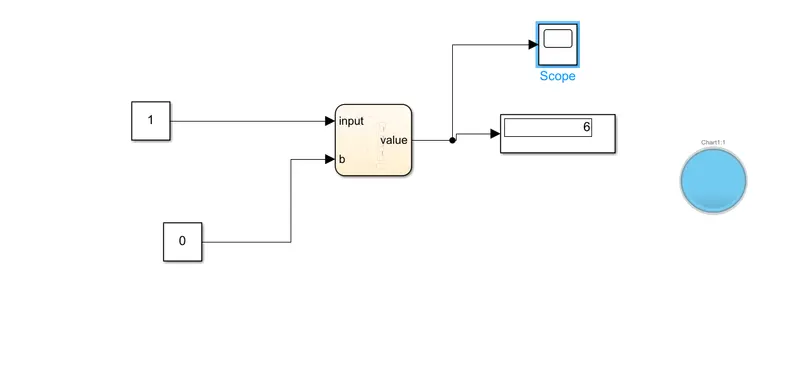
in the above fig. b indicates the water supply input here in the display it is showing 6 that means the process is stopped
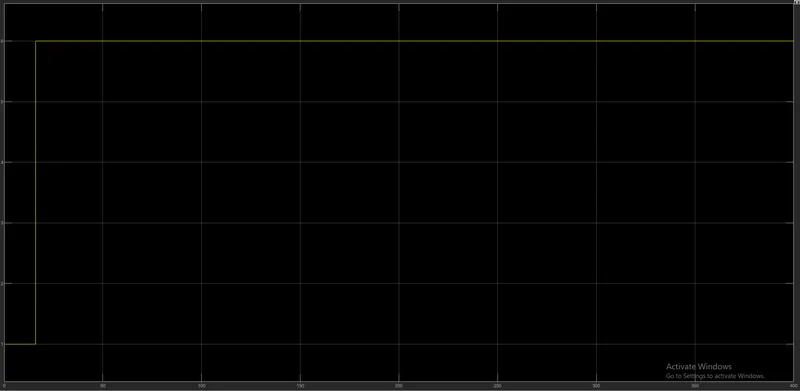
the plot is also shown below for this particular condition
2) For the gear shift simulation
- first the speed is kept below 15 following output is observed
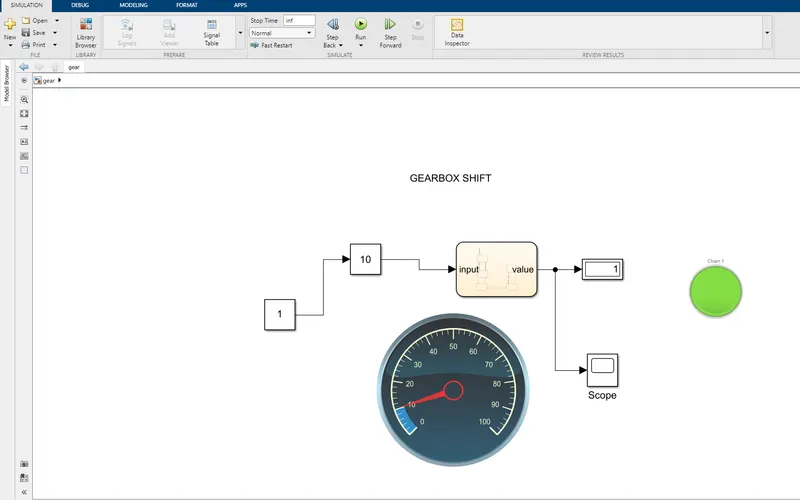
- in the above fig 1 display the gear number and green colour denotes the colour for gear 1
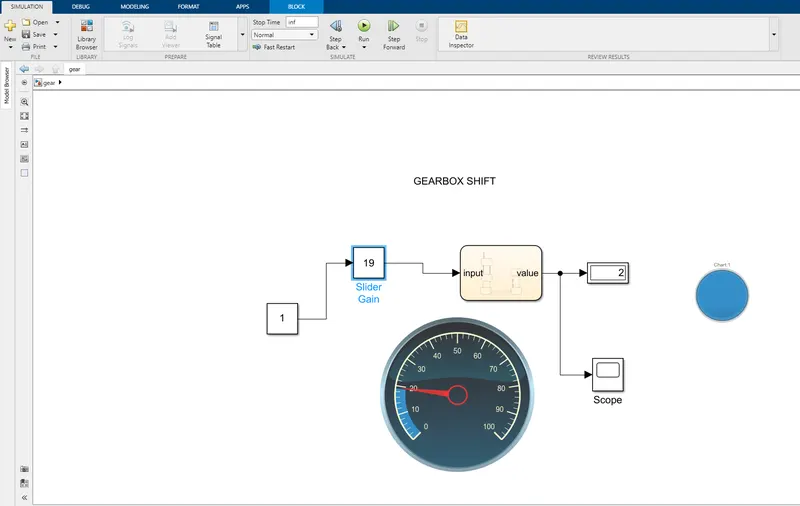
- now if the speed is below 26kmph the following output is observed
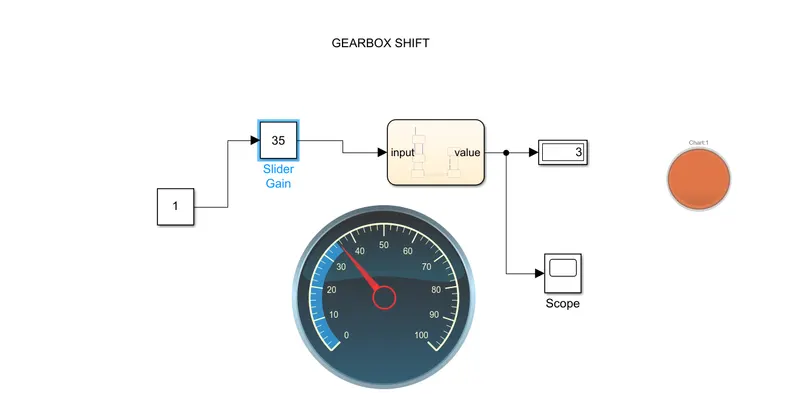
- now the speed is say below 40kmph the following output is observed
- now the speed is below 60kmph the following output is observed
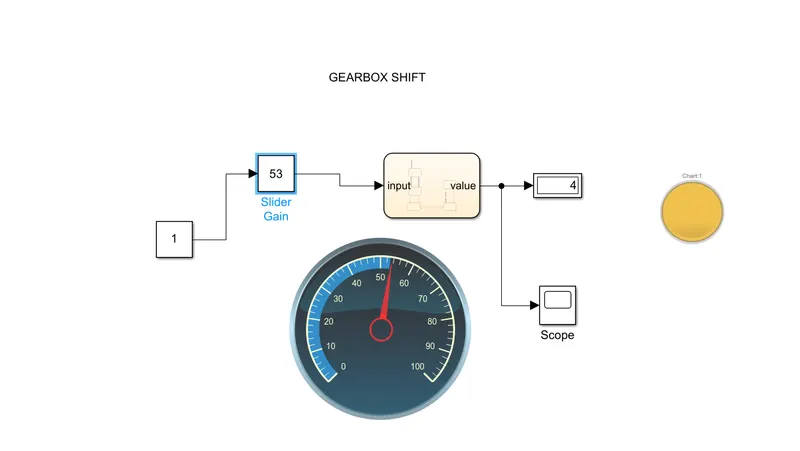
- now finally if the speed is above 61 kmph the following output is observed
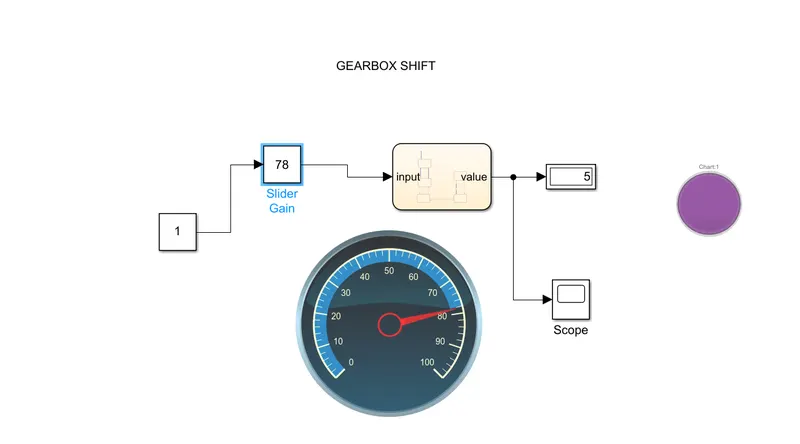
- in the aboove fig the display shows the gear is 5 and purple colour is assigned for gear 5
CONCLUSION - The implementation of control logic of a washing machine has been done successfully and the results are displayed and plotted.
The simulation of gearshift logic has been done successfully and the results are displayed.