Week 4.1: Project - Steady state simulation of flow over a throttle body
Aim:
- Set up and run the steady state simulation for flow over throttle body.
- Post process the results and show pressure and velocity contours.
- Show the mesh (i.e surface with edges)
- Show the plots for pressure, velocity, mass flow rate and total cell count.
- Create an animation in which it throttle movement should be visible.
Throttle valve:
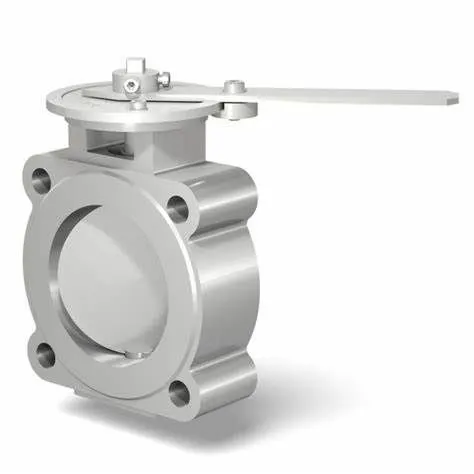
- A throttle valve is a type of valve that can start, stop, and regulate the flow of fluid from one point to another. Generally, there is a large pressure difference between the upstream and downstream sides of the throttle valve. As the throttle valve flow restriction increases, the pressure loss increases.
- Especially it is the valve in an internal-combustion engine incorporated in or just outside the carburetor and controlling the volume of vaporized fuel charge delivered to the cylinders
- In throttle valves, an obstacle is created inside the valve so that parameters such as flow rate, temperature and pressure are available as desired. Flow is subject to designed restrictions and friction that occur during flow. In general, raise or lower the valve stem to adjust the size of the flow path through the valve. You can also completely close the valve to stop the flow.
Procedure:
- Import the throttle geometry model in the converge using the create option.
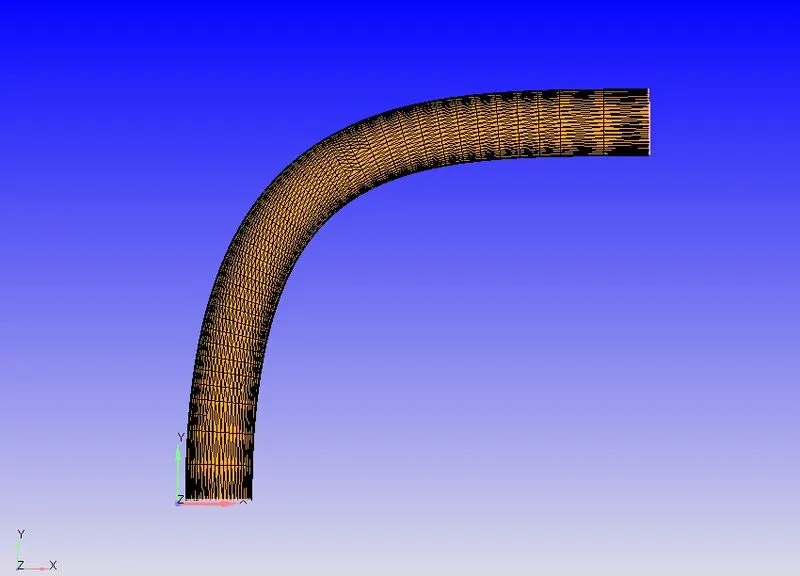
- Perform Geometry cleanup.
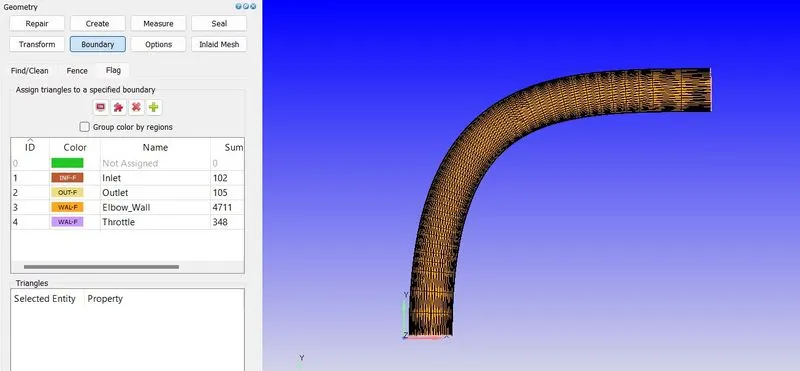
- Define the boundary to each surface of the geometry.
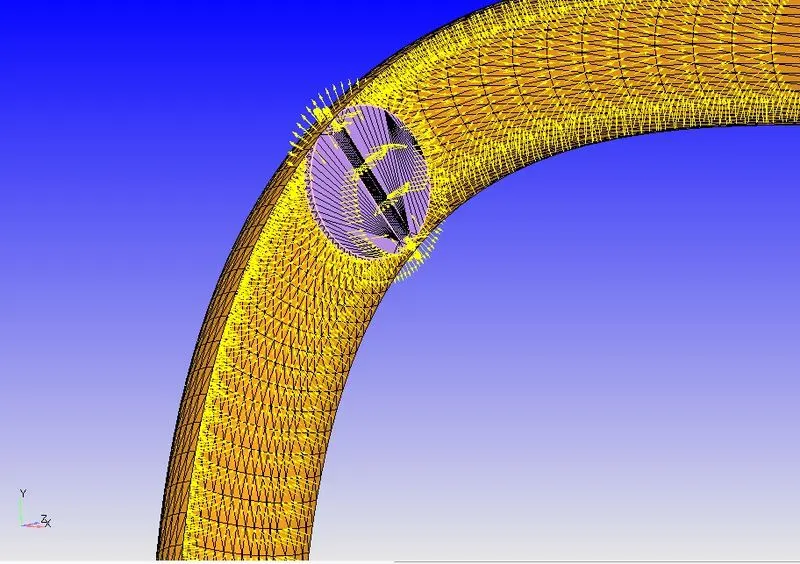
- Set normal direction on the inward side of the surfaces. means, define the direction towards the volume where the fluid is present.
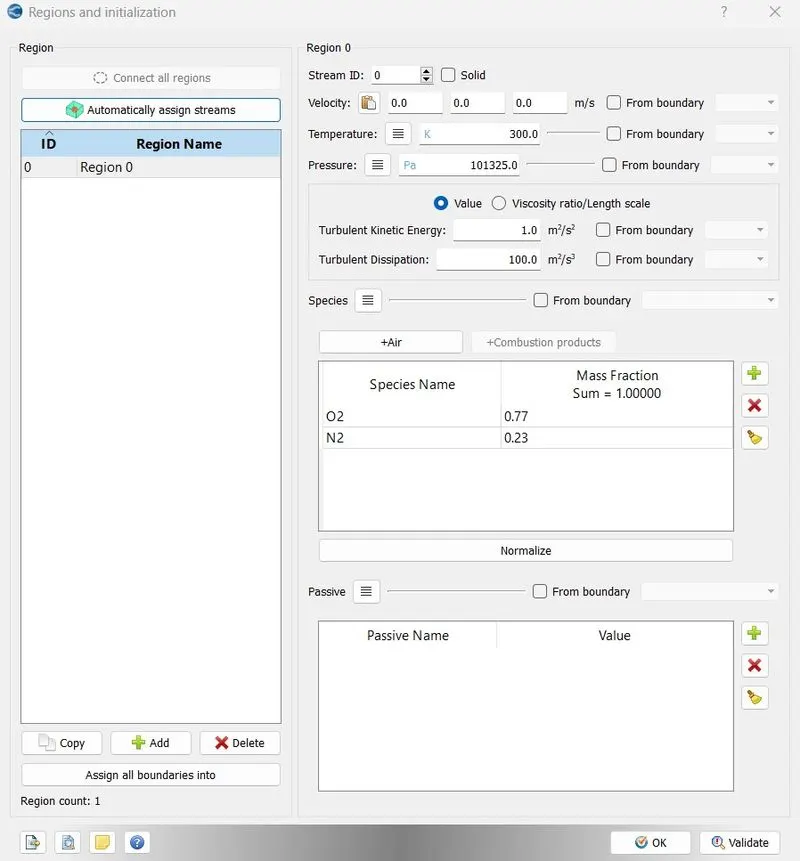
- In case of setup define the material, simulation parameters, fluid region, boundary condition, no of cycles, grid definition.
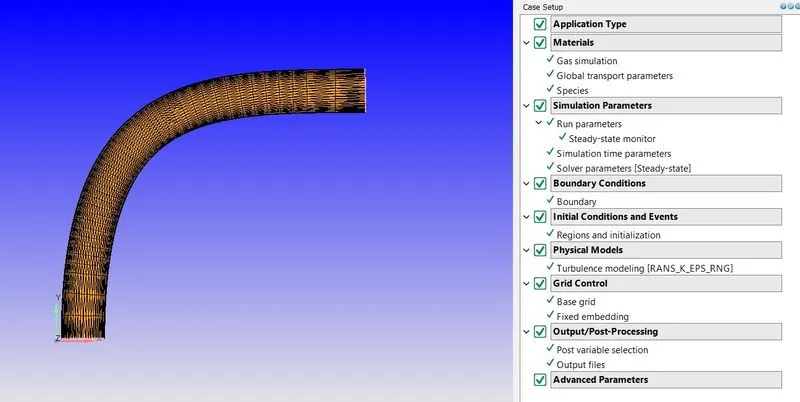
Species:
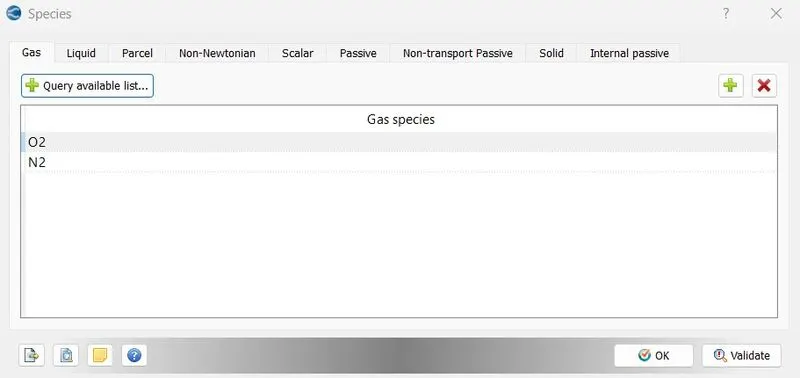
Run parameters:
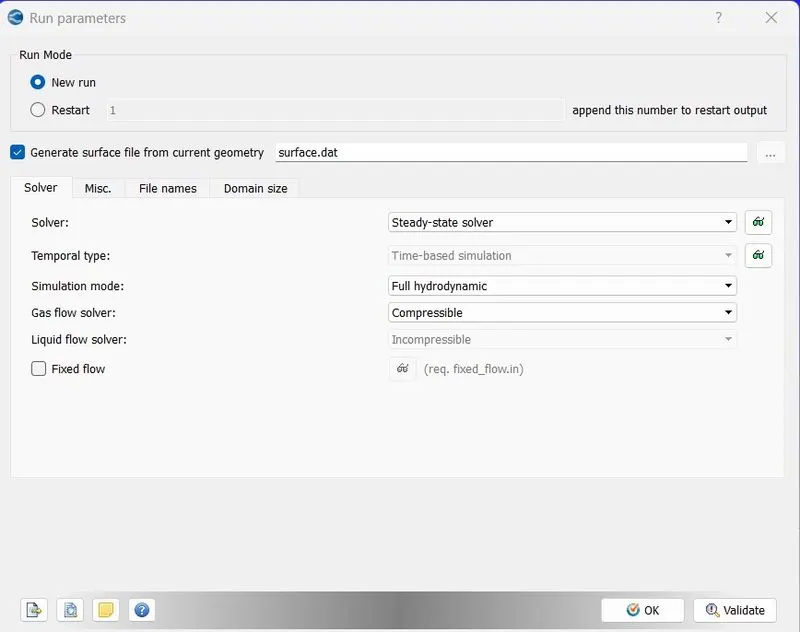
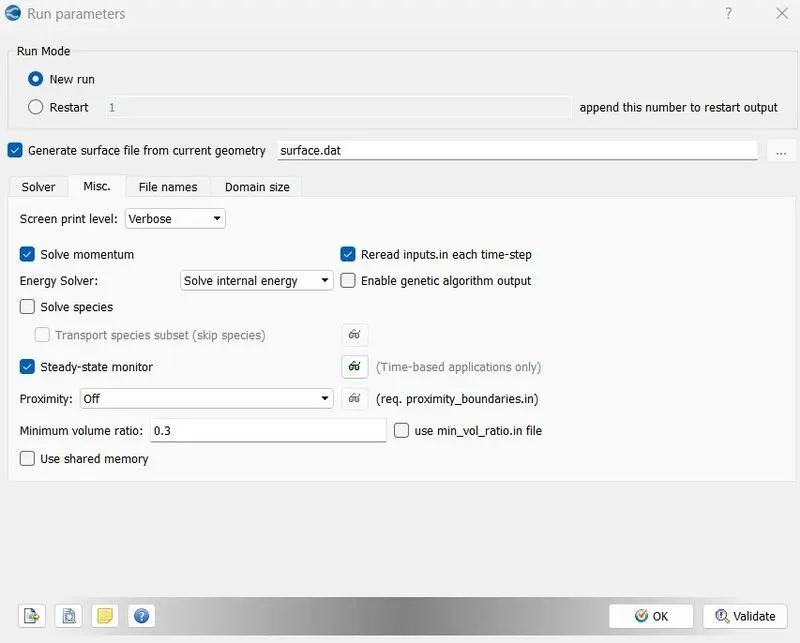
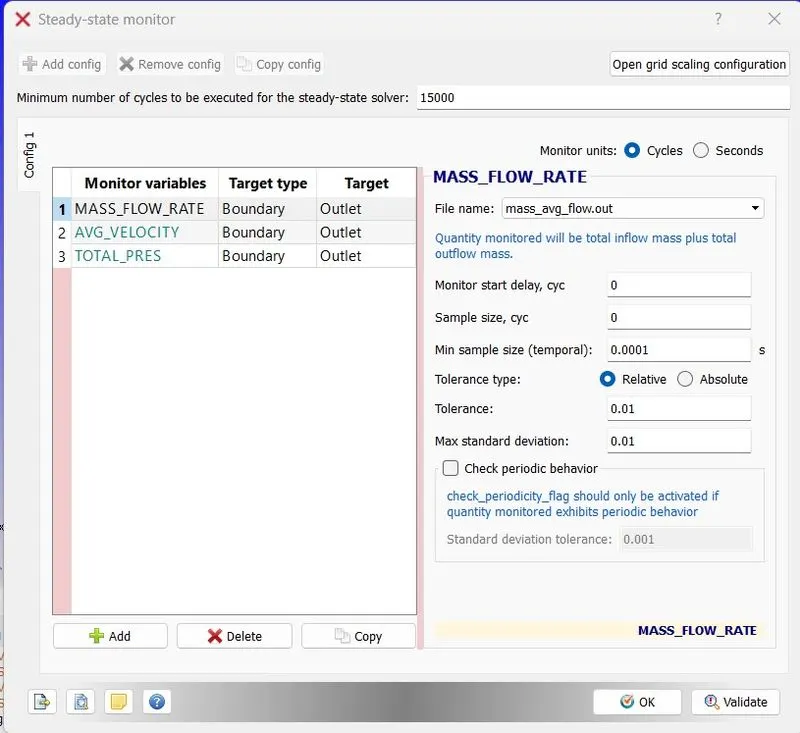
Steady-State Monitor:
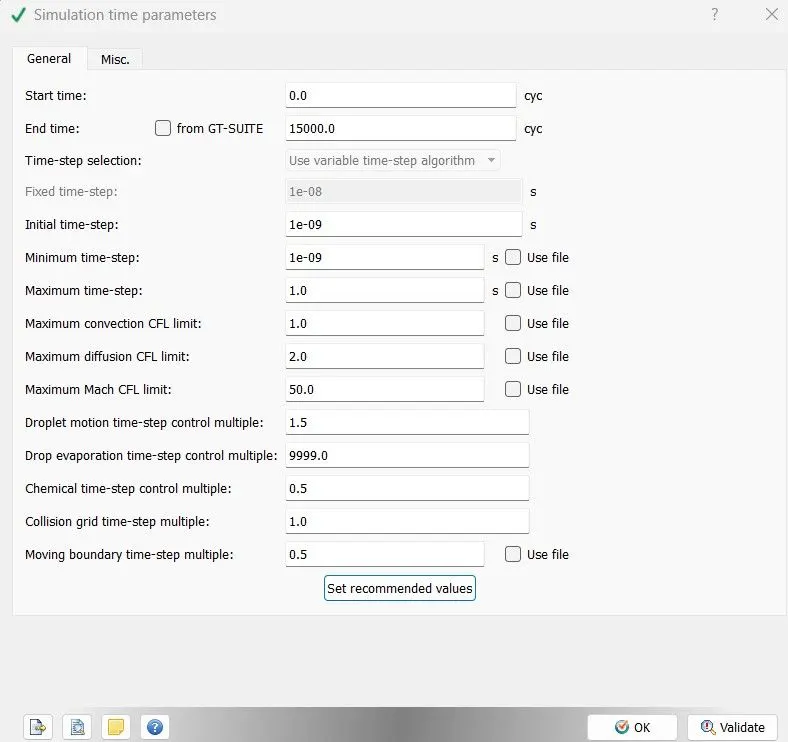
Simulation Time Parameters:
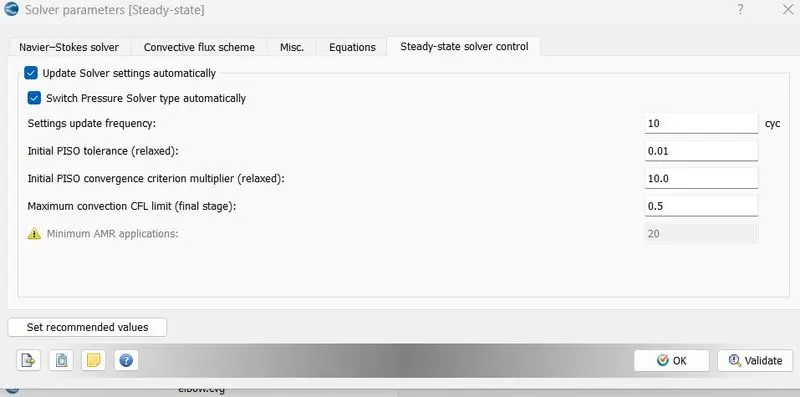
Solver parameter:
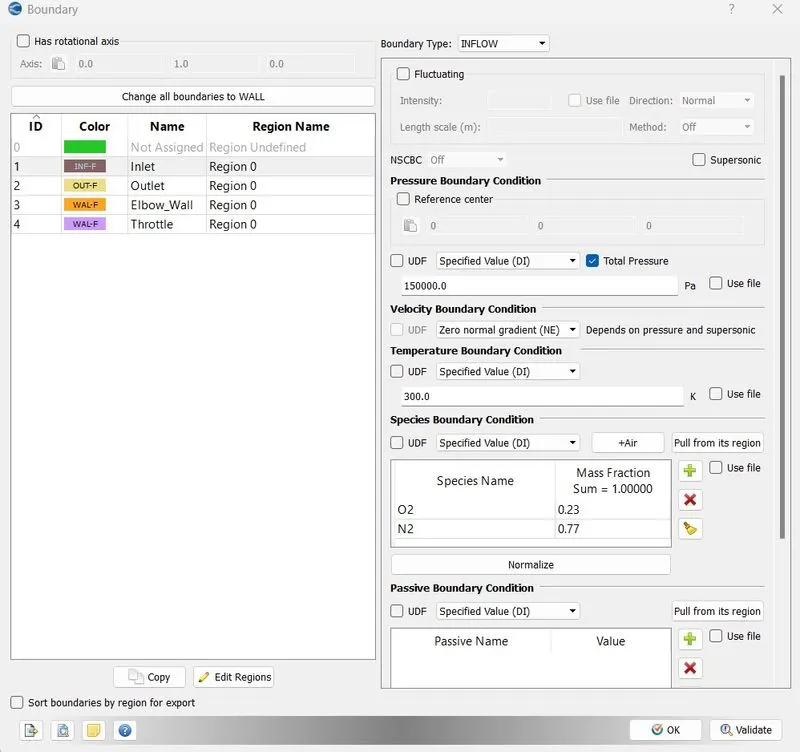
Boundary conditions:
Inlet:
Outlet:
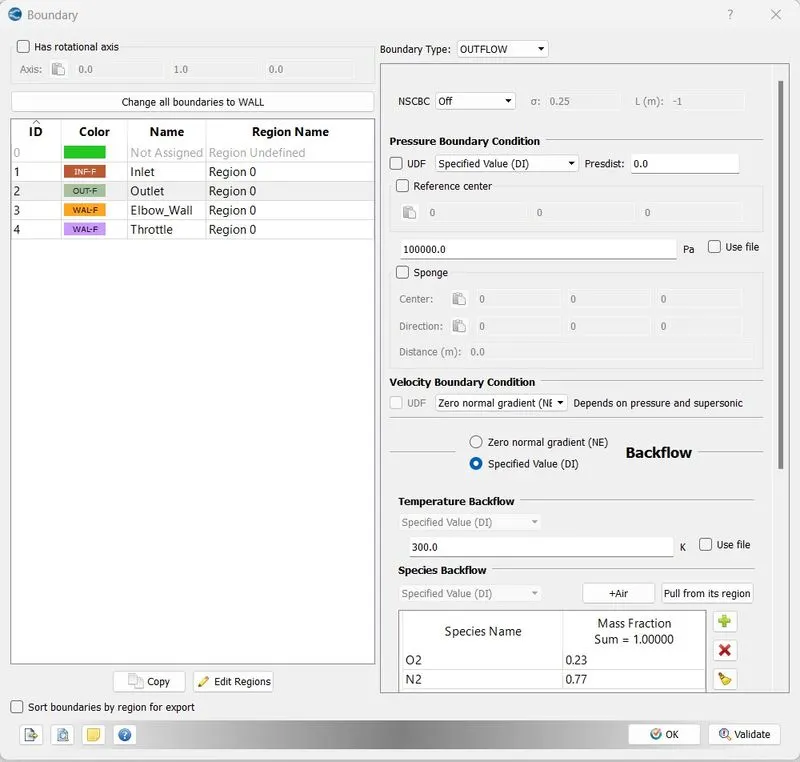
Elbow-Walls:
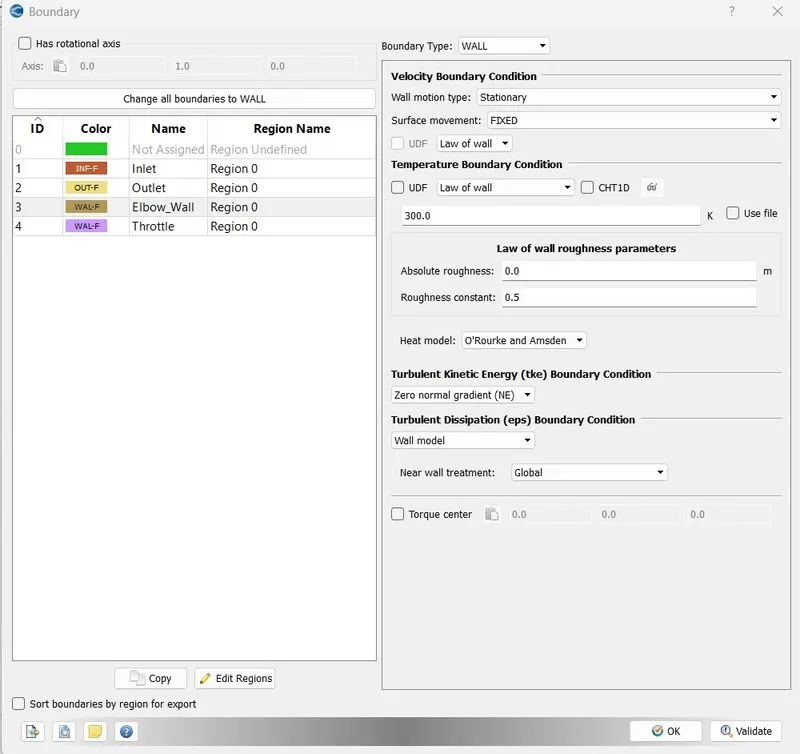
Throttle:
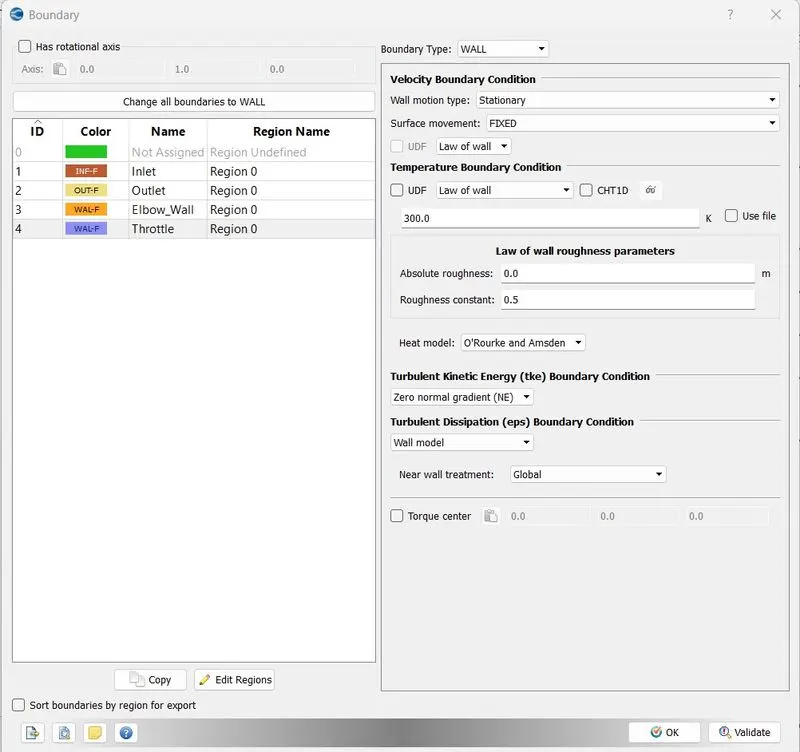
Regions:
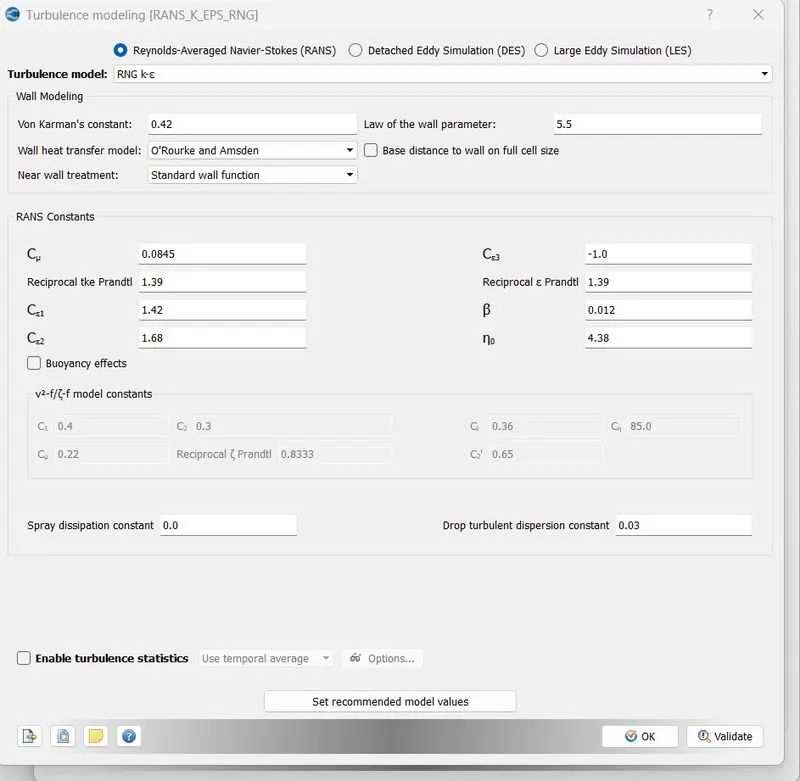
Turbulence Modeling[RANS_K_EPS_RNG]:
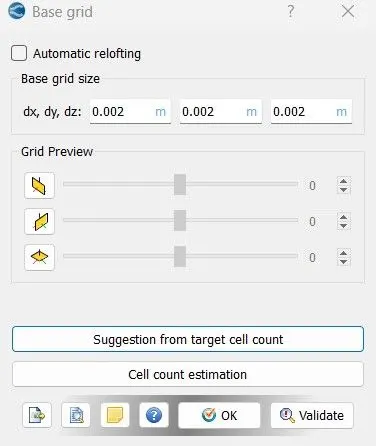
Base grid:
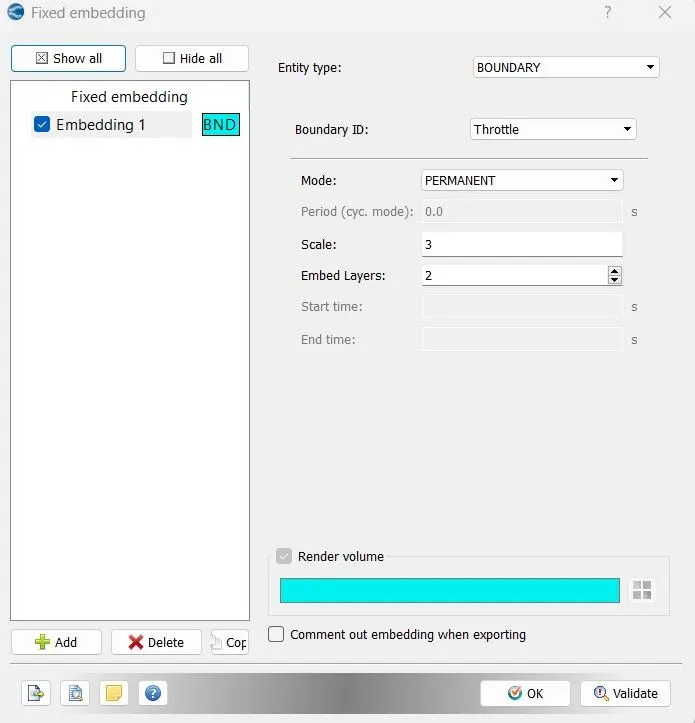
Fixed Embedding:
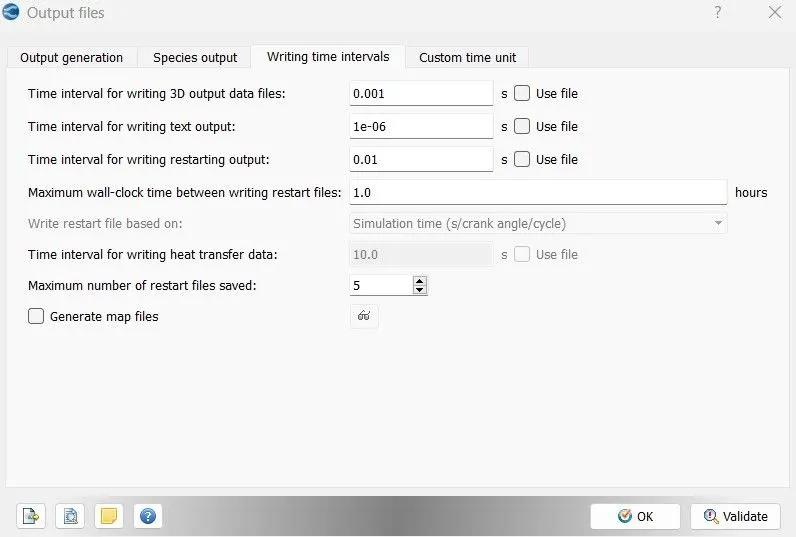
Outputs:
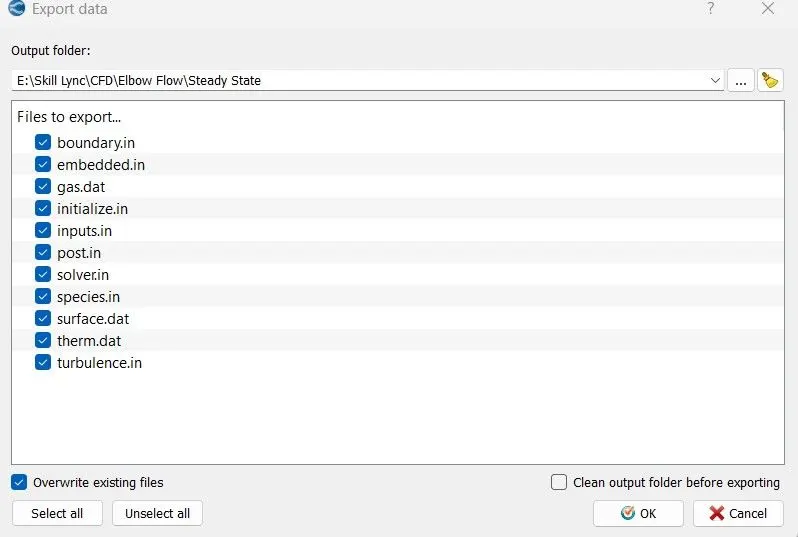
- Extract the setup files in the simulation folder.
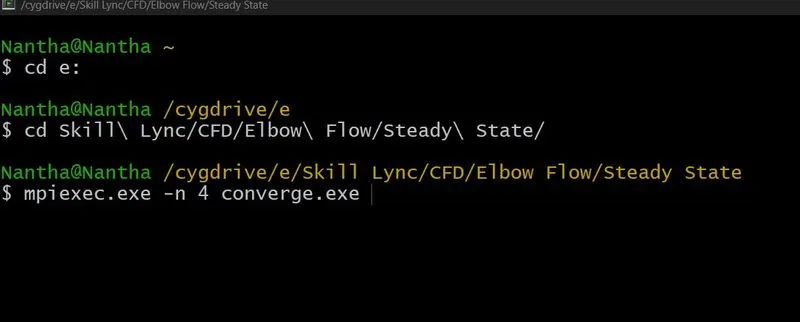
- Run exported input setup files in Cygwin.
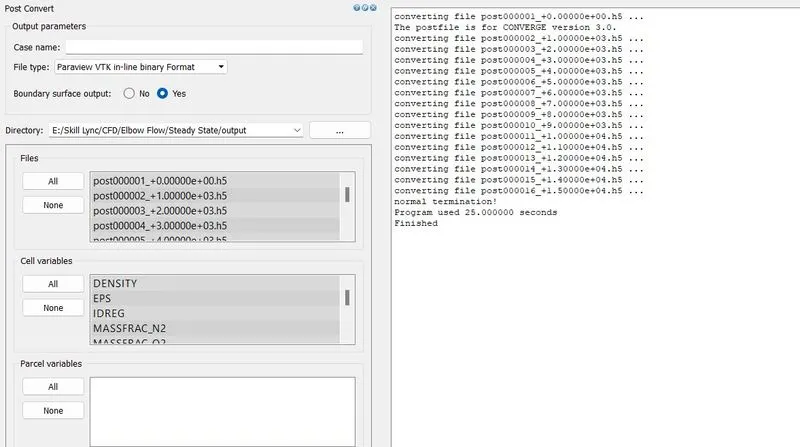
- Post-process all the results into 3D outputs and open in Paraview.
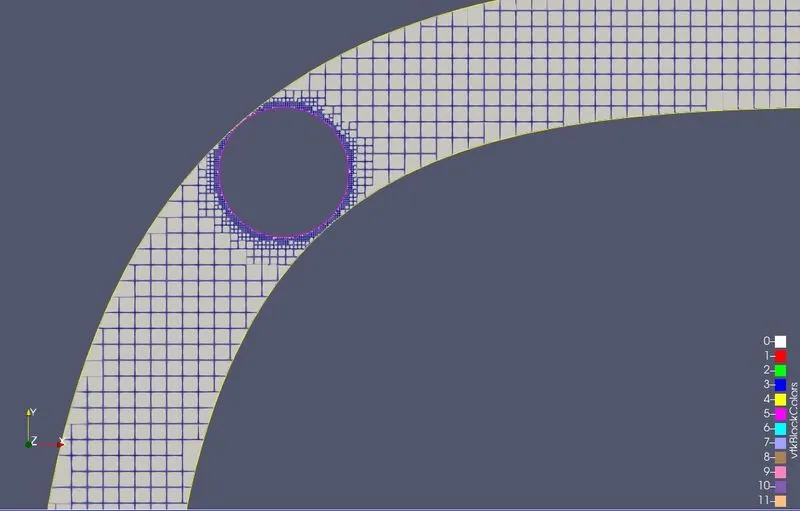
- Show mesh generation on the 2D mid surface by using the slice command from the Paraview.
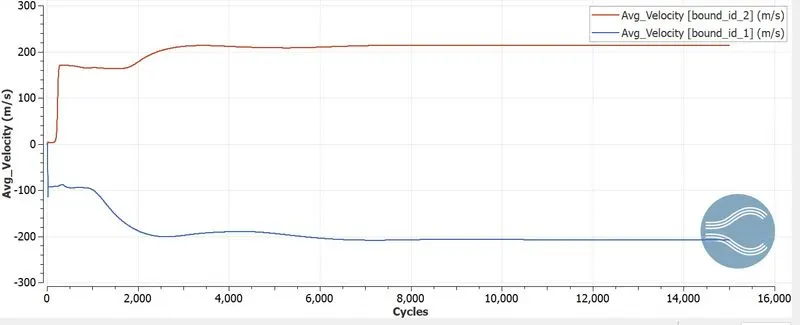
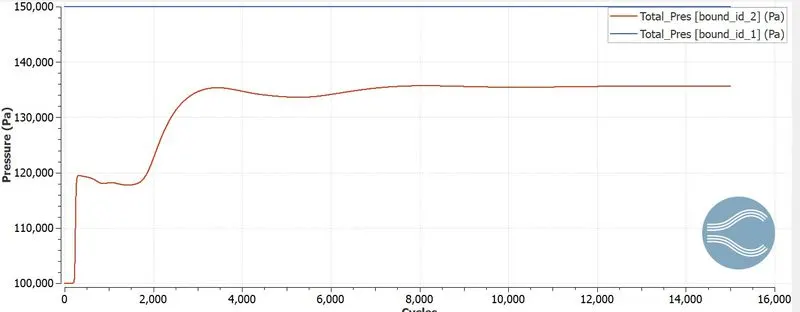
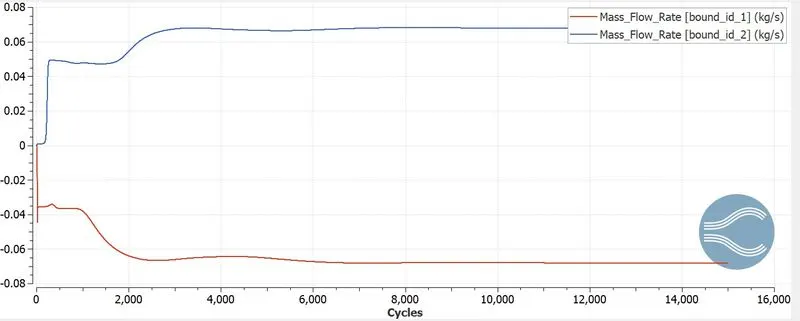
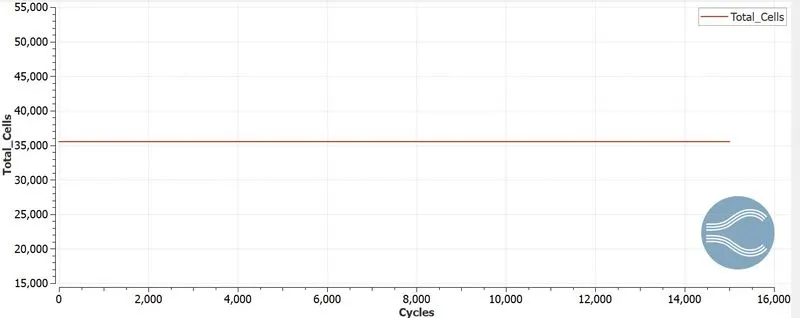
- Plot converge plot for velocity, pressure, mass flow rate, and total cell count.
Velocity:
Pressure:
Mass Flow Rate:
Total Cell Counts:
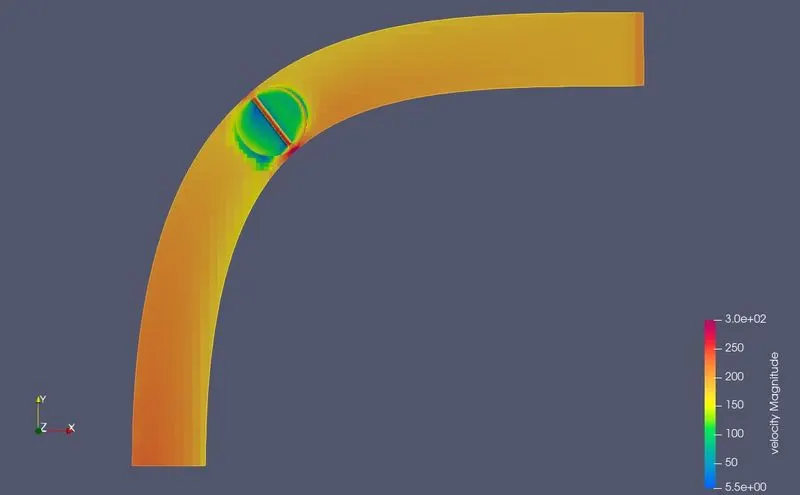
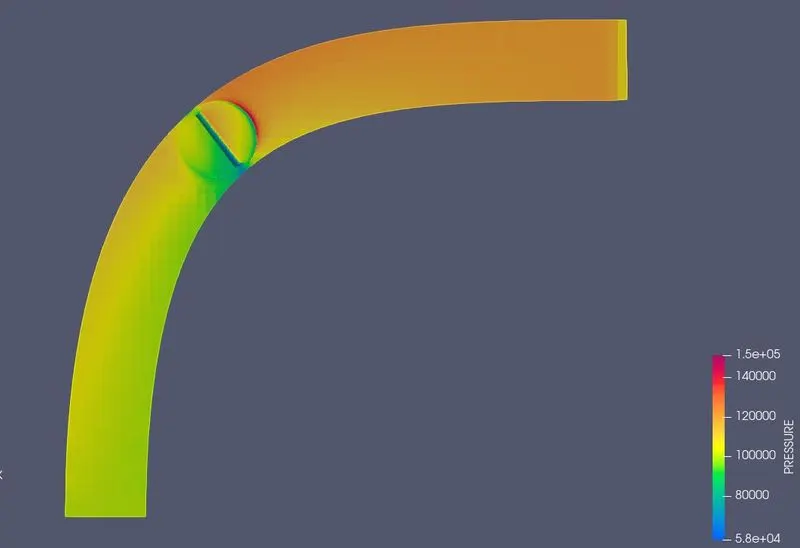
- Plot velocity and pressure contour over the sliced surface.
Velocity Contour:
Pressure contour:
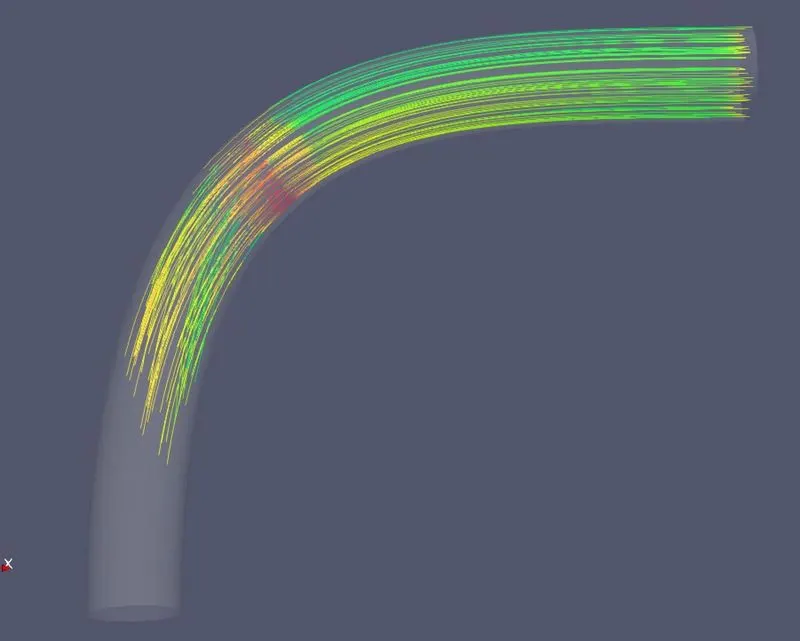
Veocity streamline:
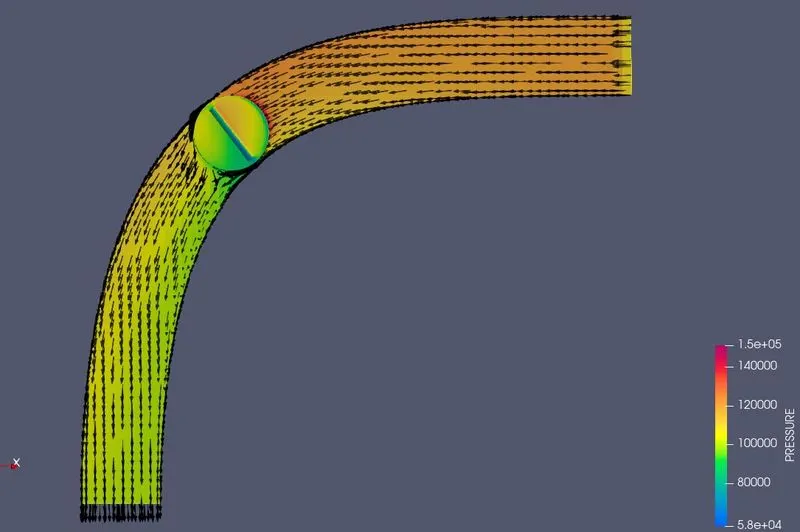
Velocity Vector:
- Create animation in the Paraview to show the flow over the throttle valve.
Animations:
Velocity:
Pressure:
Velocity Streamline: