Week 4.1: Project Steady state simulation of flow over a throttle body
- Project Steady state simulation of flow over a throttle body.
- Aim - To perform Steady state simulation of flow over a throttle body.
- Objective -Set up a steady-state simulation of flow across the throttle body during convergence.
- Export all input files and run the simulation in Cygwin.
- Contour representation of flow velocity and pressure in an elbow pipe.
- Shows the mesh (that is, the surface with edges) by creating midplanes/cuts along the z direction.
- Convergence charts for velocity, pressure, mass flow rate, and total cell count.
- Describe the plot and write a detailed report on the project.
- Create an animation in Paraview to show the flow through the throttle during the initial stabilization phase.
- Introduction
-
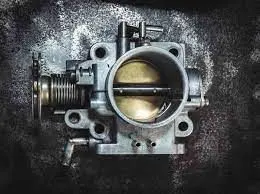
The reason of the throttle frame is to manipulate air consumption to the engine.
-
In a traditional spark ignition fuel engine, the throttle frame is the a part of the air consumption gadget that controls the quantity of air that flows into an engine's combustion chamber.
-
It consists of a housing unit that includes a throttle plate (butterfly valve) that rotates on a shaft.While the accelerator (fuel pedal) is driven down, the throttle plate opens and lets in air into the engine.
-
when the gasoline pedal is launched, the butterfly closes and efficiently chokes off (throttles) air circulate the combustion chamber. This process effectively controls the velocity of the engine and ultimately, the speed of the vehicle.usually located between the air filter and the consumption manifold, the throttle frame consists of the sensitive throttle system which controls a key component of spark ignition: air waft. part of the atomization procedure, airflow enables regulate the air-gas aggregate ratio required to ignite an engine.
- Procedure
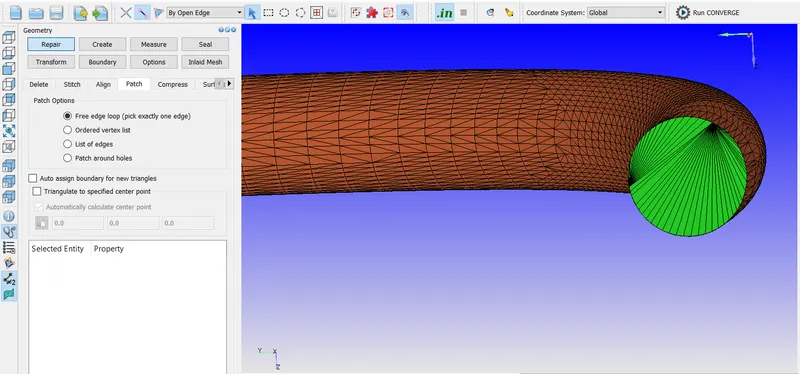
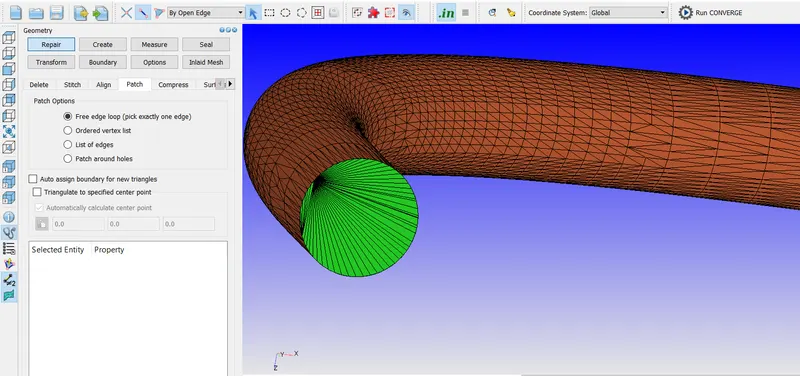
- Geometry cleanup
- Boundary Flagging
- Geometry diagnosis
- Simulation Setup/ Case setup:-
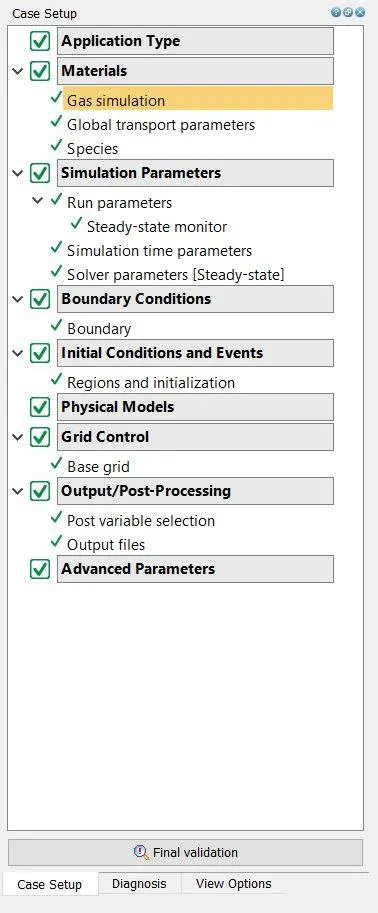
- Go to post variable selection>> select the variables for post processing
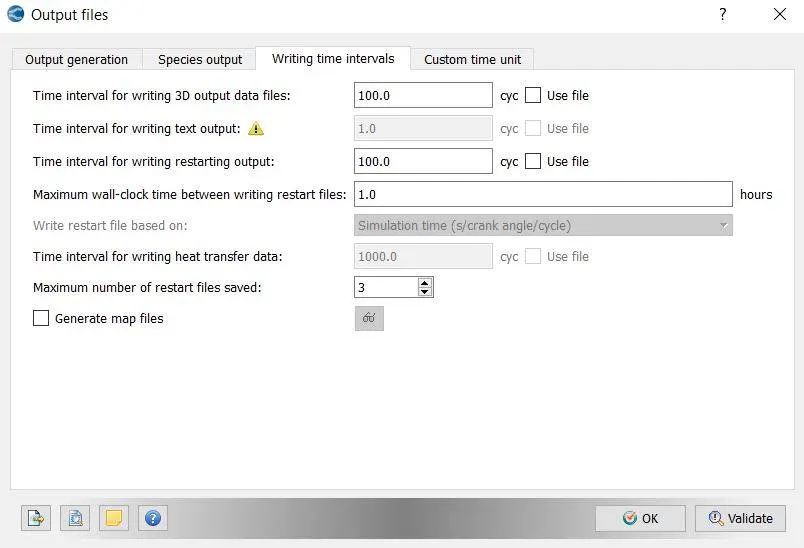
- Go to output files>> provide the no of output files to be dumped.
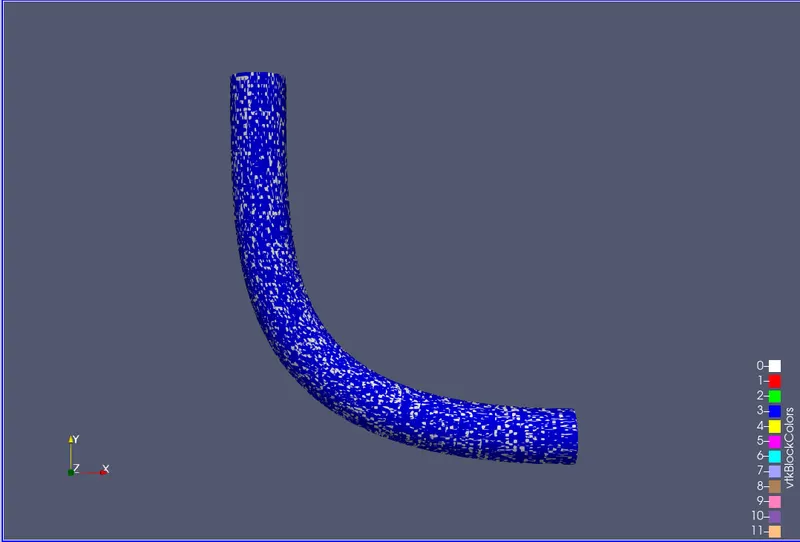
- Steady state simulation results
- Pressure plot
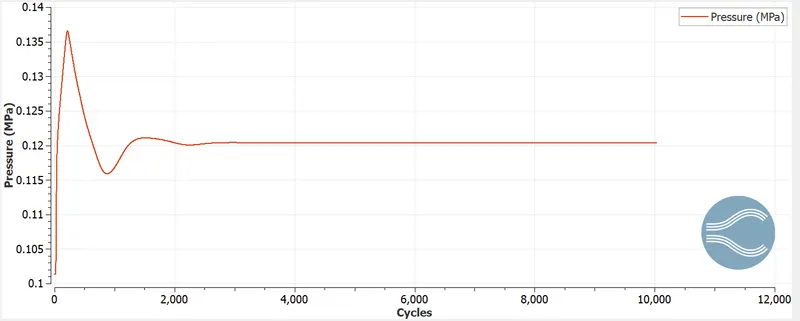
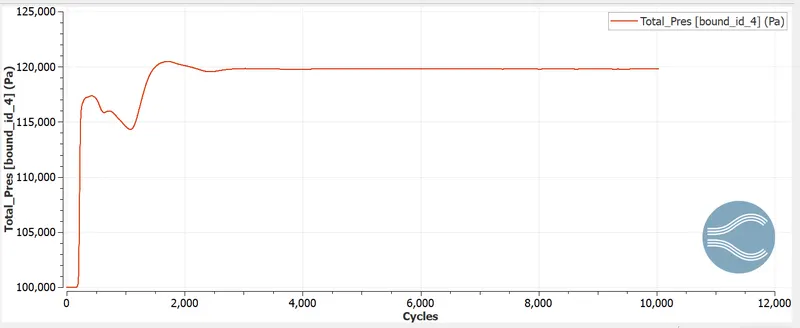
- If we observe pressure charts like velocity ,pressure also slowly giving constant value as cycles move forward.
- Mass flow rate plot at inlet
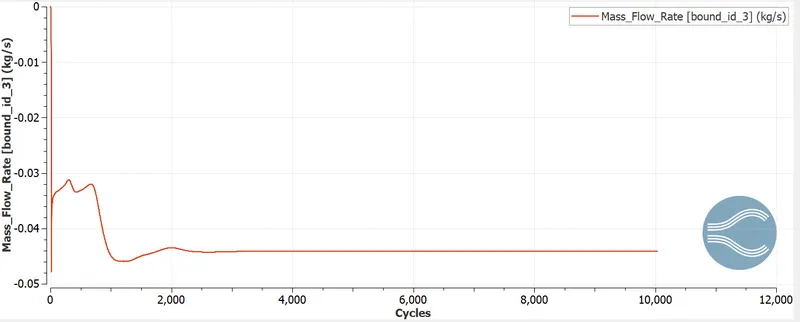
- Mass flow rate at outlet
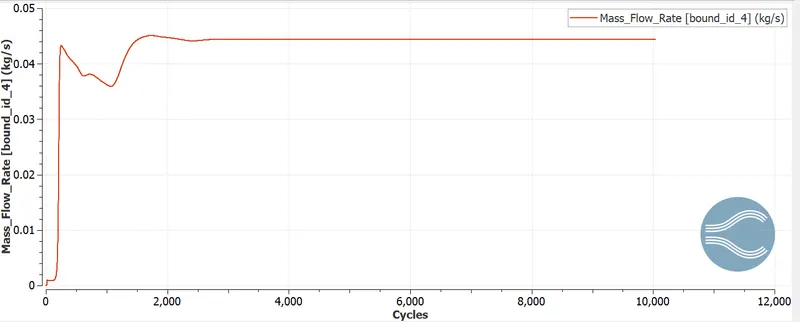
-
The line graph provides the information of mass flow rate at the inlet and the outlet as per the increment rate of simulation cycles. From 1100th cycles the mass flow in and mass flow out giving constant results which means that the results are properly converged.
- Average velocity at inlet
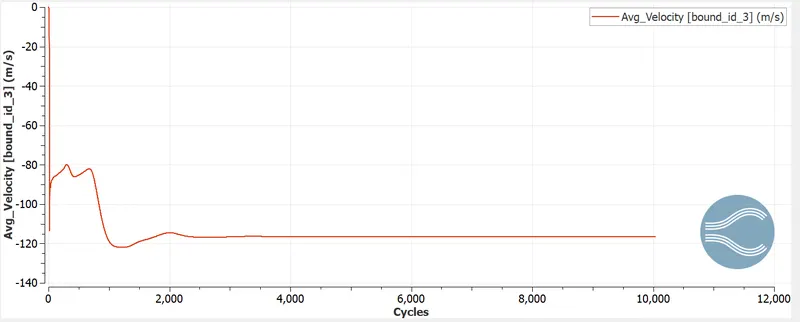
- Average velocity at outlet
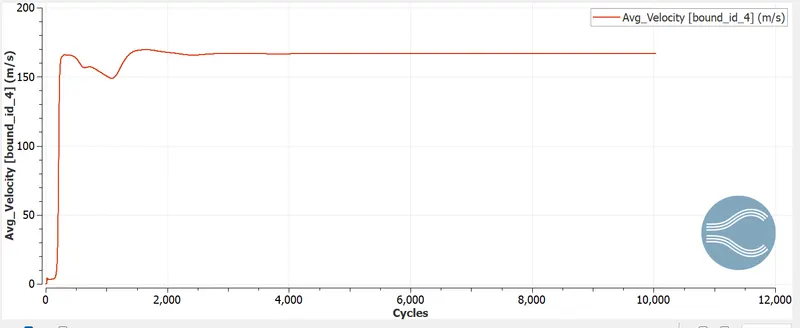
- The following graph shows the variation of velocity as the number of cycles increases. Its showing constant average velocity at the outlet of the throttle valve.
- Total cells plot
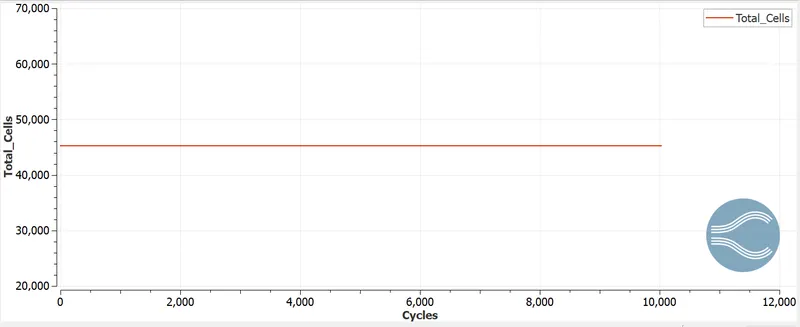
- For the steady flow, there is no movement in the throttle valve so there will be no new mesh generation process as the geometrical shape of the fluid region remain the same in the overall simulation and, therefore, the cell count will be also the same for the overall simulation
- Pressure contour
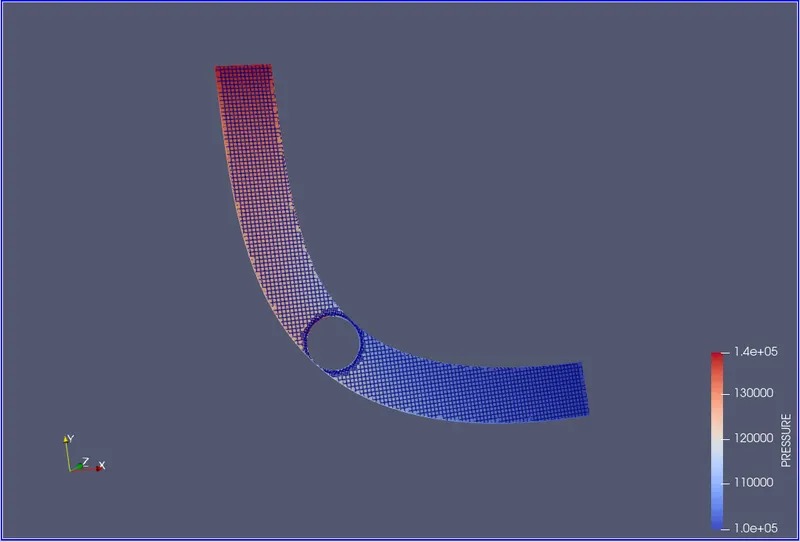
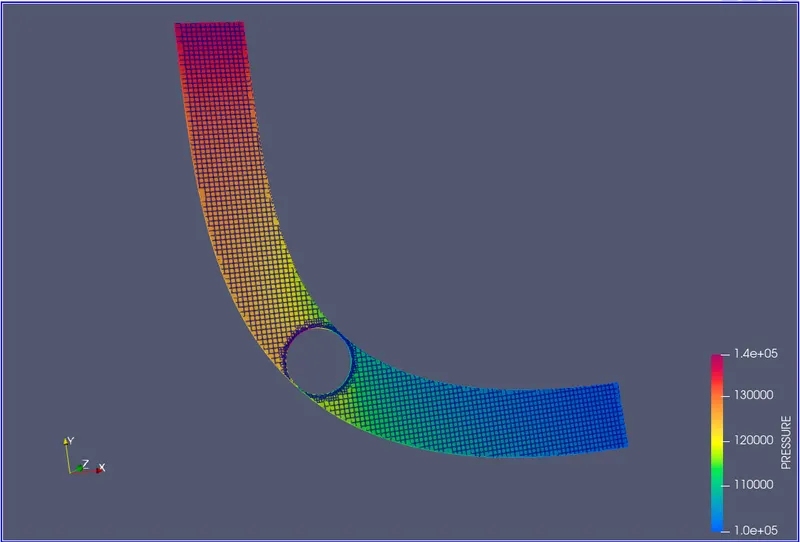
- The figure below shows a velocity contour with velocity vectors on the midplane along the z direction. Since the flow is constant, there is no movement in the throttle plate and the throttle plate remains stationary throughout the cycle.
Turning your elbow will increase your speed a little.
Then the velocity hits the throttle valve and the velocity flow he splits into two parts. This is the cause of the speed-up pressure drop near the throttle exit. Fluid (air) velocity impinges on the valve body, which causes high pressure at the front of the body, and less aerodynamic shape at the rear, forming a vortex near the rear face of the valve. This is the cause of the lowest pressure in the valve body. Now let's look at the pressure contour plot to get a more accurate observation. - Velocity contours
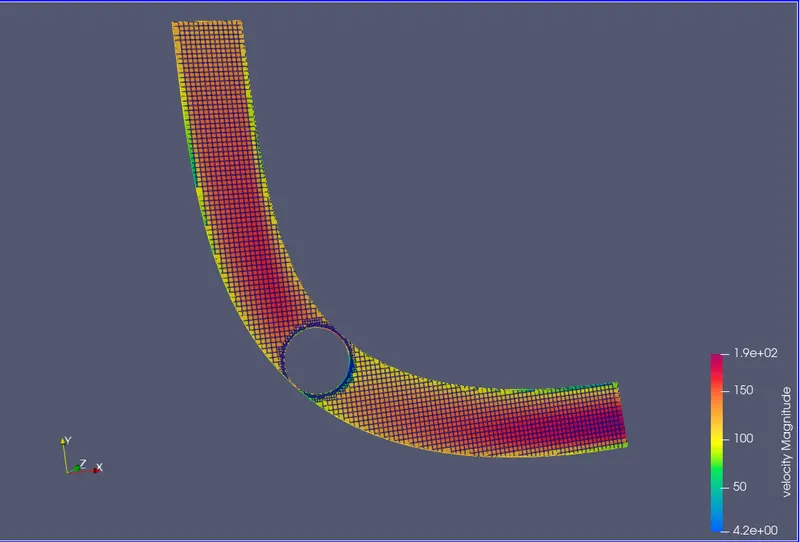
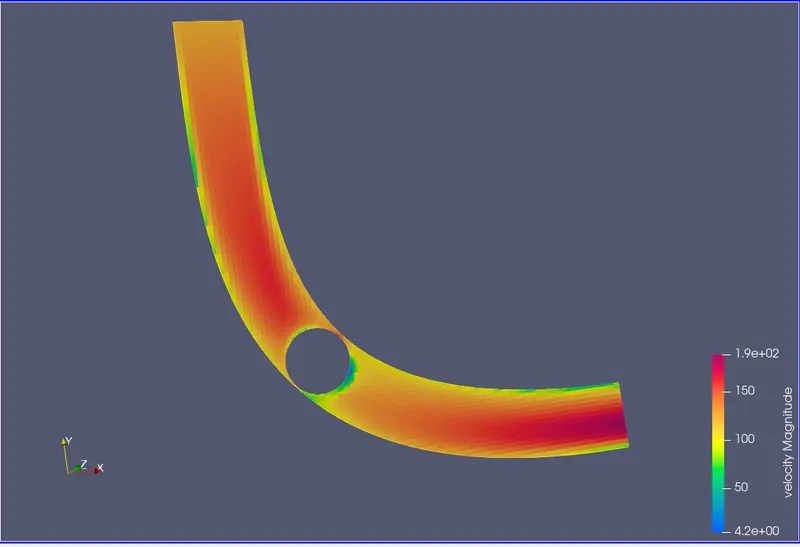
- The diagram below shows the pressure on the center plane of the throttle body. Here we can see that the pressure from the inlet slowly decreases. This is caused by wall friction. It can be seen that the pressure loss is greater at the bent portion of the elbow.
The airflow then hits the throttle valve in front of it, creating high pressure. In contrast, vortex formation can be seen at the throttle valve end responsible for the low pressure region.
In this case the throttle plate acts as an obstacle, resulting in a decrease in pressure and an increase in air velocity. - Stepwise Explaination
-
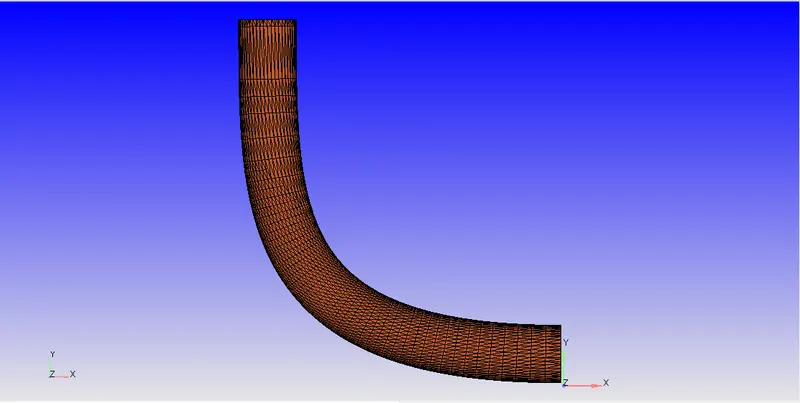
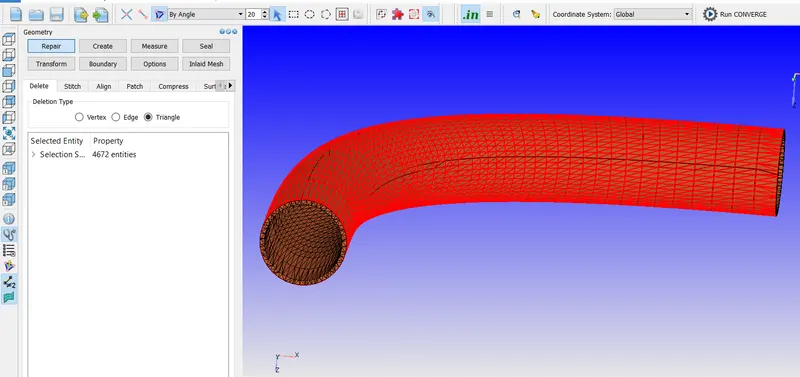
To begin the simulation, geometry cleanup is vital.
-
As we require the simplest fluid region to simulate fluid float, we ought to regulate our geometry as in keeping with our simulation setup.before simulation import, the real version of the throttle valve within the converge through just drag and drop technique.
-
Even before uploading the geometry, previous check the geometry in ".stl", ".step" or ".iges" format. As those are the usual cad accepted formats for all the software program.
-
After uploading the geometry, it is right practice to test the geometrical size and geometry bounding container.
-
Converge best accepts the size in meters. So even though the geometry become made using millimeters with the aid of preceding software program converge only take delivery of it as a meter.via the use of the size choice available in converge, we can reduce the scale of the complete geometry at one click on. so the above geometry length changed into decreased the usage of a 0.001 scale factor.
-
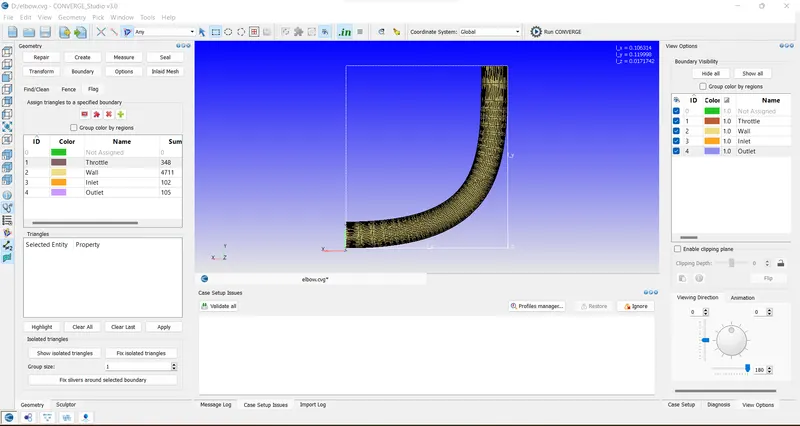
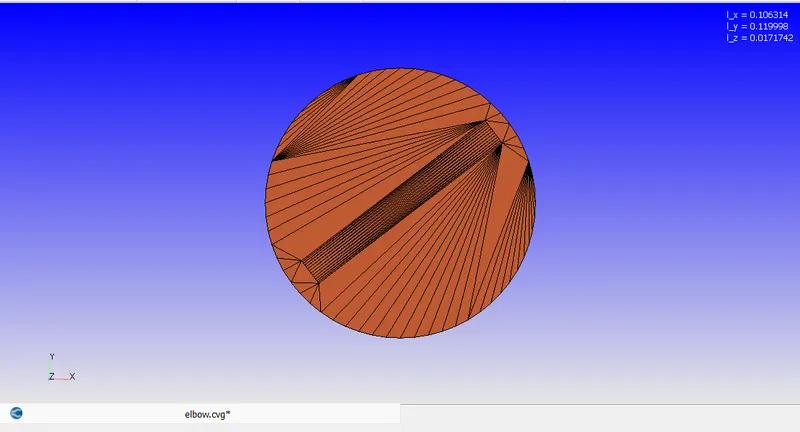
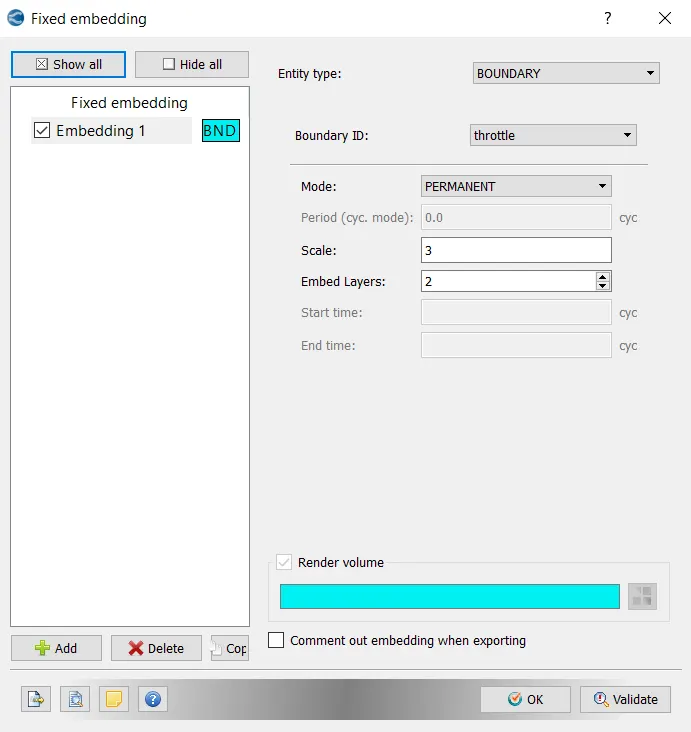
In boundary definition, first, add the range of barriers as in line with requirement. on this specific case, we require 4 barriers. Later, assign that boundary to a separate floor.
-
And sooner or later rename the boundary as in step with the relative boundary kind - Inlet, Outlet, throttle Wall, and Elbow Wall.by way of the use of the hide alternative, we can cover decided on factors in the converge, which is a useful device to look at the inner part of the geometry.
-
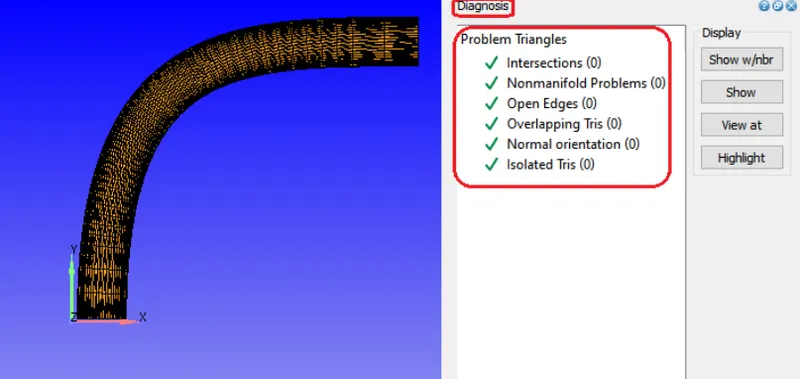
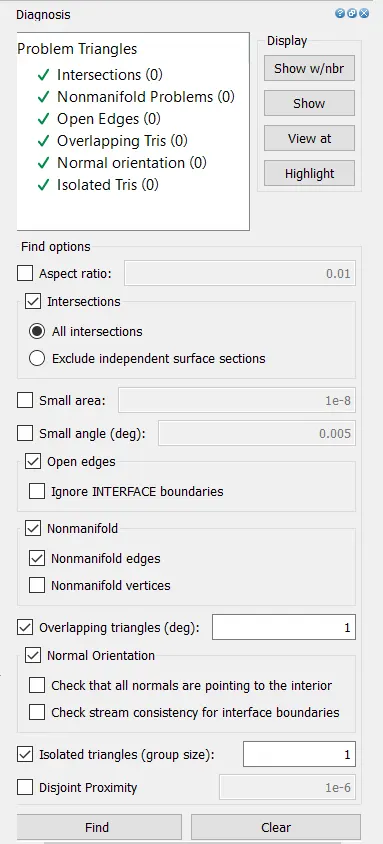
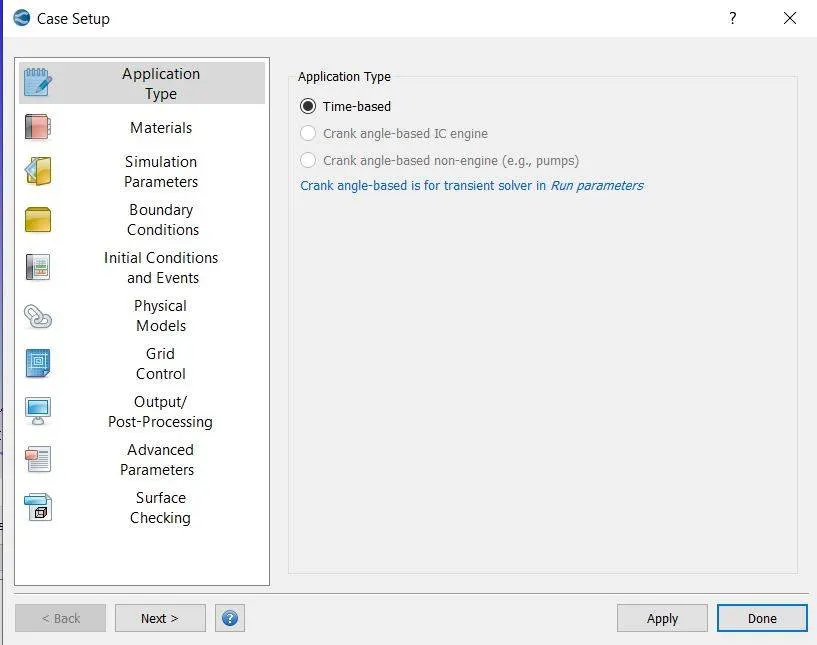
In this unique case, we want to check the boundary venture for the throttle valve.lastly, the usage of prognosis test all the geometry setup is good enough or not. right here it assessments intersections, Non-manifold issues, open Edges, Overlapping tris, normal orientation, and isolated tris.within the 'application type" section selects the "Time-based totally" software and click on practice and done.
-
Later, we can get the option for a steady float solver. It'll show us a setup tree.
-
In this simulation, we simulated the effects for compressible flow with fluid air.that is a consistent-state simulation, so the regular-nation solver type became decided on with simulation mode complete hydrodynamic the usage of gas float solver as compressible.
-
To reveal our outcomes and converge our consequences with proper tolerance, the steady-state reveal field was checked. This gave us the option to manipulate the accuracy of our consequences.
-
In regular-kingdom display enter -parameter were monitored - one become pace at the opening and another become mass go with the flow fee at the opening. Tolerance for both was set as 0.001.
-
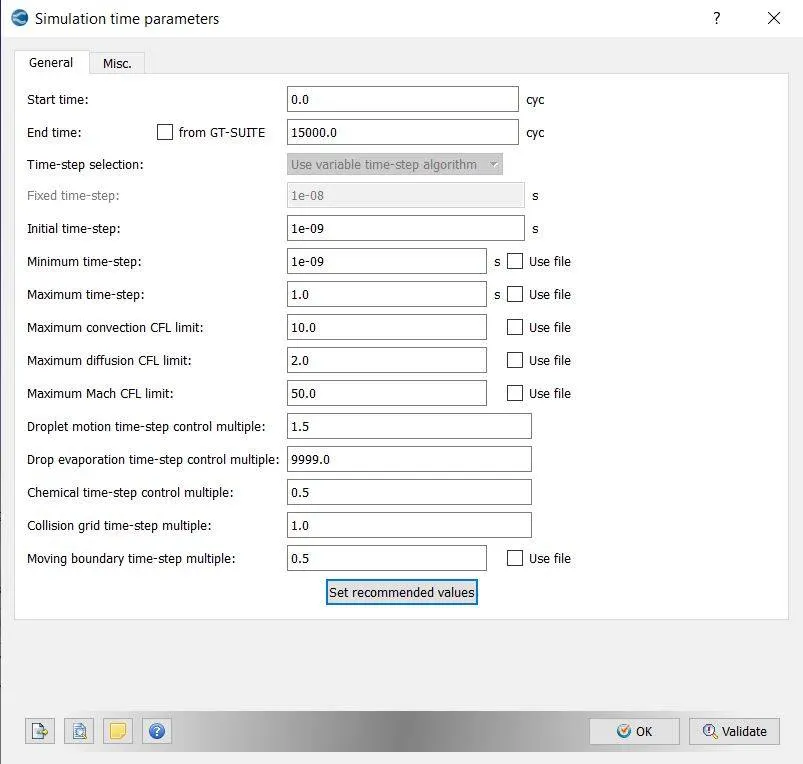
The cycle variety become set for zero - 15000 cycles with the preliminary time step and a minimum time step of 1e-09. fee of most time-step and maximum convection CFL restriction set for 1.apart from the boundary surface, cells additionally generate inside the inner quantity.
-
Consequently, it is critical to assign a few cloth or fluid material with precise property situations to those cells.
So, we outline it as a waft place with cloth fluid as air with ordinary stress and temperature at its initial nation.In a regular-country situation, the waft does no longer alternate with appreciate to time. so there is no factor to offer wall movement in line with time. -
As for the referred to circumstance, we can most effective get the very last end result for any case. so here we consider throttle wall is fixed and obeying the regulation of wall floor circumstance.
-
The time c program languageperiod for writing 3-D output information documents is saved for a hundred cycles i.e. after a hundred cycles it's going to create one 3D output document.
-
The time c language for writing restarting output was also stored for 100 cycles with a purpose to assist us restart the simulation within the closing count of 100 cycles in case simulation stopped unexpectedly.
-
It helps to shop the simulation time of the person.he simulation was run with the assist of Cygwin.
-
The listing incorporates all of the export documents that were placed and the use of the ‘converge.exe’ setup the simulation become run.
- Conclusion
- A steady-state simulation of the throttle valve shows that the inlet pressure is higher than the outlet pressure. Mass flow variation occurs at the forward position of the throttle valve.
- The velocity at the entry position is high, but you can see that the high speed region is leaking from the corner of the throttle section.
- At the exit, flow occurs in the throttling area and the exit velocity is again reduced to a steady-state value.
- Density change is also a function of mass flow rate change and pressure differential. It can be seen that flow separation occurs when the pressure tends to drop.
- Run a steady-state simulation to observe the effect of flow separation in the region of the throttle section.
- The pressure change is fluctuating at the inlet and the pressure rises when it hits the valve. Outlet pressure is lower, further eliminating stall.
- Grid refinement is performed at the throttling points to accurately record flow behavior. Refining increases the number of computational cells and increases the time it takes to complete the simulation.