Week 4.1: Project - Steady state simulation of flow over a throttle body
l. INTRODUCTION
A throttle is a mechanism by which fluid flow is managed by constriction or obstruction. An engine's power can be increased or decreased by the restriction of inlet gases (by the use of a throttle), but usually decreased. The term throttle has come to refer, informally, to any mechanism by which the power or speed of an engine is regulated, such as a car's accelerator pedal.
ll. OBJECTIVE
- Simulate fluid flow over a throttle body using steady-state solver.
- Plot & analyze Velocity & Pressure Contours
- Plot & analyze Velocity, Pressure, Mass flow rate, total cell count.
lll. GEOMETRY
The geometry consists of 4 basic components:
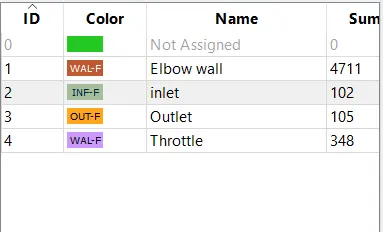
- Elbow Wall
- Inlet
- Outlet
- Throttle
1. Geometry Setup
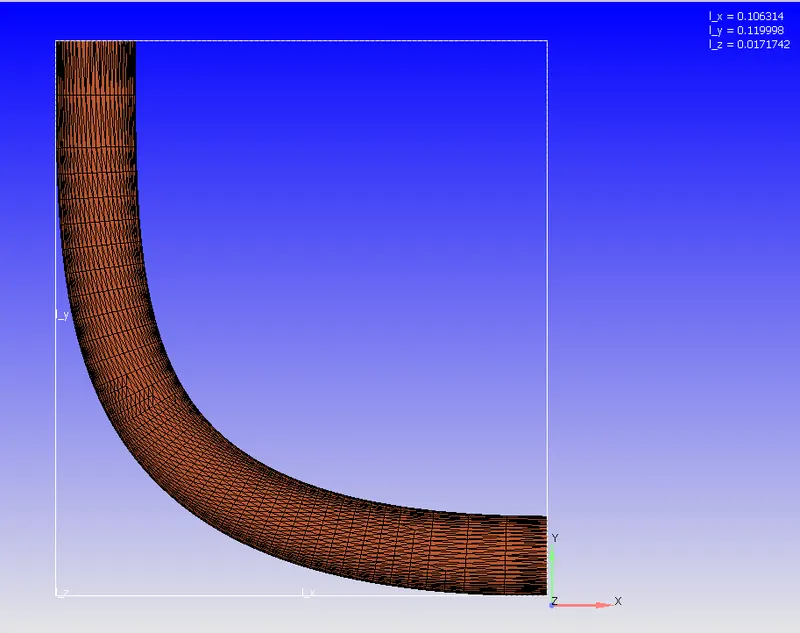
Geometry setup in converge studio.
- Scaling the geometry
- Removing all the open edges
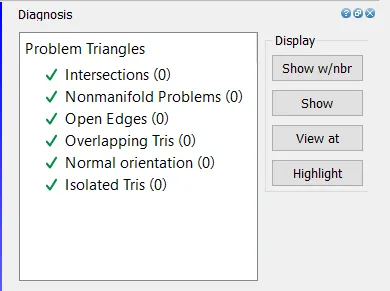
2. Diagnosis Check
3. Boundary Flagging
lV. Case Setup
1. Fluid: Air
- Mass Fraction of Nitrogen: 0.77
- Mass Fraction of Oxygen: 0.23
2. Solver:
A steady-state pressure-based solver is used to simulate the flow. In Misc, UseSharedMemory is unchecked and Steady-State Monitor is checked.
3. Simulation Cycles:
- Total Number of Cycles: 15,000 cycles
- Minimum number of cycles to be executed by the steady-state solver: 15,000 cycles
- Initial time-step: 1e-9 s
- Minimum time-step: 1e-9 s
- Maximum time-step: 2 s
4. Boundary Conditions:
- Elbow Wall: Boundary Type - Wall | Velocity Boundary Condition - Law of Wall
- Inlet: Boundary Type - INFLOW | Total Pressure = 150000 Pa | Temperature = 300 K | Species = Air
- Outlet: Boundary Type - OUTFLOW | Static Pressure = 100000 Pa | Temperature = 300 | Species = Air
- Throttle: Boundary Type - WALL | Wall Motion Type - Stationary | Surface Movement - Fixed | Velocity Boundary Condition - Law of Wall
5. Regions and Initialization:
- Flow Region: Volumetric Flow Region
- Total Pressure: 101325 Pa
- Temperature: 300 K
- Species: Air
6. Turbulence Model: RNG k-ε">k- Epsilon
7. Grid Control:
- Base Grid:
- dx=dy=dz= 2e-3 m
- Fixed Embedding:
- Entity Type: Boundary
- Boundary ID: Throttle
- Mode: Permanent
- Scale: 3
- Embed Layers: 2
8. Output Files:
- The time interval for writing 3D output files: 100 cycles
- The time interval for writing restarting output: 100 cycles
V. RESULTS
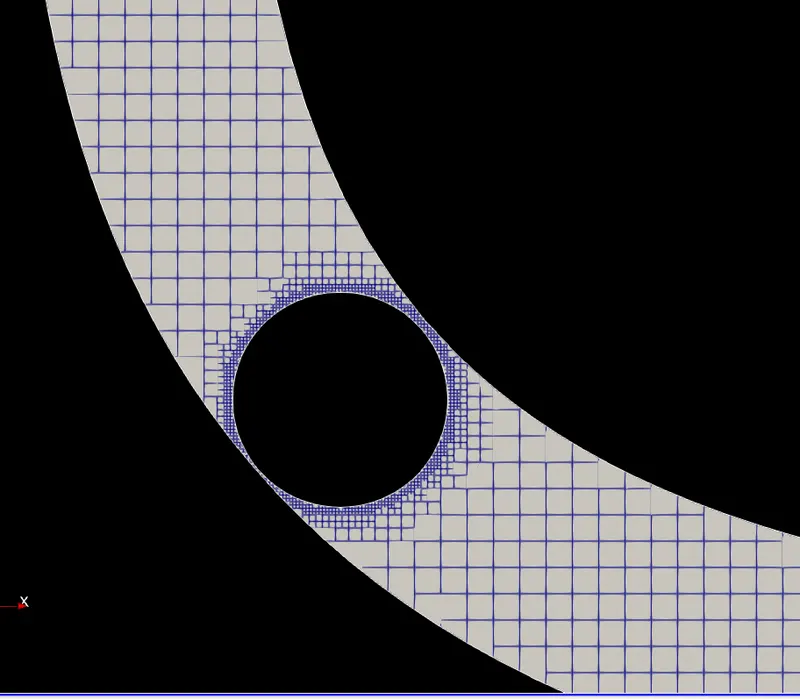
1. Mesh
Decreasing the mesh size around the throttle helps in capturing the results at the boundary of the throttle more accurately and also results in the smoothing of the contours around the throttle. However, this increases the computational time due to increased in number of cells.
Figure 1.1 - Mesh
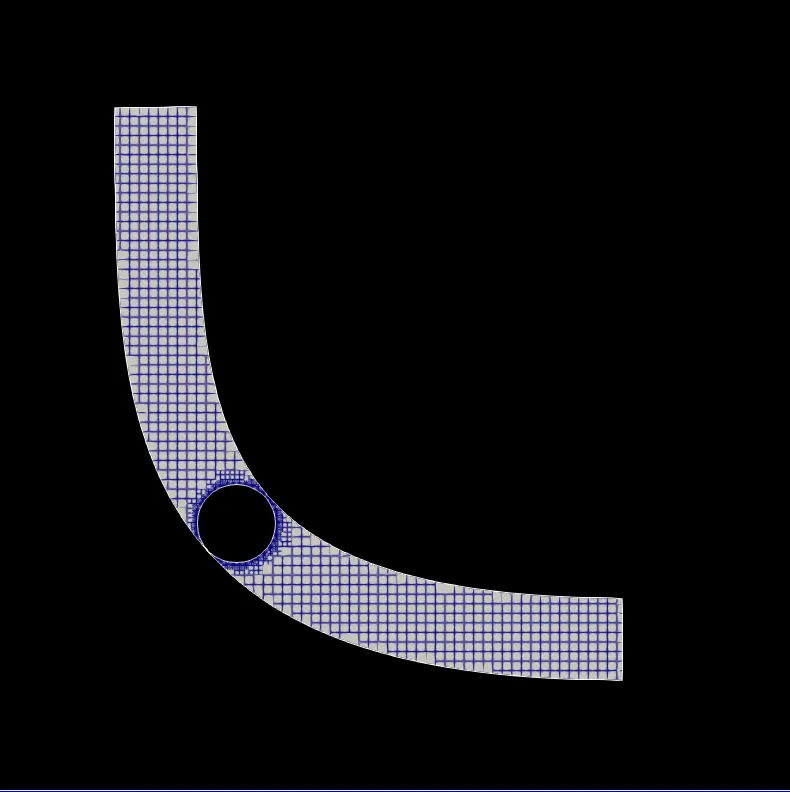
Figure 1.2 - Mesh around the Throttle
2. Velocity Contours and Pressure Contours
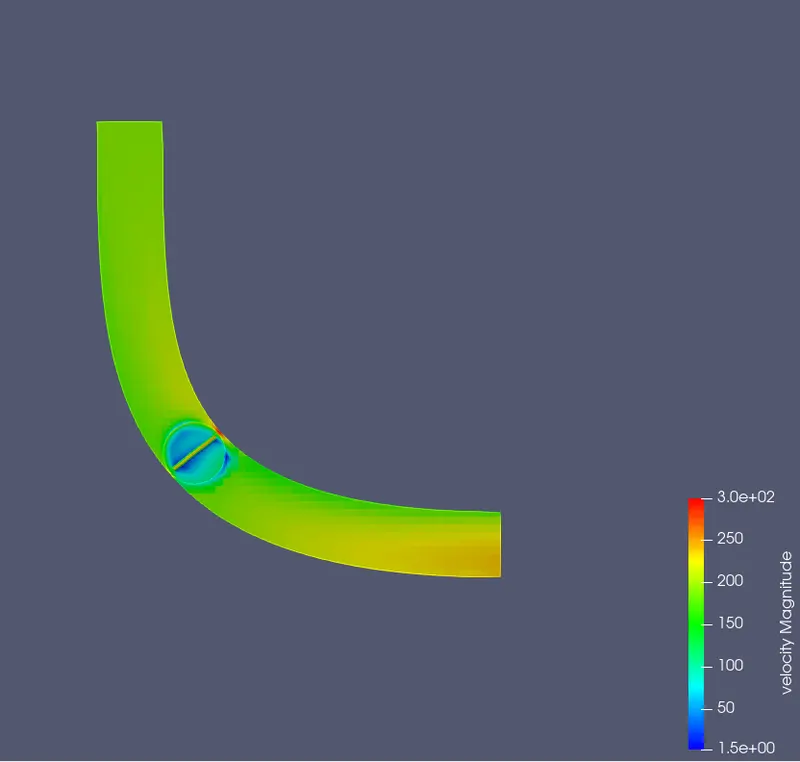
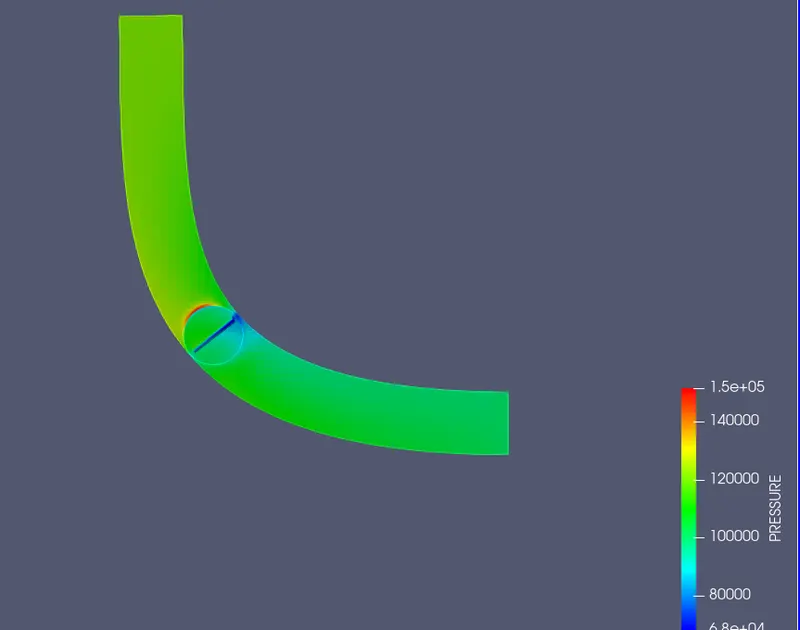
There are three distinct regions around the throttle in which flow can be analyzed :-
2.1 The region just before the throttle
The point of impact of the fluid with the throttle takes place in this region. In this region, the separation of the fluid takes place resulting in a sudden decrease in the velocity. This also results in a sudden increase in the pressure as the kinetic energy gets converted into pressure energy & the energy remains conserved.
2.2 The region below the throttle
Since there is sudden decrease in the are below the throttle, the velocity of the fluid will increase to ensure a constant mass flow rate. This also results in a decrease in the pressure in this region.
2.3 The region just after the throttle
The re-attachment of the fluid takes place in this region. At this point of re-attachment, the fluid flows in different directions, causing a decrease in the velocity of the fluid.
Figure 2.1 - Velocity Contour
Animation - Velocity Contour
https://drive.google.com/file/d/1dtDBCTT8XjtBTF4Xh576mELxfxtkQU1w/view?usp=sharing
The animation of the velocity contour shows that the steady-state solver only focuses on the final equilibrium results & not the actual behavior of fluid with respect to time, which in turn, would require the transient solver.
Figure 2.2 - Pressure Contour
3. Velocity Vectors
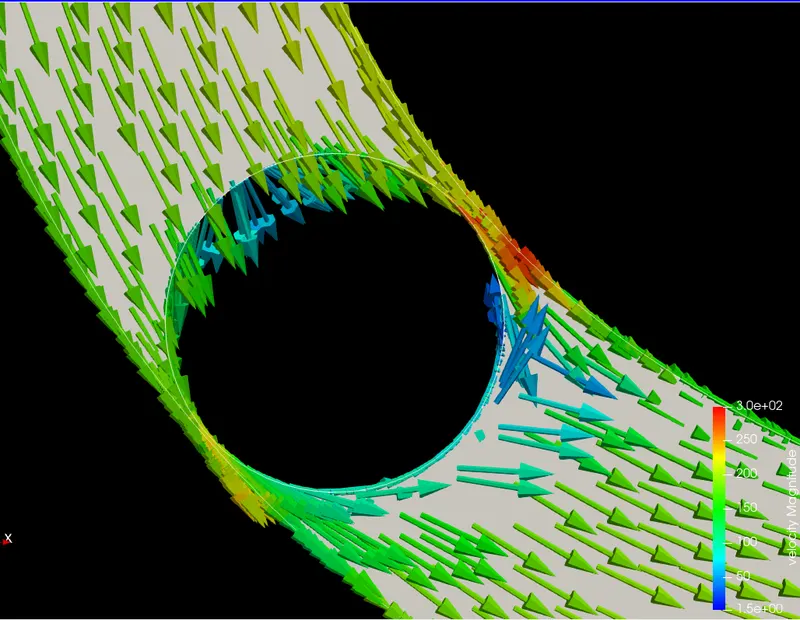
The velocity contours can be understood better by observing the direction of flow using velocity vectors.
Figure 3.1 - Velocity Vectors
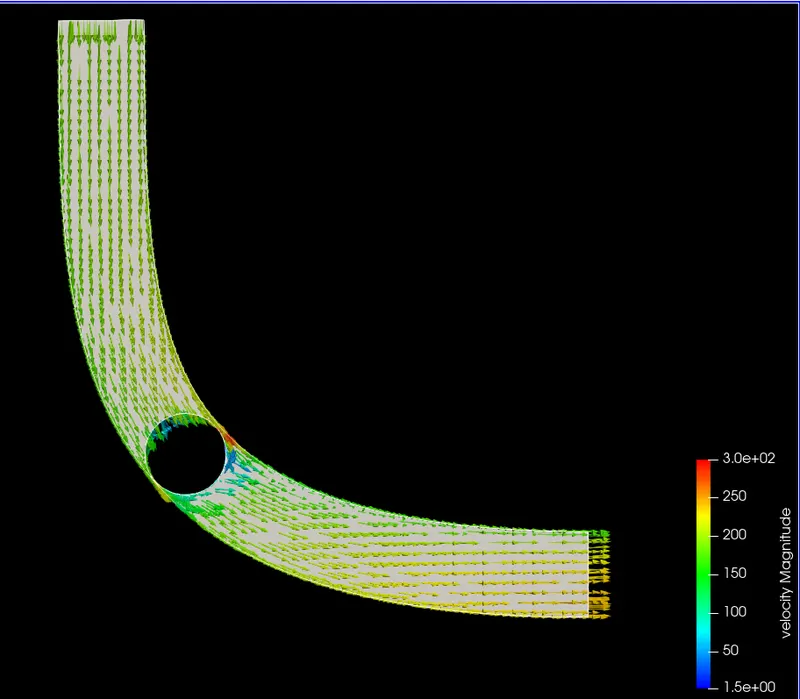
Figure 3.2 - Velocity Vector around the throttle
4. Velocity Streamline
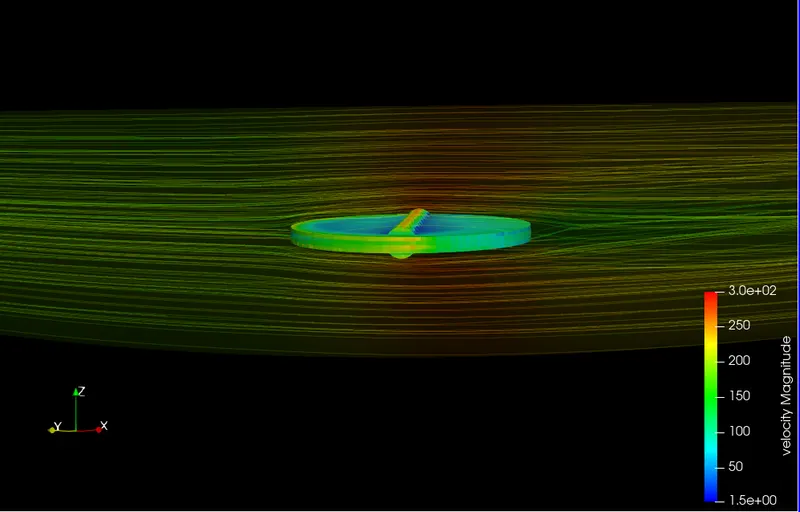
This case is solved using a steady-state solver, the velocity streamlines describes the motion of the velocity particles when the system is in equilibrium. Thus, the streamlines & the pathlines are identical at the end of the simulation.
Figure 4.1- Velocity Streamlines
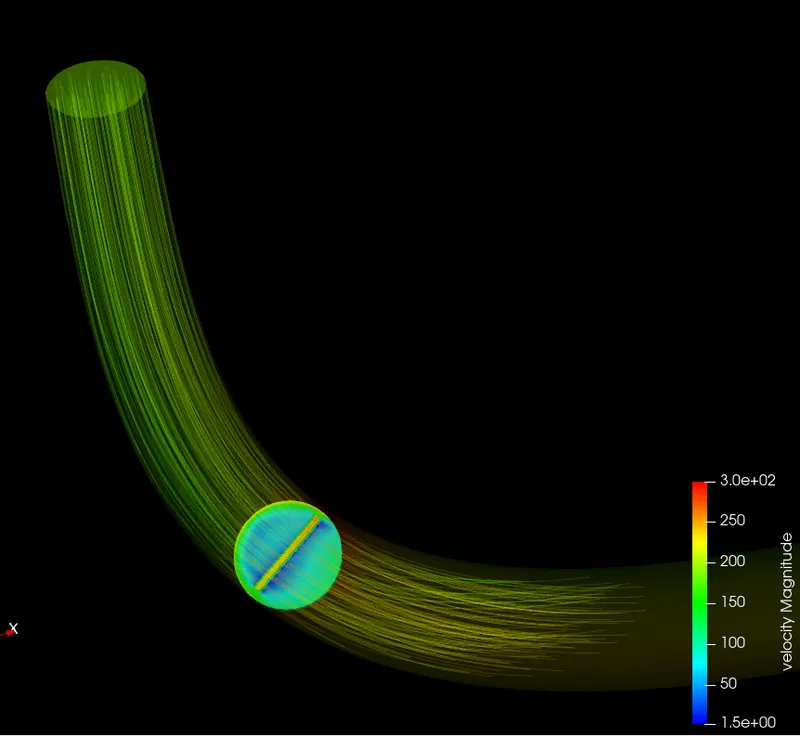
Figure 4.2 - Velocity Streamlines around the Throttle
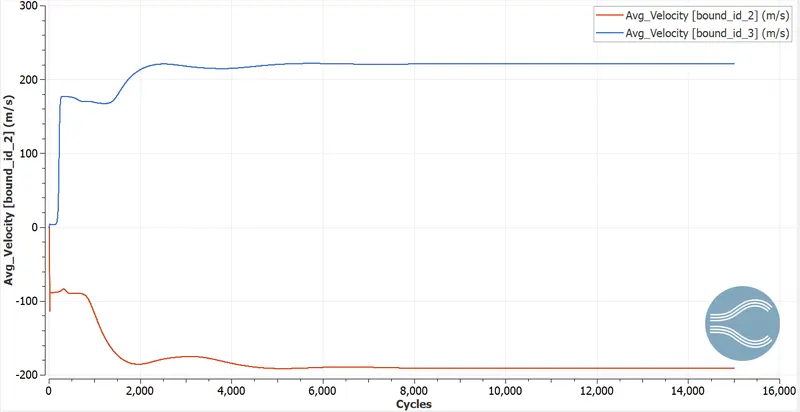
5. Variation Of Average Velocity w.r.t Number of Cycles
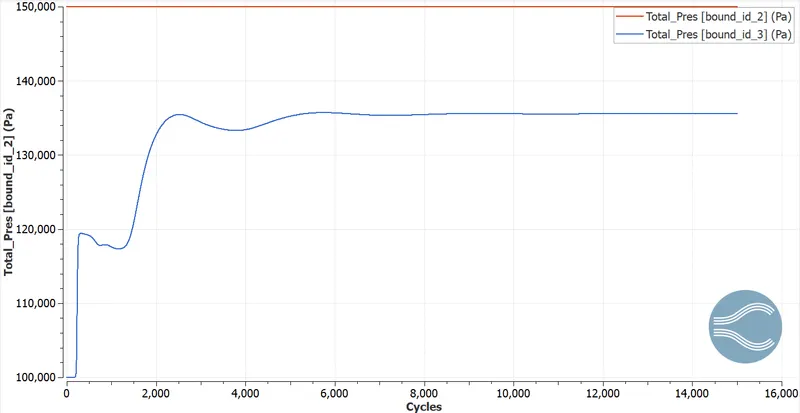
6. Variation of Pressure w.r.t Number of Cycles
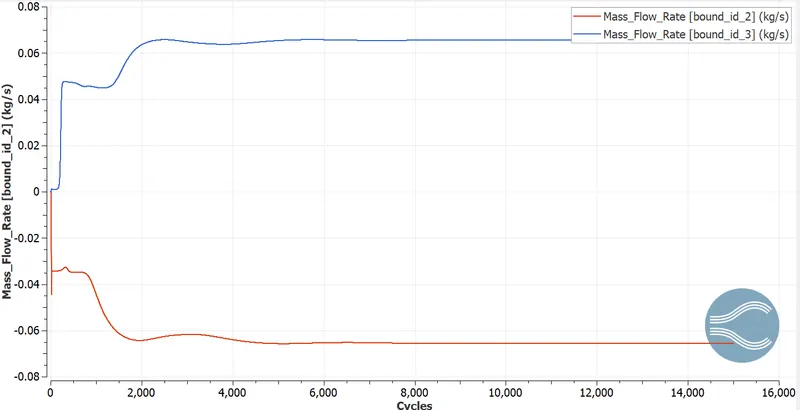
7. Variation of Mass Flow Rate w.r.t Number of Cycles
8. Variation of Cell Count w.r.t. Number of Cycles
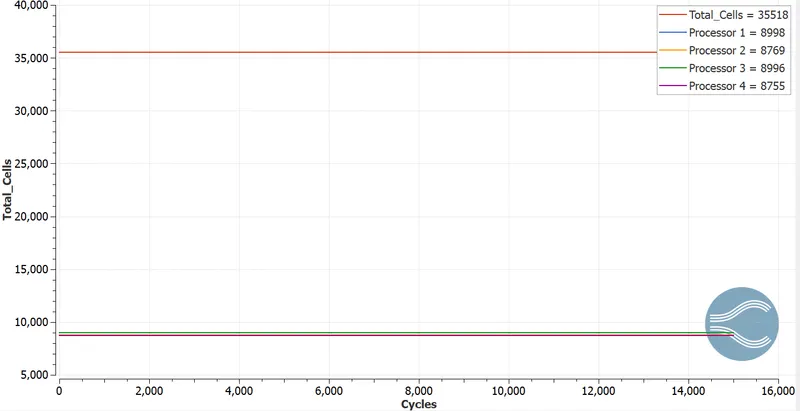
The cells are un-evenly distributed among the 4 processors in order to achieve a load balance. In this case, as the simulation is simple, the number of cells distributed are almost equal. Also, since there are no moving parts in the geometry, the number of cells remains constant throughout the simulation.
Vl. CONCLUSION:
Analyzing the separation of flow helps us to understand the equilibrium behavior of the fluids under various boundary conditions.