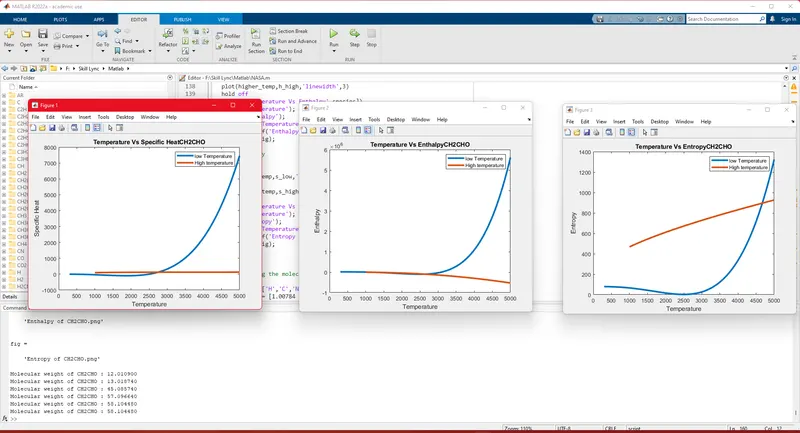
Project 1 - Parsing NASA thermodynamic data
Main Code:-
close all
clear all
clc

f1 = fopen('THERMO.dat','r');
fgetl(f1);

% Defining temp. values

templ = str2num(fgetl(f1));
global_low_temp = templ(1);
global_mid_temp = templ(2);
global_high_temp = templ(3);

% For skipping unwanted lines

for i = 1:3
    fgetl(f1);
end

% Loop creation for reading the values & plotting molecular weight

for i = 1:4:212
    line1 = fgetl(f1);

    l = strsplit(line1, ' ');
    m = length(l);
    species = l{1};

% Storing local temp values

low_temp = str2double(l{m-3});
mid_temp = str2double(l{m-2});
high_temp = str2double(l{m-1});

% Storing second line variable values

line2 = fgetl(f1);

% Find the position of E

a = strfind(line2,'E');

% Reading other variables

a1 = str2double(line2(1:(a(1)+3)));
a2 = str2double(line2((a(1)+4):(a(2)+3)));
a3 = str2double(line2((a(2)+4):(a(3)+3)));
a4 = str2double(line2((a(3)+4):(a(4)+3)));
a5 = str2double(line2((a(4)+4):(a(5)+3)));

% Storing the values of third line

line3 = fgetl(f1);

% Finding the position of E

b = strfind(line3,'E');

% Storing for the next set of variables

a6 = str2double(line3(1:(b(1)+3)));
a7 = str2double(line2((b(1)+4):(b(2)+3)));
a8 = str2double(line2((b(2)+4):(b(3)+3)));
a9 = str2double(line2((b(3)+4):(b(4)+3)));
a10 = str2double(line2((b(4)+4):(b(5)+3)));

% Storing the values of forth line

line4 = fgetl(f1);

% Find the position of E

c = strfind(line4,'E');

% storing the variable values in line 4

a11 = str2double(line4(1:c(1)+3));
a12 = str2double(line4((c(1)+4):(c(2)+3)));
a13 = str2double(line4((c(2)+4):(c(3)+3)));
a14 = str2double(line4((c(3)+4):(c(4)+3)));

% Creating values for lower & higher temperature

lower_temp = linspace(low_temp,mid_temp,100);
higher_temp = linspace(mid_temp,high_temp,100);

% Universal gas constant          -  j/mol*K

R = 8.314

% Claculating the values of cp, H, S using the formulae

for k =1:100

% Lower temp values

cp_low(k) = (a8+(a9*lower_temp(k))+(a10*(lower_temp(k)^2)+(a11*(lower_temp(k))^3)+a12*(lower_temp(k))^4))*R;
h_low(k)  = a8+(a9*lower_temp(k))/2+(a10*(lower_temp(k)^2)/3+(a11*lower_temp(k)^3)/4+a12*(lower_temp(k)^4)/5+(a13/lower_temp(k)))*R*lower_temp(k);
s_low(k)  = ((a8*log(lower_temp(k))+(a9*lower_temp(k))+(a9*lower_temp(k))+((a10*lower_temp(k)^2)/2)+((a11*lower_temp(k)^3)/3)+((a12*lower_temp(k)^4)/4)+a14)*R);

% High temp values

cp_high(k) = (a1+(a2*higher_temp(k))+(a3*(higher_temp(k)^2)+(a4*(higher_temp(k))^3)+a5*(higher_temp(k))^4))*R;
h_high(k)   = a1+(a2*higher_temp(k))/2+(a3*(higher_temp(k)^2)/3+(a4*higher_temp(k)^3)/4+(a5*(higher_temp(k)^4))/5+(a6/higher_temp(k)))*R*higher_temp(k);
s_high(k)   = ((a1*log(higher_temp(k))+(a2*higher_temp(k))+(a2*higher_temp(k))+((a3*higher_temp(k)^2)/2)+((a4*higher_temp(k)^3)/3)+((a5*higher_temp(k)^4)/4)+a7)*R);

end

% Making folders for plot saving

nasa_graphs = species;
mkdir(nasa_graphs);
current = pwd;
cd(nasa_graphs);

% Plotting graphs

% Specific heat

figure(1)
plot(lower_temp,cp_low,'linewidth',3)
hold on
plot(higher_temp,cp_high,'linewidth',3)
hold off
title(['Temperature Vs Specific Heat',species])
xlabel('Temperature');
ylabel('Specific Heat');
legend('low Temperature','High temperature');
fig = sprintf('Specific Heat of %s.png',species)
saveas(gca,fig);

% For Enthalpy

figure(2)
plot(lower_temp,h_low,'linewidth',3)
hold on
plot(higher_temp,h_high,'linewidth',3)
hold off
title(['Temperature Vs Enthalpy',species])
xlabel('Temperature');
ylabel('Enthalpy');
legend('low Temperature','High temperature');
fig = sprintf('Enthalpy of %s.png',species)
saveas(gca,fig);

% For Entropy

figure(3)
plot(lower_temp,s_low,'linewidth',3)
hold on
plot(higher_temp,s_high,'linewidth',3)
hold off
title(['Temperature Vs Entropy',species])
xlabel('Temperature');
ylabel('Entropy');
legend('low Temperature','High temperature');
fig = sprintf('Entropy of %s.png',species)
saveas(gca,fig);
cd(current)
end

% Calculating the molecular weight

atoms     = ['H','C','N','R','S'];
atom_weight = [1.00784 12.0109 16.002 39.065 32.067];
mol_weight  = 0;
species_check = char(species);
for i = 1:length(species_check)
    for j = 1:length(atoms)
        if (strcmp(species_check(i),atoms(j)));
            mol_weight = mol_weight + atom_weight(j);
            position = j;
        end
    end
x = str2double(species_check(i));
if x>1
    mol_weight = mol_weight + (atom_weight(j)*(x-1));
end
fprintf('Molecular weight of %s : %f \n',species_check,mol_weight)

end
Explanation :-
The given code used the thermodynamic data value from the given file THERMO.dat
The file was read by using read command
The code has used loops for the given values to an extent of the required number of iterations.
The coefficients are arranged in a order position is found by using strfind command.
Then a folder is made to save the data(images) of output.
Graph is plotted & images were saved.