Week 4.1 - Genetic Algorithm
1 st iteration
clear all
close all
clc
%inputs
x = linspace(0,0.6,150);
y = linspace(0,0.6,150);
[xx,yy] = meshgrid(x,y);
%creating for loop
for i=1:length(xx);
for j=1:length(yy);
input_vector(1)=xx(i,j);
input_vector(2)=yy(i,j);
f(i,j)=stagalmite(input_vector);
end
end
%no of times ga runs
num_cases = 50;
tic
for i=1:num_cases;
[inputs,f_opt(i)]= ga(@stagalmite,2);
x_opt(i)=inputs(1);
y_opt(i)=inputs(2);
opt_f(i)= -f_opt(i);
end
time1=toc
%plotting
subplot(2,1,1)
hold on
surfc(xx,yy,f)
shading interp
plot3(x_opt,y_opt,f_opt,'marker','o','markersize',4,'MarkerFaceColor','r')
title('unbounded inpus')
subplot(2,1,2)
plot(opt_f)
xlabel('iterations')
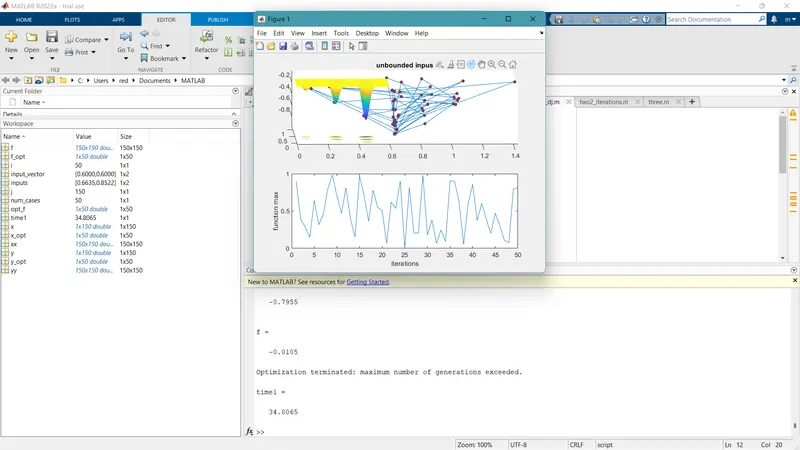
ylabel('function max')1.The input parameters are provided.
2. Creating a for loop for the stagalmie function which is inputed.
3.now we are creating for 50 values and we are using the tic toc to represent the time the code ran.
4.The boundaries are unbounded in this case
5.The graphs are plotted and the result is obtained it took about 34 sec to run the code and ouput data
2nd iteration :
clear all
close all
clc

%inputs
x = linspace(0,0.6,150);
y = linspace(0,0.6,150);

[xx,yy] = meshgrid(x,y);

%creating for loop
for i=1:length(xx);
    for j=1:length(yy);
        input_vector(1)=xx(i,j);
        input_vector(2)=yy(i,j);
        f(i,j)=stagalmite(input_vector);
    end
end

%no of times ga runs
num_cases = 100;

tic
for i=1:num_cases;
    [inputs,f_opt(i)]= ga(@stagalmite,2,[],[],[],[],[0 0],[0.6,0.6]);
    x_opt(i)=inputs(1);
    y_opt(i)=inputs(2);
    opt_f(i)= -f_opt(i);
end

time1=toc

%plotting
subplot(2,1,1)
hold on
surfc(xx,yy,f)
shading interp
plot3(x_opt,y_opt,f_opt,'marker','o','markersize',4,'markerFaceColor','r')
title('with bounded inpus')
subplot(2,1,2)
plot(opt_f)
xlabel('iterations')
ylabel('function max')
1.The input parameters are provided.
2. Creating a for loop for the stagalmie function which is inputed.
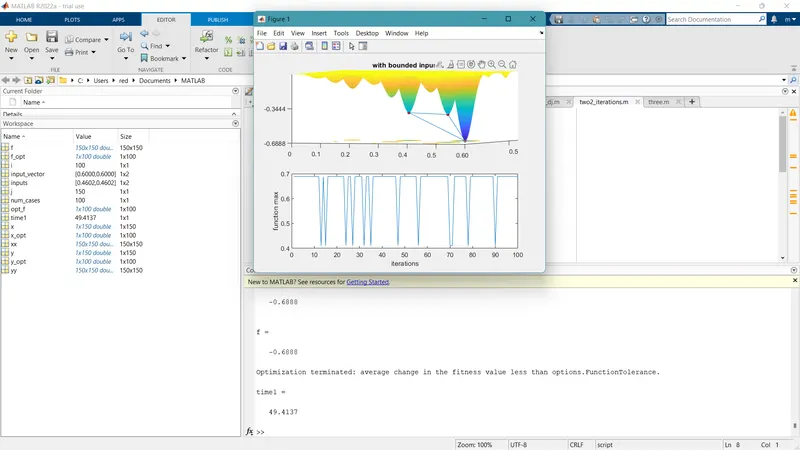
3.now we are creating for 100 values and we are using the tic toc to represent the time the code ran.
4.The boundaries are bounded in this case
5.The graphs are plotted and the result is obtained it took about 100 sec to run the code and ouput data
3rd iteration :
clear all
close all
clc

%inputs
x = linspace(0,0.6,150);
y = linspace(0,0.6,150);

[xx,yy] = meshgrid(x,y);

%creating for loop
for i=1:length(xx);
    for j=1:length(yy);
        input_vector(1)=xx(i,j);
        input_vector(2)=yy(i,j);
        f(i,j)=stagalmite(input_vector);
    end
end

%no of times ga runs
num_cases = 150;

options = optimoptions('ga');
options = optimoptions(options,'PopulationSize',450);
tic
for i=1:num_cases;
    [inputs,f_opt(i)]= ga(@stagalmite,2,[],[],[],[],[0 0],[0.6,0.6],[],options);
    x_opt(i)=inputs(1);
    y_opt(i)=inputs(2);
    opt_f(i)= -f_opt(i);
end

time1=toc

%plotting
subplot(2,1,1)
hold on
surfc(xx,yy,f)
shading interp
plot3(x_opt,y_opt,f_opt,'marker','o','markersize',4,'markerFaceColor','r')
title('with bounded inpus')
subplot(2,1,2)
plot(opt_f)
xlabel('iterations')
ylabel('function max')
1.The input parameters are provided.
2. Creating a for loop for the stagalmie function which is inputed.
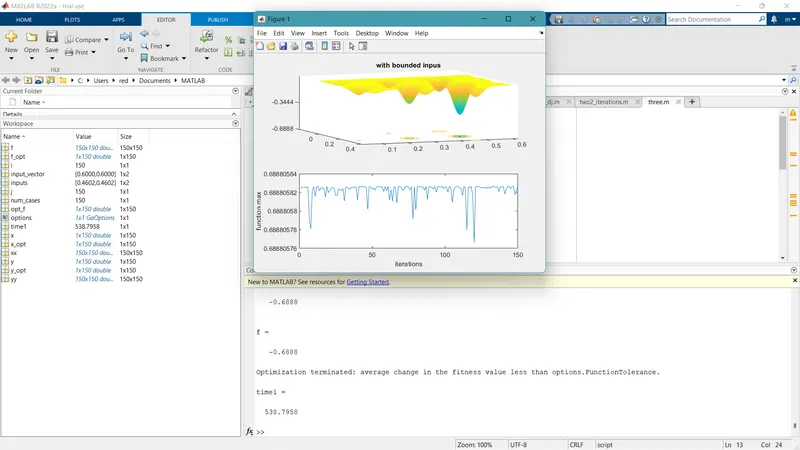
3.now we are creating for 150 values and we are using the tic toc to represent the time the code ran.
4.The boundaries are bounded in this case
5.The graphs are plotted and the result is obtained it took about 100 sec to run the code and ouput data
Graphs