Week 4.1 - Genetic Algorithm
Optimization: Optimization is the decision making process,it helps to find best results under a set of prioritized criteria or constraints.
Genetic Algorithm:
GA(genetic algorithm) are the search algorithms based on the mechanics of natural selection and natural genetics.
It is based on the "survival of the fittest" concept(Darwinian Theory).
It simulates the process of evolution.
GA working:
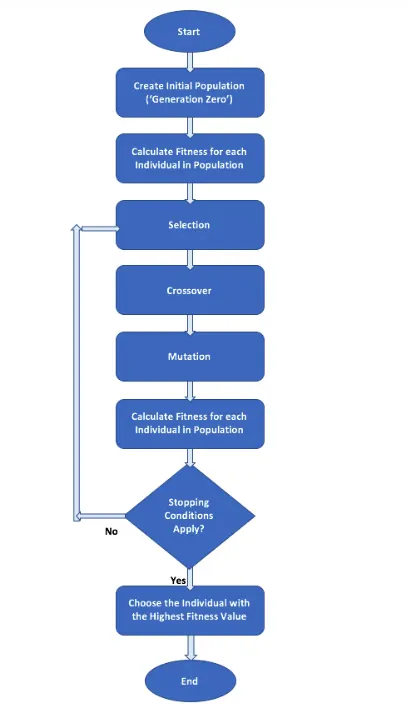
- A population of 2n to 4n trial solutions is used (n=no of variables).
- Each solution is usally represented by a string of binary variables ,corresponding to the chromosomes in genetics.
- The strin length can be made large enough to achieve desired fitness of approximation and thus any designed accuracy can be achieved.
- The numerical value of the objective function corresponding to the concept of fittness in genetics.
- After trail solution are selected a new generation (a new set of strings) is produced by selecting ,using stochastic priniciples the fittest parents to produce"children" from among the trial solutions.
- In each child cross over or exachange of portions of string of each of the two parents generates new solutions.
Syntax ga:
x=ga(fun,nvars,A,b,Aeq,beq,lb,ub,nonlcon,intcon,options)
fun=objective function
nvars=number of variables
A=Linear inequality constraints, specified as a real matrix.
b=Linear inequality constraints, specified as a real vector.
Aeq and Beq = subjected to linear equalities of the form A*x=B
lb= lower boundary
ub=upper boundary
nonlcon=non linear inequalities
intcon=incidies of integer variable
options=helps to add contraint tolerance by increasing the population size.
Stalagmite Function:
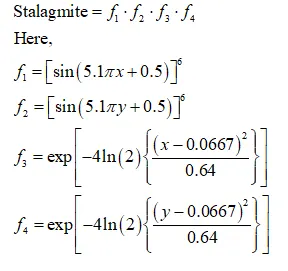
Programme:
Function programme
function [f]=run_stalagmite(input_vector)
f1=(sin(5.1*pi*input_vector(1)+0.5))^6;
f2=(sin(5.1*pi*input_vector(2)+0.5))^6;
f3=exp(-4*log(2)*((input_vector(1)-0.0667)/0.64));
f4=exp(-4*log(2)*((input_vector(2)-0.0667)/0.64));
f=-(f1*f2*f3*f4);
end
Main programme:
clear

close all

clc

% providing the search space for function

x=linspace(0,0.6,150);

y=linspace(0,0.6,150);

[X,Y]=meshgrid(x,y);

num_cases=50; %Number of itreation for which the function will evaluate the fitness

% CREATING THE SURFACE PLOT OF STALAGEMITE FUNCTION

for i=1:length(X)

for j=1:length(Y)

input_vector(1)=X(i,j);

input_vector(2)=Y(i,j);

f(i,j)=run_stalagmite(input_vector); %values of function in given search space

end

end

surfc(X,Y,-f); %generating the surface

shading interp % To remove the lines produced by the mesh grid

% Study1- STATISTICAL BEHAVIOUR (UNBOUNDED)

tic %calculating the study time through tic and toc command

for i=1:num_cases

[inputs,fopt(i)]=ga(@run_stalagmite,2); %calculating the optimized value of the function

xopt(i)=inputs(1); %at each iteration

yopt(i)=inputs(2);

end

study1_time=toc %displaying the time taken to evaluate

% PLOTING THE GRAPH

figure(1)

subplot(2,1,1)

surfc(X,Y,-f);

hold on

shading interp

title('Unbounded Inputs')

plot3(xopt,yopt,-fopt,'marker','o','markersize',5,'markerfacecolor','r');

xlabel('x');

ylabel('y');

grid on

subplot(2,1,2)

plot(-fopt);

xlabel('No of Iterations')

ylabel('Function maximum value')

% Study2 -STATISTICAL BEHAVIOUR (BOUNDED)

tic %calculating the study time through tic and toc command

for j=1:num_cases

[inputs,fopt(j)]=ga(@run_stalagmite,2,[],[],[],[],[0;0],[1;1]); %calculating the optimized value of the function

xopt(j)=inputs(1); %at each iteration with boundation

yopt(j)=inputs(2);

end

study2_time=toc

%PLOTTING

figure(2)

subplot(2,1,1)

hold on

surfc(X,Y,-f)

shading interp

plot3(xopt,yopt,-fopt,'marker','o','markersize',5,'markerfacecolor','r');

xlabel('x');

ylabel('y');

title('Bounded inputs')

grid on

subplot(2,1,2)

plot(-fopt);

xlabel('No of iterations')

ylabel('function maximum value')

% Study3-MODIFYING THE NUMBER OF POPULATION
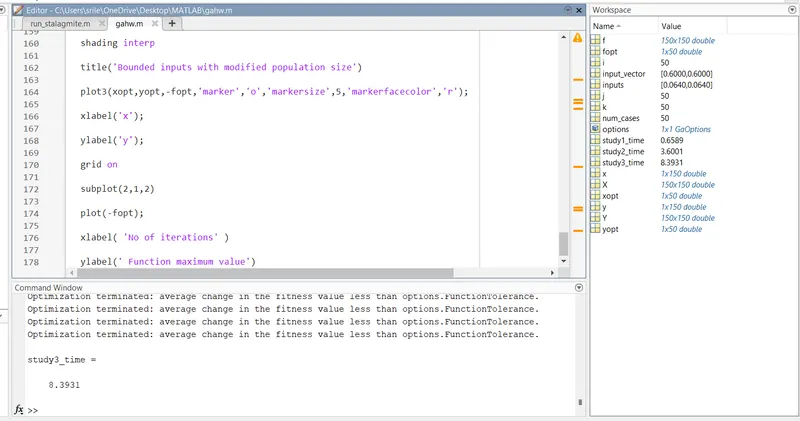
options=optimoptions('ga')

options=optimoptions(options,'populationsize',170) %increaing the sixe of population by using

%optimoptions function

tic

for k=1:num_cases

[inputs,fopt(k)]=ga(@run_stalagmite,2,[],[],[],[],[0;0],[1;1],[],[],options);

xopt(k)=inputs(1);

yopt(k)=inputs(2);

end

study3_time=toc

%PLOTTING

figure(3)

subplot(2,1,1)

hold on

surfc(X,Y,-f)

shading interp

title('Bounded inputs with modified population size')

plot3(xopt,yopt,-fopt,'marker','o','markersize',5,'markerfacecolor','r');

xlabel('x');

ylabel('y');

grid on

subplot(2,1,2)

plot(-fopt);

xlabel( 'No of iterations' )

ylabel(' Function maximum value')
Explanation:
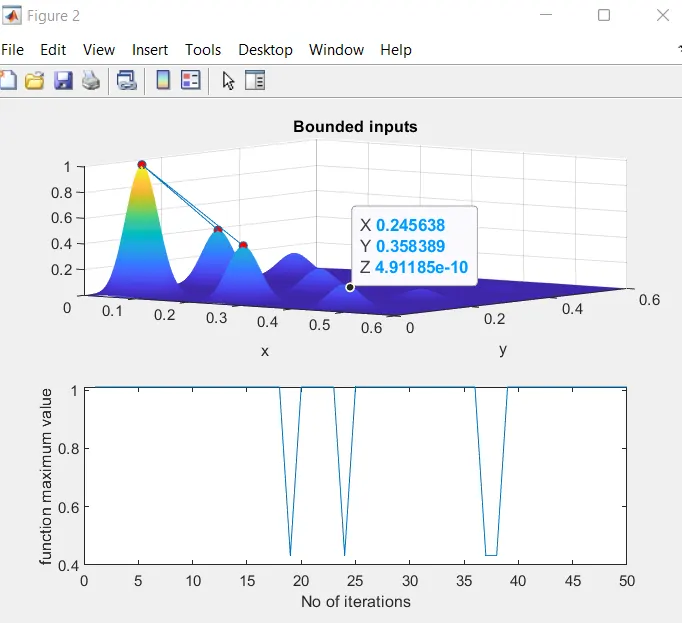
The stalagmite function is coded seperately.-ve sign is used to reverse the plot as we have to find the maximum of the function.X and y two vectors are taken and mesh is creating from the two vectors which will be acting as a search space to find the maxima of the function. Creating the mesh of these two vectors using the "mesh" command and defining the no. of iterations as num_cases to iterate the values of the optimum values of the function.Now calculating the values of fitness function at each point of the mesh grid formed.Now creating its surface through ‘surfc’ command which will also provide the contour of the generated surface.While using surfc applying the -ve sign to the function will generate the surface upside down which is good to get the maxima of the function, as it will provide positive value for the maxima using the -ve sign.
1.STATISTICAL STUDY WITHOUT BOUNDATION:
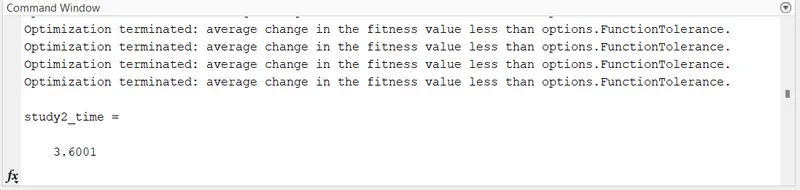
Here we evaluate the optimum value of fitness function at each iteration and calculate it using the ga syntax as show in the programme.Then plotting it into the surf command and also providing the optimum values of the function that how it is varying.Also using the tic and tok command to evaluate the time used for optimizing the function.
2.STATISTICAL STUDY WITH BOUNDATION:
we provide the upper and the lower limit in the ga so that the search space is reduced with the upper and lower boundary.
3.STATISTICAL STUDY WITH INCREASE IN SIZE OF POPULATION:
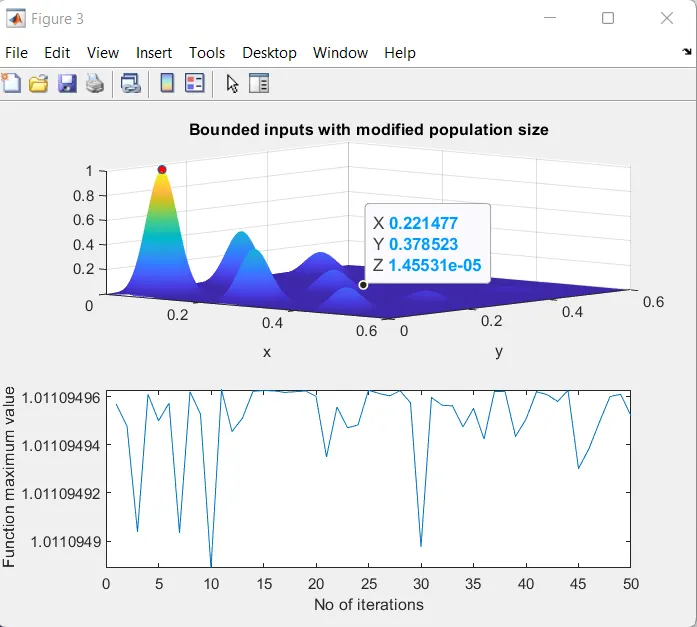
In this study we are using the ‘optimoptions’ command to increase the size of population.The benefit of this commmand will be it will be working on the large set of numbers and which will be led to increase the possibilities of finding the better fitness of the function.
Output:
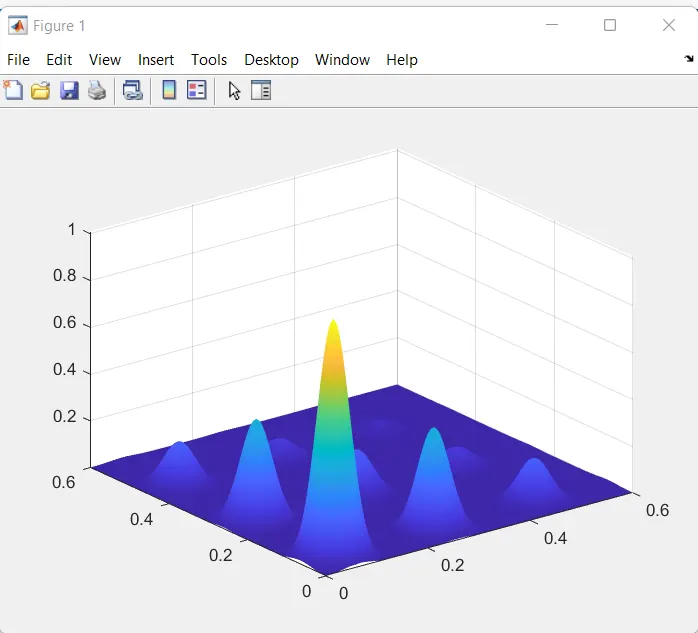
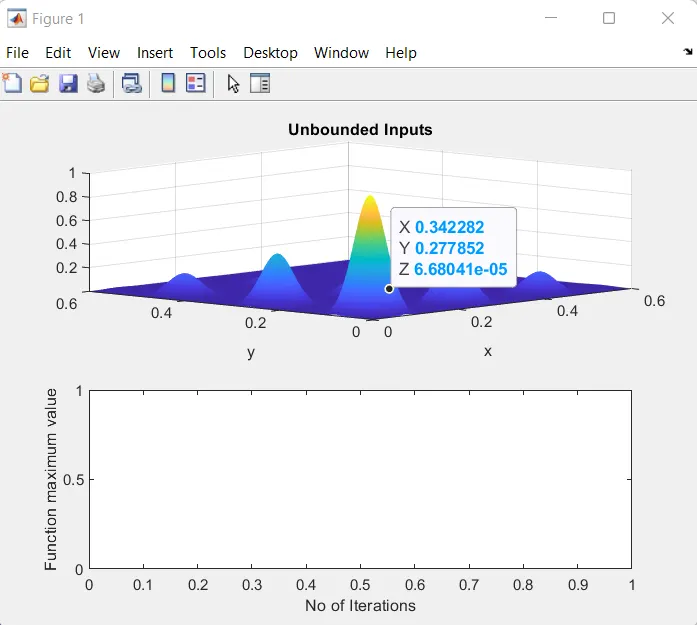
It didnot get iterations plot here.