Project 1 - Parsing NASA thermodynamic data
Aim: To do file parsing of NASA thermodynamic data file.
Objective:
1.To write a code that extracts the 14 co-efficients and calculates the enthalpy, entropy and specific heats for all the species in the data file.
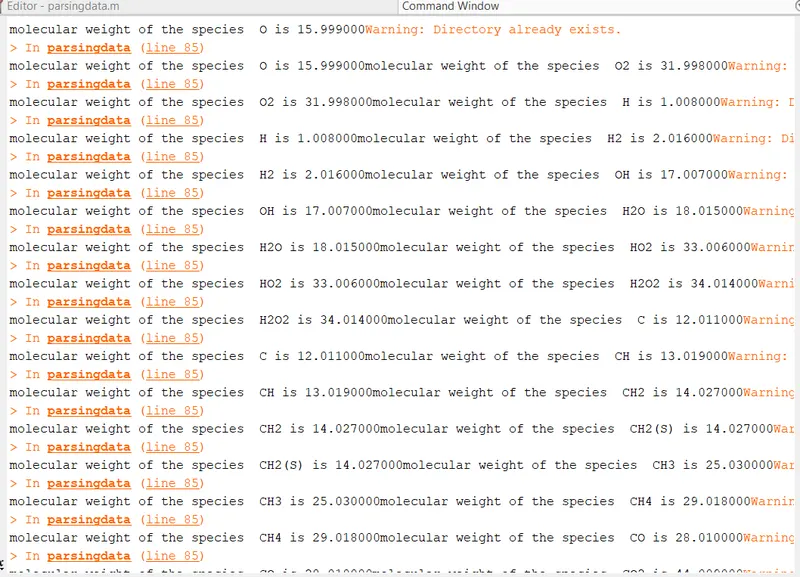
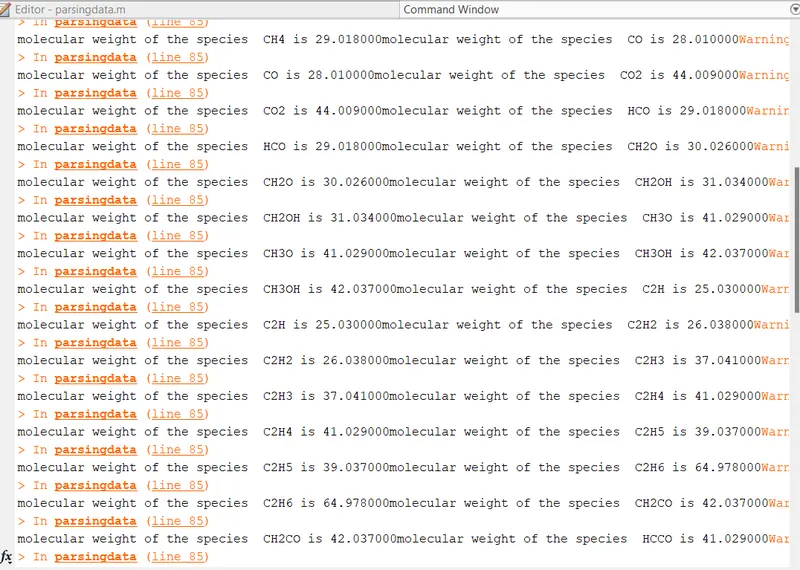
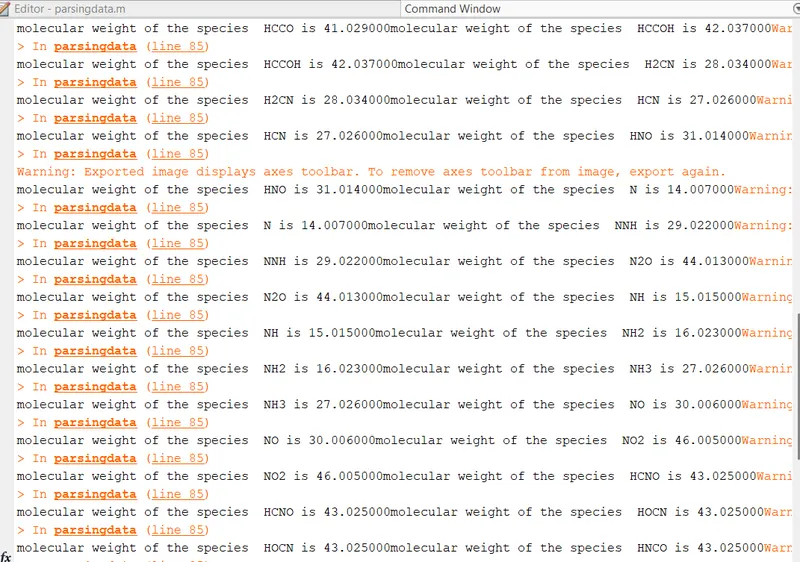
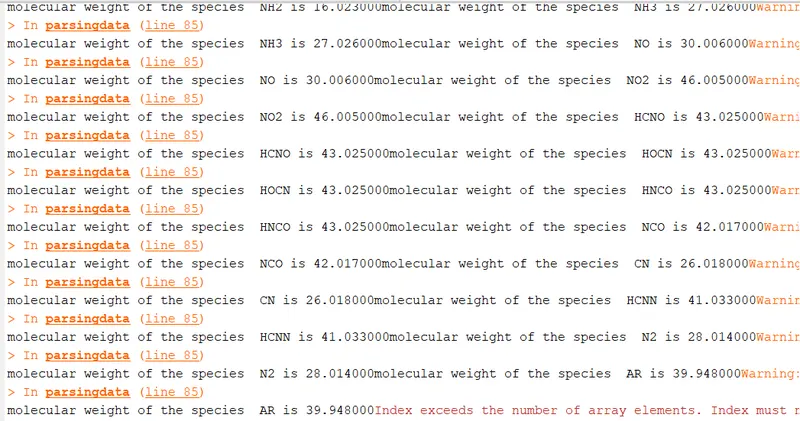
2.To Calculate the molecular weight of each species.
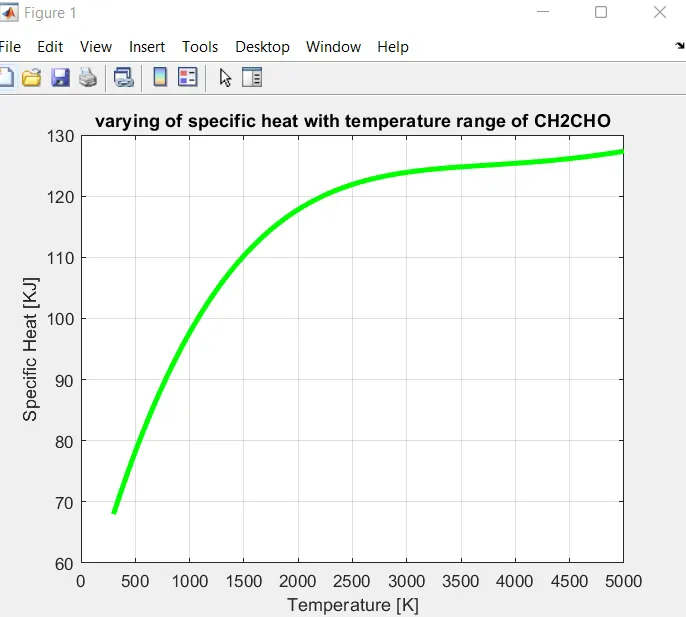
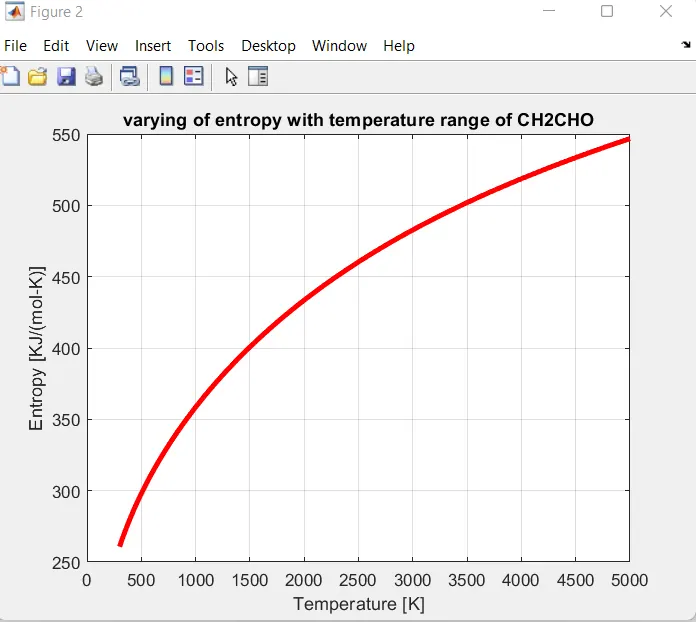
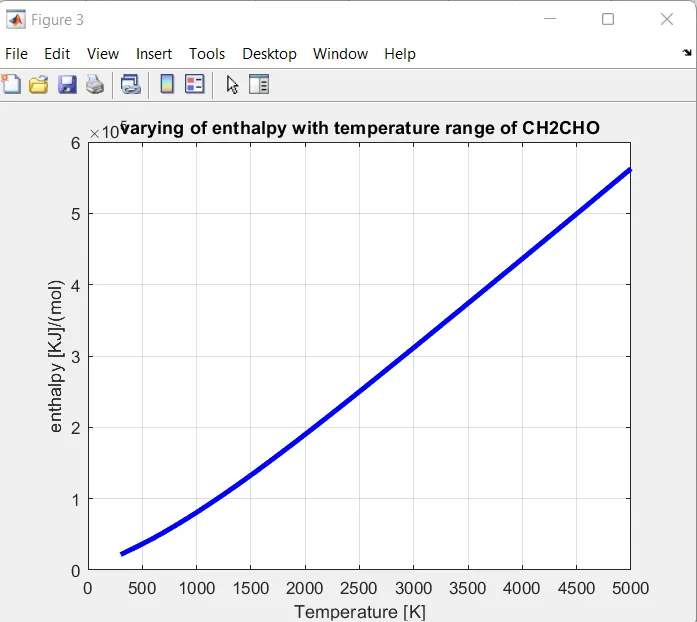
3. Plotting the Cp, Enthalpy and Entropy for the temperature range specific for each species.
Explanation:
clear all,close all,clc commands are used for deleting all the work space variables, closes plot windows and to clear the command window.
Open our data file which has a name as THERMO.dat.fopen command is used to open this file. fopen command is assigned by the variable f1. we assigned variable as it will become easy to call and run the function in future.
In fopen command we are using 'r' means it reads the data only.
fgetl command is used to read the line.
THERMO.dat file
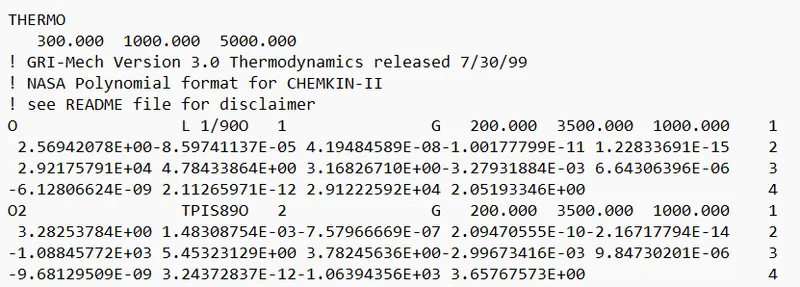
second line in the data file are the global temperatures as we require those values we assign it to a variable.
All the values in data file are strings so we need to convert into the numbers to do further calculations.
strsplit command is used to break the string where the space comes.
The lines starting with '!' are the comments and we skip the next three lines.
In the data file the line that starting with 'O' are the name of the species and there are many such species in this data file.we have to use this species and extract the coefficients from the data file.This coefficients are use to calculate enthalpy,entropy and specific heat.The temperature is defined at the end of the line where species name O is started.
Specific Heat function programme:
function cp=specificheat(a1,a2,a3,a4,a5,a8,a9,a10,a11,a12,temperature,R,local_med_temp)
%compare with global temperatures
%if less than global temperatures minimum coefficients are taken
if (temperature <=local_med_temp)
    cp=R*(a8+(a9*temperature)+(a10*(temperature).^2)+(a11*(temperature).^3)+(a12*(temperature).^4));
else %else maximum coefficients are taken
    cp=R*(a1+(a2*temperature)+(a3*(temperature).^2)+(a4*(temperature).^3)+(a5*(temperature).^4));
end
Entropy Function Programme:
function S=entropy(a1,a2,a3,a4,a5,a7,a8,a9,a10,a11,a12,a14,temperature,R,local_med_temp)
if  (temperature<=local_med_temp)
    S = R*((a8*log(temperature))+(a9*temperature)+(a10*((temperature).^2)/2)+(a11*((temperature).^3)/3)+((a12*(temperature).^4)/4)+a14);
else %else maximum coefficients are taken
    S=R*((a1*log(temperature) + (a2*(temperature))+(a3*(temperature).^2)/2)+(a4*((temperature).^3)/3)+(a5*((temperature).^4)/4)+a7);
end
Enthalpy Function Programme:
function H=enthalpy(a1,a2,a3,a4,a5,a6,a8,a9,a10,a11,a12,a13,temperature,R,local_med_temp)
if (temperature<=local_med_temp)
    H=R*temperature.*(a8+((a9*temperature)/2)+((a10*(temperature).^2)/3)+((a11*(temperature).^3)/4)+((a12*(temperature).^4)/5)+((a13./temperature)));
else % maximum coefficients are taken
    H=R*temperature.*(a1+((a2*temperature)/2)+((a3*(temperature).^2)/3)+((a4*(temperature).^3)/4)+((a5*(temperature).^4)/5)+((a6./temperature)));
end
Molecular weight Function Programme:
function molecularweight=molecular_weight(species_s)
atomic_name=['H','C','O','N','A'];

%standard atomic number
atomic_weight=[1.008 12.011 15.999 14.007 39.948];
% starting range of molecular weight
molecularweight=0;
for i=1:length(species_s)
    for j=1:length(atomic_name)
        if strcmp(species_s(i),atomic_name(j))

      molecularweight = molecularweight+atomic_weight(j);

      position =j;
        end
    end
    n=str2num(species_s(i));
    if n>1
        molecularweight=molecularweight+atomic_weight((position)*(n-1));
    end
end
fprintf('molecular weight of the species  %s is %f',species_s,molecularweight)

end
Main Programme:
clear all
close all
clc

% to read  NASA thermodynamic data file
f1=fopen('THERMO .dat file.txt');
fgetl(f1);
A=fgetl(f1);% reading the header information

% t=strsplit(A,' ');%we are converting strings to number
% global_low_temp=str2double(t{1});
% global_medium_temp=str2double(t{2});
% global_high_temp=str2double(t{3});
%  % Temperature range and gas constant
%  %Temperature range

 R=8.314 ;% Universal gas constant in J/(mol-k)
 %skipping three comment lines
 for i=1:3
     A=fgetl(f1);
 end
 for i=1:53
     A=fgetl(f1);
     B=strsplit(A,' ');
     species_s=B{1};
local_low_temp=str2num(B{end-3});
local_med_temp=str2num(B{end-1});
local_high_temp=str2num(B{end-2});
temperature=linspace(local_low_temp,local_high_temp,1000);
     line_1=fgetl(f1);
     a=strfind(line_1,'E');
     %Extracting high temp coefficients
     a1=line_1(1:a(1)+3);
     a1=str2num(a1);
     a2=line_1(a(1)+4:a(2)+3);
     a2=str2num(a2);
     a3=line_1(a(2)+4:a(3)+3);
     a3=str2num(a3);
     a4=line_1(a(3)+4:a(4)+3);
     a4=str2num(a4);
     a5=line_1(a(4)+4:a(5)+3);
     a5=str2num(a5);

     line_2=fgetl(f1);
     b=strfind(line_1,'E');
     a6=line_2(1:b(1)+3);

     a6=str2num(a6);
     a7=line_2(a(1)+4:b(2)+3);
     a7=str2num(a7);

     %extracting low temp coefficients
     a8=line_2(b(2)+4:b(3)+3);
     a8=str2num(a8);
     a9=line_2(b(3)+4:b(4)+3);
     a9=str2num(a9);
     a10=line_2(b(4)+4:b(5)+3);
     a10=str2num(a10);
     line_3=fgetl(f1);
     c=strfind(line_1,'E');
     a11=line_3(1:c(1)+3);
     all=str2num(a11);
     a12=line_3(c(1)+4:c(2)+3);
     a12=str2num(a12);
     a13=line_3(c(2)+4:c(3)+3);
     a13=str2num(a13);
     a14=line_3(c(3)+4:c(4)+3);
     a14=str2num(a14);
     % specific heat calculations
     cp=specificheat(a1,a2,a3,a4,a5,a8,a9,a10,a11,a12,temperature,R,local_med_temp);

     % entropy calculations
     S=entropy(a1,a2,a3,a4,a5,a7,a8,a9,a10,a11,a12,a14,temperature,R,local_med_temp);
     %enthalpy calculations
     H=enthalpy(a1,a2,a3,a4,a5,a6,a8,a9,a10,a11,a12,a13,temperature,R,local_med_temp);
     %molecular weight of species calculation
     molecularweight=molecular_weight(species_s);
     % read and wright molecular list
%      molecular_list=fopen('molecular_weight.m','a+');
%      fprintf(molecular_list,'molecular weight of %s is %d n',species_s,molecularweight);
%      fclose     (molecular_list);
     %plotting of cp,H,S,temperature,species_s
     % saving as a folder

     mkdir(species_s)
     cd(species_s)

     figure(1)
     plot(temperature,cp,'linewidth',3,'Color','g');
     xlabel('Temperature [K]');
     ylabel('Specific Heat [KJ]');
     title(sprintf('varying of specific heat with temperature range of %s',species_s));
     grid on
     saveas(figure(1),'specific heat.jpg');

     figure (2)
      plot(temperature,S,'linewidth',3,'Color','r');
     xlabel('Temperature [K]');
     ylabel('Entropy [KJ/(mol-K)]');
     title(sprintf('varying of entropy with temperature range of %s',species_s));
     grid on
     saveas(figure(1),'entropy.jpg');

     figure(3)
     plot(temperature,H,'linewidth',3,'Color','b');
     xlabel('Temperature [K]');
     ylabel('enthalpy [KJ]/(mol)');
     title(sprintf('varying of enthalpy with temperature range of %s',species_s));
     grid on
     saveas(figure(1),'enthalpy.jpg');

     cd ..
     M=molecular_weight(species_s);

 end
1.clear all,close all,clc is used to clear all the extra windows ,old data.
2.Then we read THERMO.dat.txt file to calculate specific heat,entropy ,enthalpy and molecular weight.
3.To read the file we assigned a variable f1 in order to get data with respect to global temperature,local temperature and calculations of coefficients of thermodynamic properties.
4.fgetl command is used to access the next line.
5.str2num command is used to convert string to number here first value of temperature is converted to number.
6.Temperature values are assigned to local medium temperature,local high temperature,local low temperature.
7.We have used loop for 3 lines to skip those lose lines that are not useful.
8.strspilt command is used to split the given value in line.
9.Then we have calculated the value for species.
10.Now to convert the local temperature to numbers and to convert complex numbers into cells array/string array we use str2num.
11.Now to store the values of second line of variables we used fgetl command here also but assigned it to the line.
12.strfind command is used to find the value(string) of that particular line.
13.By using str2num command we find the coefficients of 14 species.
14.First 7 species are of high temperature coefficients and next 7 species are of low temperatures.
15.Cp,enthalpy,entropy,molecular weight is calculated.
16.We assumed universal gas constant R as 8.314 KJ/mol-K.
17.After putting all the values of a in respective commands of enthalpy,entropy,specific heat we plot the graphs to see there nature and values.
18.We made folders for saving the plots.
19.mkdir command is used to make the new folder with the name specified inside the brackets.
20.A folder called parsing NASA is created in the working directory which is used to store all the related data of output files of the programme.
21.cd command is used new folder as the directory which is used to store all related output files of the programme.
22.After the programme gets executed cd command helps to return to the original directory.
Plots
Output:

Output:
Reference
https://in.mathworks.com/help/matlab/matlab_prog/parse-function-inputs.html