Week 4.1 - Genetic Algorithm
WHAT IS GA:- GA is one of the optimisation process which is based on Natural selection.In this process we start with random number of inputs and based on the inputs we evaluates the function and then comes natural selection where we take 2 generation,we basically mutate them and we also do crossover and then we creat a new generation which is hopefully better.
SYNTAX FOR GA:-
ga(@stalagmite,2,[],[],[],[],[0,0],[1,1],[],[],options)
ga(fun,nvars,A,b,Aeq,beq,lb,ub,nonlcon,options)
ga - To find the minimum of function using Genetic Algorithm
fun - finds the local minimum to function
nvars - number of variables
A - Linear inequality constraints,specied as real matrix
b - Linear inequality constraints,specified as real vactor
Aeq - Linear equality constraints,specified as a real matrix
beq - Linear equality constraints,specified as a real vector
lb - lower bound
ub - upper bound
nonlcon - Nonlinear constrains,specified as function handle
options - Optimization options,specified as the output
SIGNIFICANCE OF RUNNING MULTIPLE ITERATION:-
By running multiple iteration we get more closer to the result and our accuracy increases.
RESULTS:-
STUDY-1:-
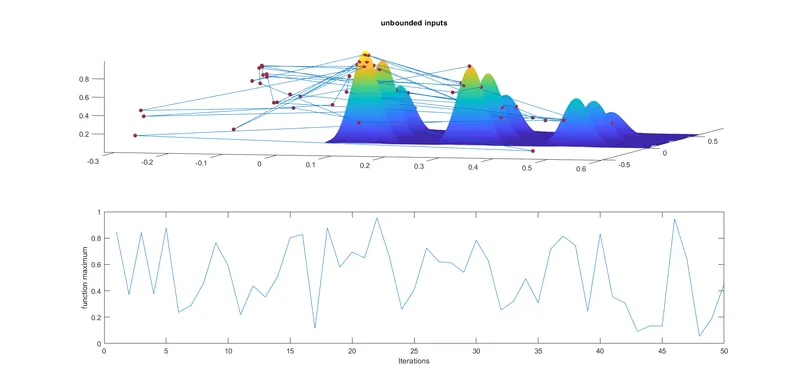
In the plot I am plotting the stalagmite function and then I am plotting the minimum value that 'ga' is trying to predict.In the plot I can see that the minimum value is all over the plot,this is happened because of random sampling.
Each and every time I run the code I get different result
During each iteration minimum value changes between 0 and 1
Time taken by 1st study is 2.13 sec.
STUDY-2:-
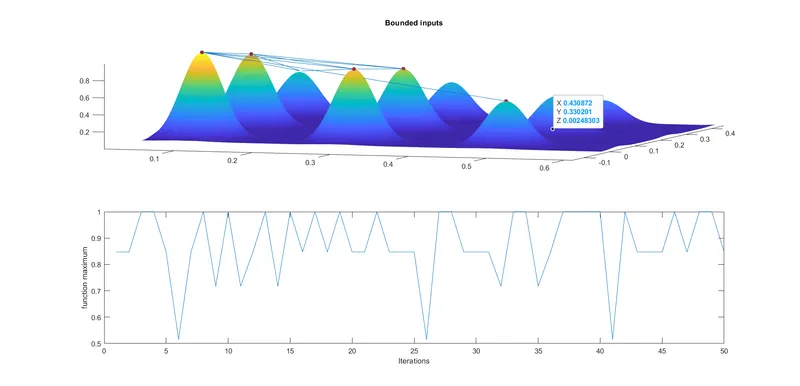
In this plot I can see that the function predict the minimum points between the 5 peaks which is bit more clear than the previous plot.
And the minimum value varies between 0.5 to 1 which is still not clear but we are moving toward the optimal solution.
This time iteration take 3.33 sec which is more than 1st study.
STUDY-3:-
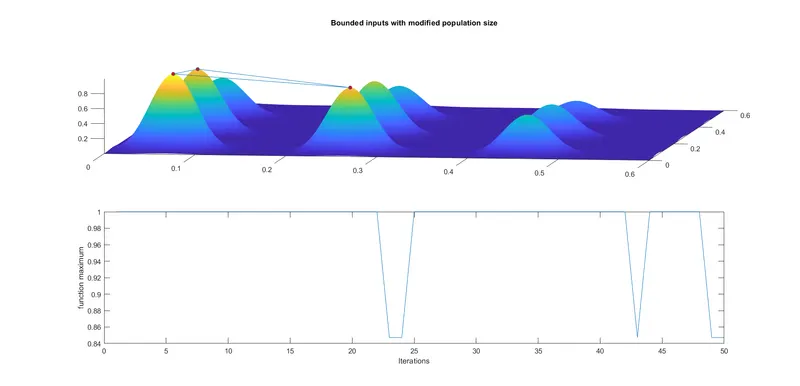
In this study the minimun value is always falling in between 3 peaks.
And in the graph you can find the minimum value is always equal to 1 except 3 iteration.
So only in 3 instances ga actually predict that 3rd peak is the maximum value.
STOPPING CRITERIA :-
when there has no improvement in the population for X iterations.
-when we reach the maximun no of generations.
-when the objective function value has reached certaion predefined value.
LINKS AND REFERENCES:-
https://skill-lync.com/knowledgebase/genetic-algorithm-explained
https://in.mathworks.com/help/gads/ga.html#d123e48598
https://in.mathworks.com/help/gads/how-the-genetic-algorithm-works.html
% optimisation of stalagmitefunction to find global Maxima

clearvars
close all
clc

% defining our search space
x=linspace(0,0.6,150);
y=linspace(0,0.6,150);
num_cases=50;

% creating 2D mesh
[xx,yy]=meshgrid(x,y);

% evaluating the stalagmite function
for i=1:length(xx)
    for j=1:length(yy)
        input_vector(1)=xx(i,j);
        input_vector(2)=yy(i,j);
        f(i,j)=stalagmite(input_vector);
    end
end

% study1-stalagmite behaviour
% use of tic toc command to measure the time required for iteration
tic
for i=1:num_cases
    [inputs,fopt(i)]=ga(@stalagmite,2);
    xopt(i)=inputs(1);
    yopt(i)=inputs(2);
end

study_1_time=toc

% plotting
figure(1)
subplot(2,1,1)
hold on
surfc(x,y,-f)
shading interp
plot3(xopt,yopt,-fopt,'Marker','o','MarkerSize',5,'MarkerFaceColor','r')
title('unbounded inputs')
subplot(2,1,2)
plot(-fopt)
xlabel('Iterations')
ylabel('function maximum')


% study2-statistical behaviour-with upper and lower bounds
tic
for i=1:num_cases
    [inputs,fopt(i)]=ga(@stalagmite,2,[],[],[],[],[0,0],[1,1]);
    xopt(i)=inputs(1);
    yopt(i)=inputs(2);
end

study_2_time=toc

% plotting the graph
figure(2)
subplot(2,1,1)
hold on
surfc(x,y,-f)
shading interp
plot3(xopt,yopt,-fopt,'Marker','o','MarkerSize',5,'MarkerFaceColor','r')
title('Bounded inputs')
subplot(2,1,2)
plot(-fopt)
xlabel('Iterations')
ylabel('function maximum')


% study3-Incresing GA Iteration
options=optimoptions('ga');
options=optimoptions(options,'populationsize',170);
tic
for i=1:num_cases
    [inputs,fopt(i)]=ga(@stalagmite,2,[],[],[],[],[0,0],[1,1],[],[],options);
    xopt(i)=inputs(1);
    yopt(i)=inputs(2);
end

study_3_time=toc

% plotting the graph
figure(3)
subplot(2,1,1)
hold on
surfc(x,y,-f)
shading interp
plot3(xopt,yopt,-fopt,'Marker','o','MarkerSize',5,'MarkerFaceColor','r')
title('Bounded inputs with modified population size')
subplot(2,1,2)
plot(-fopt)
xlabel('Iterations')
ylabel('function maximum')