Project 1 - Parsing NASA thermodynamic data
SPECIFIC HEAT FUNCTION:-
% specific heat calculation function

function Cp=specificheat(a1,a2,a3,a4,a5,a8,a9,a10,a11,a12,Temp,R,global_medium_temp)
% Comparing with global temperature
% If less than global temperature- minimum coefficient are taken
if Temp<=global_medium_temp
    Cp=R*(a8+(a9*Temp)+(a10(Temp).^2)+(a11*(Temp).^3)+(a12*(Temp).^4));
else
    Cp=R*(a1+(a2*Temp)+(a3*(Temp).^2)+(a4*(Temp).^3)+(a5*(Temp).^4));
    % Else maximum coefficient are taken
end
ENTHALPY FUNCTION:-
% Enthalpy calculation function

function H=Enthalpy(a1,a2,a3,a4,a5,a6,a8,a9,a10,a11,a12,a13,Temp,R,global_medium_temp)
% comparing with global temp
% If less than global temperature-minimum coefficients are taken

if Temp<=global_medium_temp
    H=R*Temp.*(a8+((a9*Temp)/2)+((a10*(Temp).^2)/3)+((a11*(Temp).^3)/4)+((a12*(Temp).^4)/5)+(a13./Temp));
else
% Else maximum coefficient are taken
H=R*Temp.*(a1+((a2*Temp)/2)+((a3*(Temp).^2)/3)+((a4*(Temp).^3)/4)+((a5*(Temp).^4)/5)+(a6./Temp));
end
ENTROPY FUNCTION:-
% Entropy Calculation function

function S= Entropy_calc(a1,a2,a3,a4,a5,a7,a8,a9,a10,a11,a12,a14,Temp,R,global_medium_temp)
% comparing with global temperature
% If less than global temperature- minimum coefficients are taken
if Temp<=global_medium_temp
    S=R.*(a8.*log(Temp)+(a9.*Temp)+(a10*((Temp).^2)/2)+(a11*((Temp).^3)/3)+(a12*((Temp).^4)/4)+a14);
else

    % Else -maximum coefficient are taken
    S=R.*(a1.*log(Temp)+(a2.*Temp)+(a3*((Temp).^2)/2)+(a4*((Temp).^3)/3)+(a5*((Temp).^4)/4)+a7);
end
MOLECULAR WEIGHT FUNCTION:-
% Molecular weight calculation function

function Molecularweight=Molecular_weight(Species_SP)

Elements = ['H','C','O','N','A'];

Atomic_mass=[1.008 12.011 15.999 14.007 39.948];

% Starting condition
Molecularweight=0;


for i=1:length(Species_SP)
    for j=1:length(Elements)
        if strcmpi(Species_SP(i),Elements(j))
            Molecularweight=Molecularweight+Atomic_mass(j);
            position=j;

        end
    end
    n=str2double(Species_SP(i));

    if n>1

       Molecularweight=Molecularweight+Atomic_mass(position)*(n-1);

    end
end
MAIN CODE:-
% Parsing NASA Thermodynamic data
clearvars
close all
clc


% reading the  NASA thermodynamic data file
f1=fopen('THERMO.dat','r');
gt=fgetl(f1);

% obtaining the global temperature by reading header information
global_temp=fgetl(f1);

% spliting the string
t=strsplit(global_temp);

% converting string value to number value by str2num
global_low_temp=str2double(t{2});
global_mid_temp=str2double(t{3});
global_high_temp=str2double(t{4});

% Temperature Ranges and gas constant
Temp=linspace(global_low_temp,global_high_temp,1000);
R=8.314;         % in [j/mol-K]

% neglecting the 3 comment line in the file
for i=1:3
   gt=fgetl(f1);
end

for i=1:53
    gt=fgetl(f1);
    A=strsplit(gt,' ');
    Species_SP=(A{1});

    line_1=fgetl(f1);
    a=strfind(line_1,'E');

    % Extracting higher and lower temp coefficients

    % Extracting first 7 coefficient i.e HIGH-temperature coefficient
    a1=line_1(1:a(1)+3);
    a1=str2double(a1);

    a2=line_1(a(1)+4:a(2)+3);
    a2=str2double(a2);

    a3=line_1(a(2)+4:a(3)+3);
    a3=str2double(a3);

    a4=line_1(a(3)+4:a(4)+3);
    a4=str2double(a4);

    a5=line_1(a(4)+4:a(5)+3);
    a5=str2double(a5);


    line_2=fgetl(f1);
    b=strfind(line_2,'E');

    a6=line_2(1:b(1)+3);
    a6=str2double(a6);

    a7=line_2(b(1)+4:b(2)+3);
    a7=str2double(a7);

    % Extracting second 7 coefficient i.e Low Temperature coefficient

    a8=line_2(b(2)+4:b(3)+3);
    a8=str2double(a8);

    a9=line_2(b(3)+4:b(4)+3);
    a9=str2double(a9);

    a10=line_2(b(4)+4:b(5)+3);
    a10=str2double(a10);

    line_3=fgetl(f1);
    c=strfind(line_3,'E');

    a11=line_3(1:c(1)+3);
    a11=str2double(a11);

    a12=line_3(c(1)+4:c(2)+3);
    a12=str2double(a12);

    a13=line_3(c(2)+4:c(3)+3);
    a13=str2double(a13);

    a14=line_3(c(3)+4:c(4)+3);
    a14=str2double(a14);

    % specific heat calculation
     Cp=specificheat(a1,a2,a3,a4,a5,a8,a9,a10,a11,a12,Temp,R,global_mid_temp);

     % Enthalpy calculation
     H=Enthalpy(a1,a2,a3,a4,a5,a6,a8,a9,a10,a11,a12,a13,Temp,R,global_mid_temp);

     % Entropy calculation
     S=Entropy_calc(a1,a2,a3,a4,a5,a7,a8,a9,a10,a11,a12,a14,Temp,R,global_mid_temp);


% plotting(CP,H,S,Temp,Species_SP)
% saving as folder

cur_dir=pwd;
mkdir(Species_SP);
cd(Species_SP);


% Plot 1, Specific heat (Cp) vs TEmperature Range (Temp)
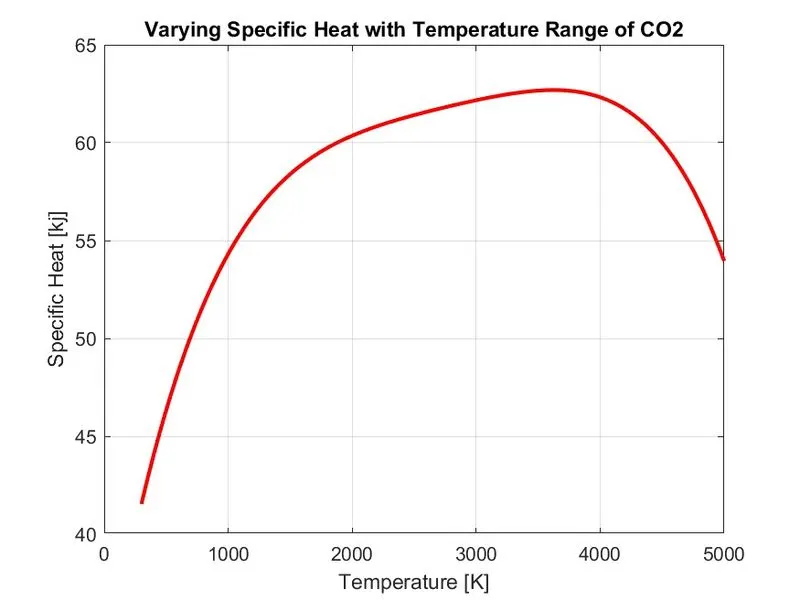
figure(1)
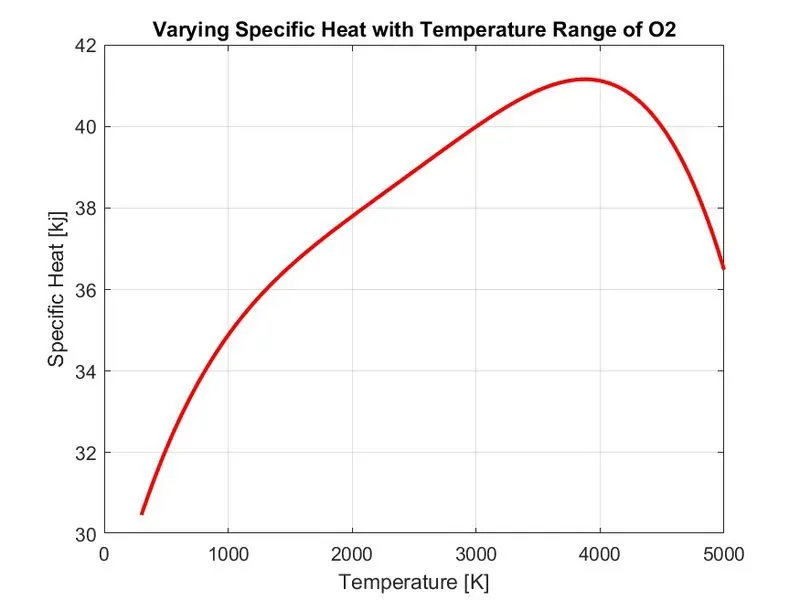
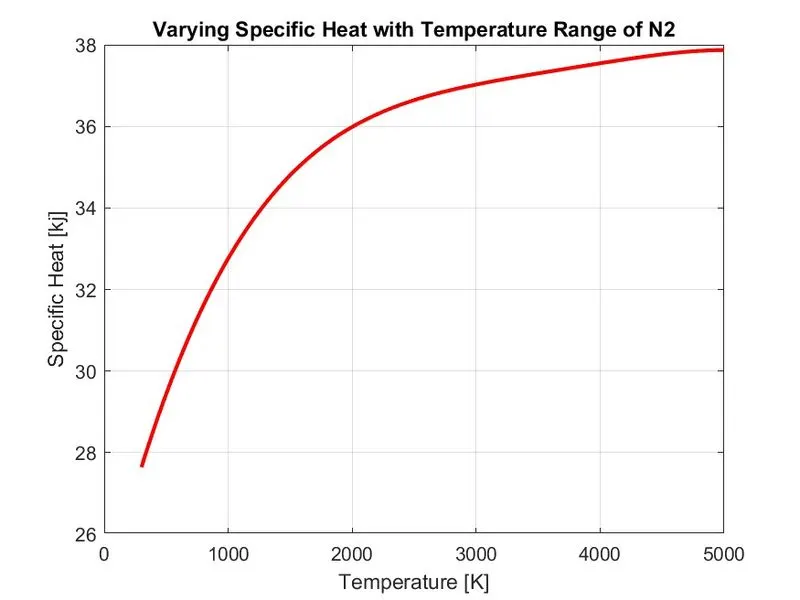
plot(Temp,Cp,'linewidth',2,'color','r')
xlabel('Temperature [K]')
ylabel('Specific Heat [kj]')
title(sprintf('Varying Specific Heat with Temperature Range of %s',Species_SP))
grid on
saveas(figure(1),'Specific Heat.jpg')

% plot 2,Enthalpy(H) vs temperature range (Temp)
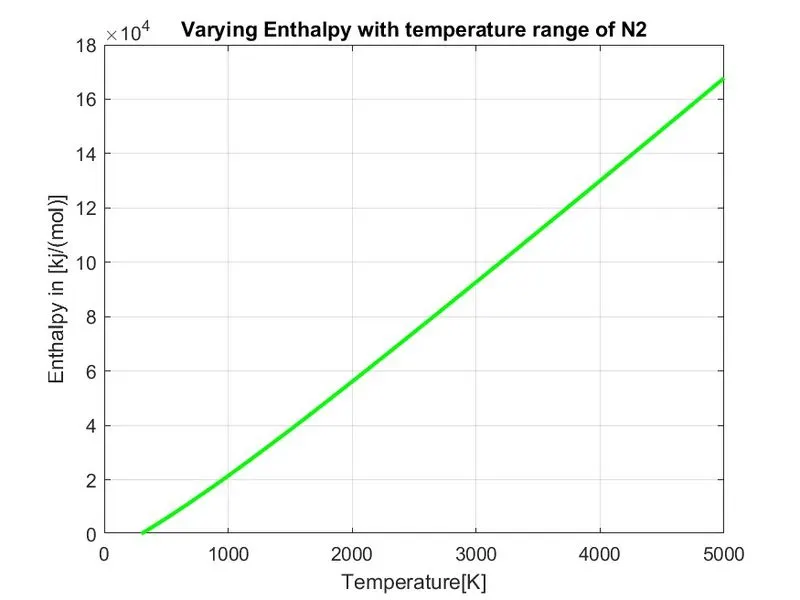
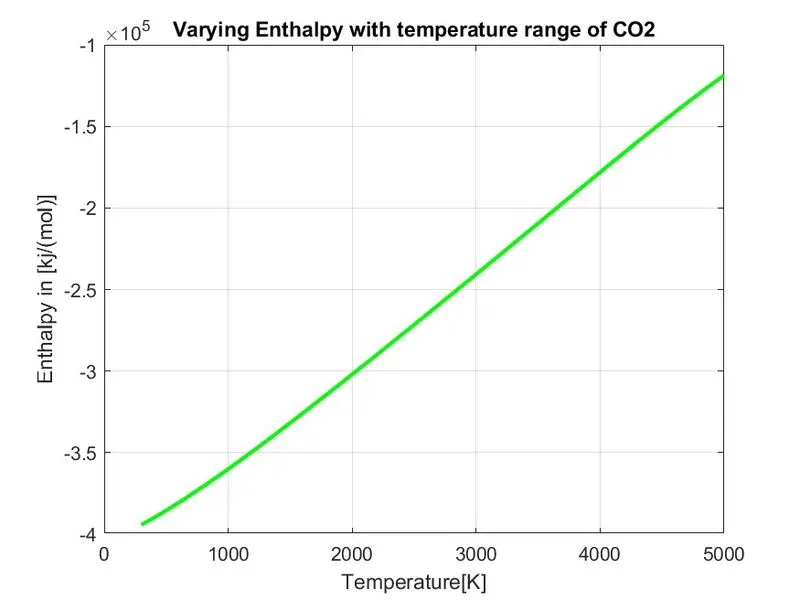
figure(2)
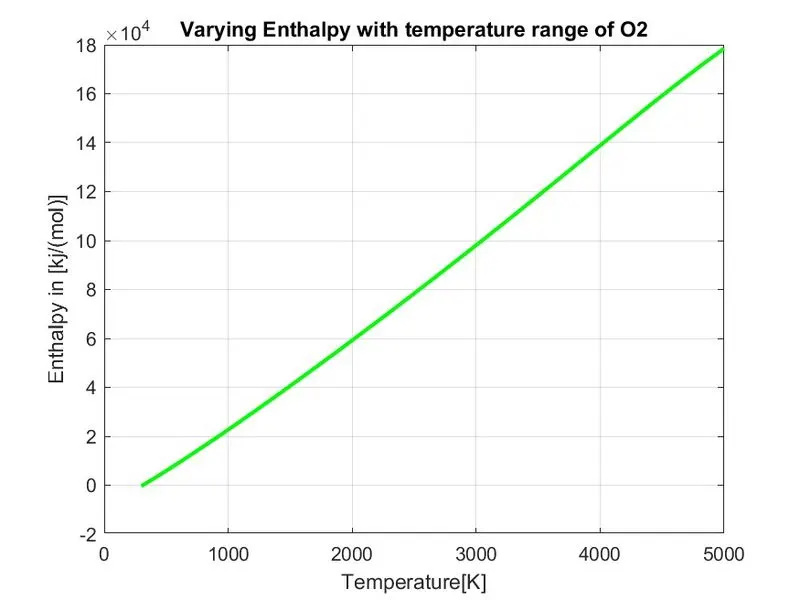
plot(Temp,H,'linewidth',2,'color','g')
xlabel('Temperature[K]')
ylabel('Enthalpy in [kj/(mol)]')
title(sprintf('Varying Enthalpy with temperature range of %s',Species_SP))
grid on
saveas(figure(2),'Enthalpy.jpg')

% plot 3,Entropy (S) vs Temperature Range (Temp)
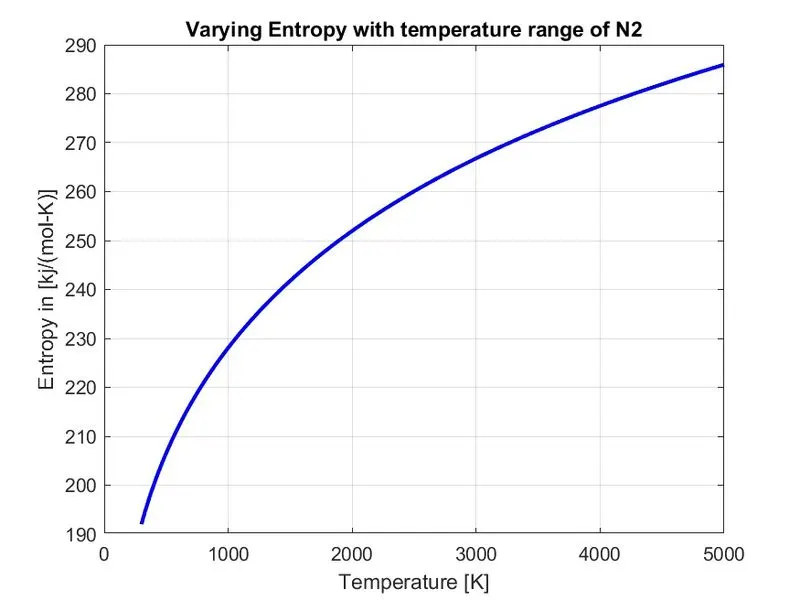
figure(3)
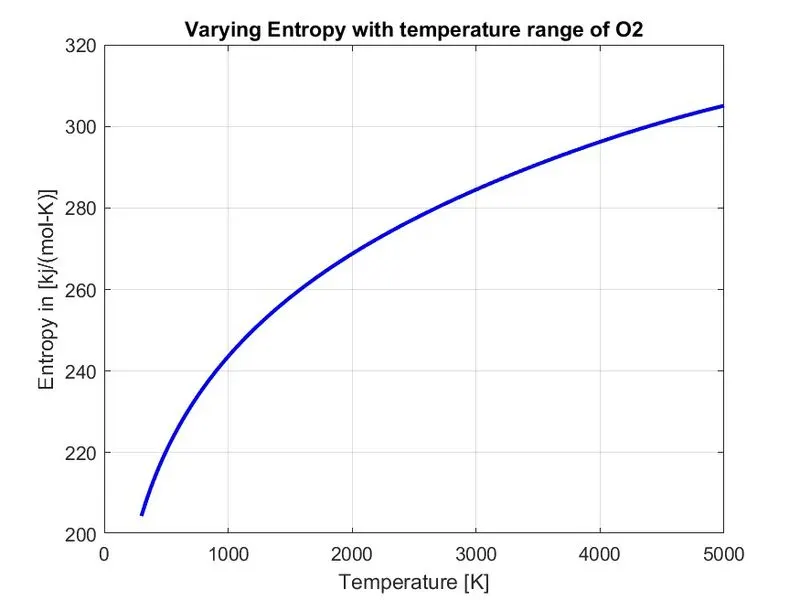
plot(Temp,S,'linewidth',2,'color','b')
xlabel('Temperature [K]')
ylabel('Entropy in [kj/(mol-K)]')
title(sprintf('Varying Entropy with temperature range of %s',Species_SP))
grid on
saveas(figure(3),'Entropy.jpg')

cd(cur_dir);

% Molecular weight

M=Molecular_weight(Species_SP);

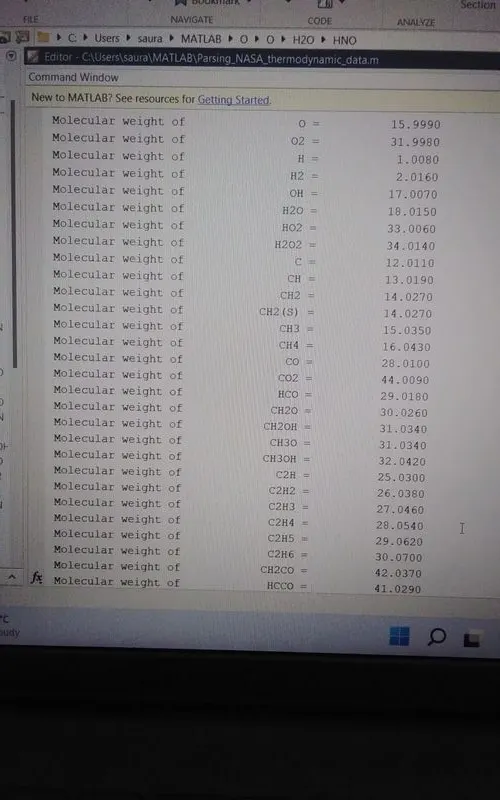
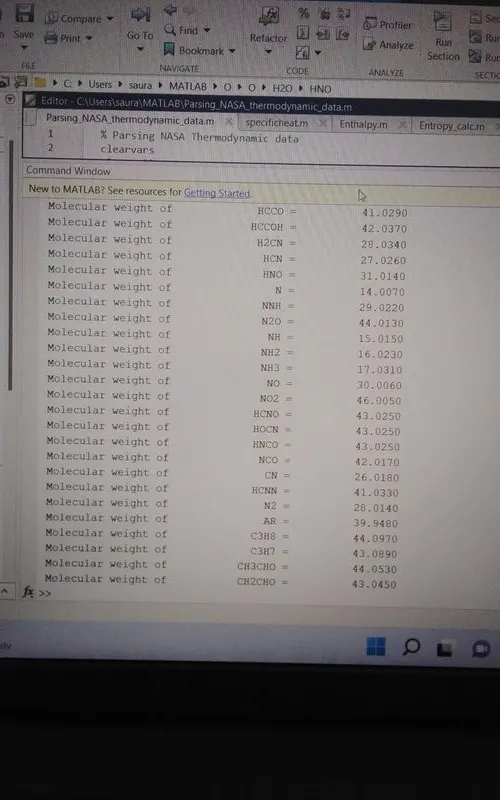
fprintf(' %16s %16s = %16.4f\n','Molecular weight of',Species_SP,M);

end
ATTACHEMENTS:-
Folders screenshot:-

Plots of O2,N2 &CO2:-
O2:-
Specific Heat:-
Enthalpy:-
Entropy:-
N2:-
Specific Heat:-
Enthalpy:-
Entropy:-
CO2:-
Specific Heat:-
Enthalpy:-
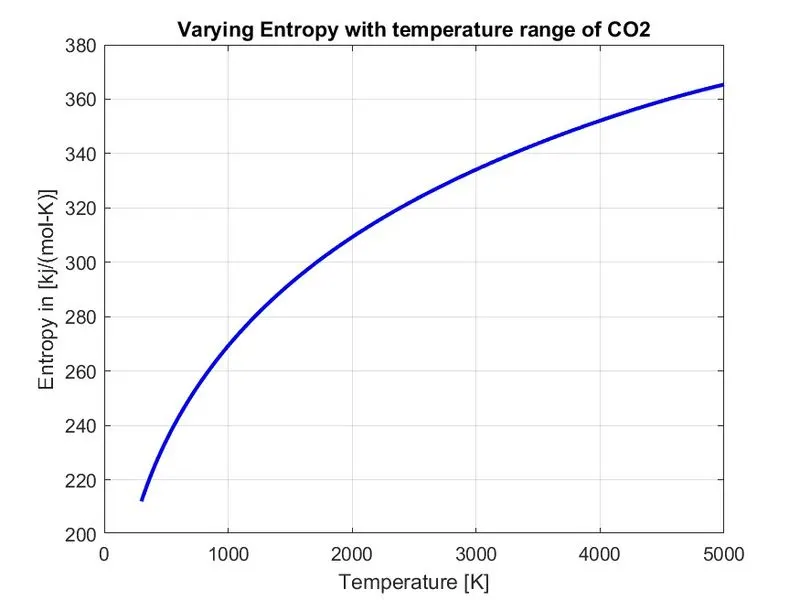
Entropy:-
Molecular Weight:-
REPORT:-
- Clearvars,closeall,clc command clear all the previous variable of workspace,close all the plots and clear the the command window for the new data.
-fopen for opening the file and and 'r' for reading the file
-fgetl to get the first line of the file
-strsplit to split the large string value into small
-str2double to convert string into number value
-strfind to find character into string
-mkdir to make new folder
-dir to make the list of content in the folder
-cd to change the current folder
-plot for plotting the graph of given data
-xlabel & ylabel to give X & Y label to graph
-title to give the title to the graph
-sprintf to format the data into string vector
-saveas to save the figure as given format
-fprintf to print the values
EXPLANATION:-
I have first clear all the working invironment for new values and tables,then I open the 'THERMO.dat' file and read it and intially get the first line which is the name of file ,after that I get the second file which is the string with global temperature values,then I split that stirng into small string with delimiter after that I convert that string into number values so that I can use that values for further use .
Then I neglected first three lines of the file which are the comments,then I created 'for loop' for extracting the values of Fifty Three Species from the file data and draw the plot of this data also make the specific folder of that plots for all the species and store them into seperate folder.
I also write the function code for Specific Heat,Enthalpy,Entropy & Molecular Weight and call them into main code.
Note:-I have faced some errors but those was silly so I do not mention them in report.
REFERENCES:
-MATLAB Documentation section
-Help video on Project
-Mathwork site