Week 4.1 - Genetic Algorithm
GENETIC ALGORITHM USING MATLAB
FUNCTION CODE
%define stlagmite function
function [f] = get_stalagmite(input)
x = input(1);
y= input(2);
%   Detailed explanation goes here
f1 =(sin(5.1.*pi.*x+0.5)).^6;
f2 =(sin(5.1.*pi.*y+0.5)).^6;
f3 =exp(-4.*log(2).*(x-0.0667).^2/0.64);
f4 =exp(-4.*log(2).*(y-0.0667).^2/0.64);
f = -(f1.*f2.*f3.*f4);
end
MAIN CODE
clear all
close all
clc

x=linspace(0,0.6,150);
y=linspace(0,0.6,150);
num_cases=50;
%creating 2Dmesh
[xx,yy]=meshgrid(x,y);


%evaluate stalagmite funtion
for i=1:length(xx)
    for j= 1:length(yy)
        inputs(1)=xx(i,j);
        inputs(2)=yy(i,j);
        f(i,j)= get_stalagmite(inputs);
    end
end


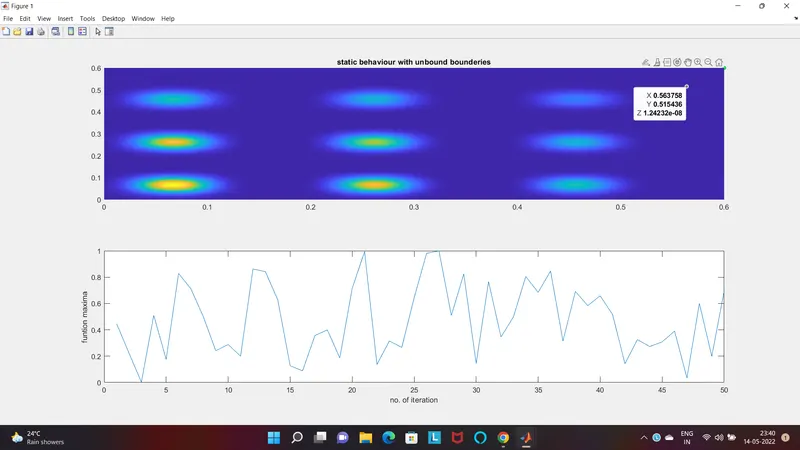
%study 1- Statical behaviour
tic
for i=1: num_cases
[inputs,fopt(i)]=ga(@get_stalagmite,2);
  xopt(i)=inputs(1);
  yopt(i)=inputs(2);
end

study1_time=toc;


%plotting

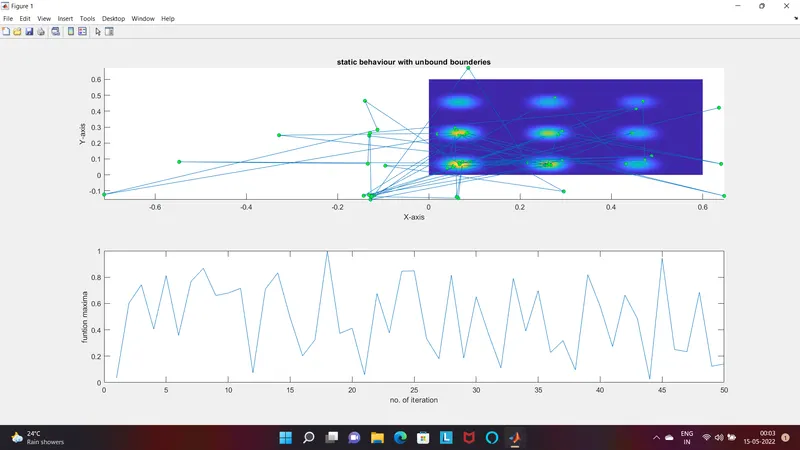
figure(1)
subplot(2,1,1)
hold on
surfc(xx,yy,-f)
shading interp
xlabel('X-axis')
ylabel('Y-axis')
plot3(xopt,yopt,-fopt,'Marker','o','MarkerSize',5,'MarkerFaceColor','g')
title('static behaviour with unbound bounderies')
subplot(2,1,2)
plot(-fopt)
xlabel('no. of iteration')
ylabel('funtion maxima')


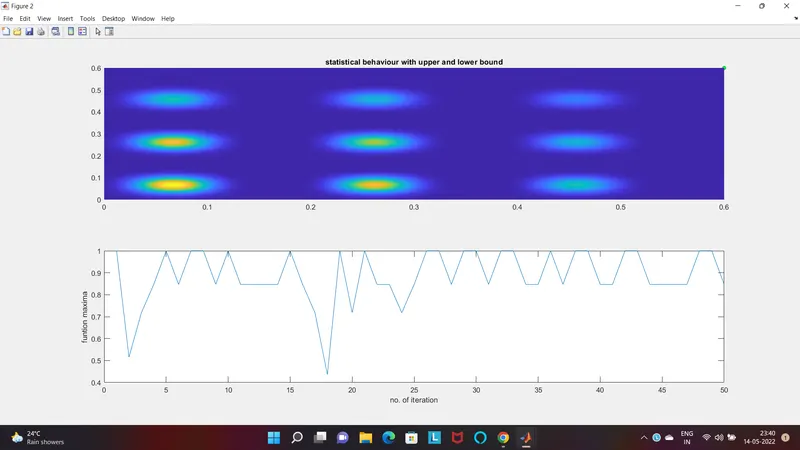
%study 2- Statistical behaviour with upper and lower bound
tic
for i=1: num_cases
[inputs,fopt(i)]=ga(@get_stalagmite,2,[],[],[],[],[0;0],[1;1]);
  xopt(i)=inputs(1);
  yopt(i)=inputs(2);
end

study2_time=toc;
%plotting


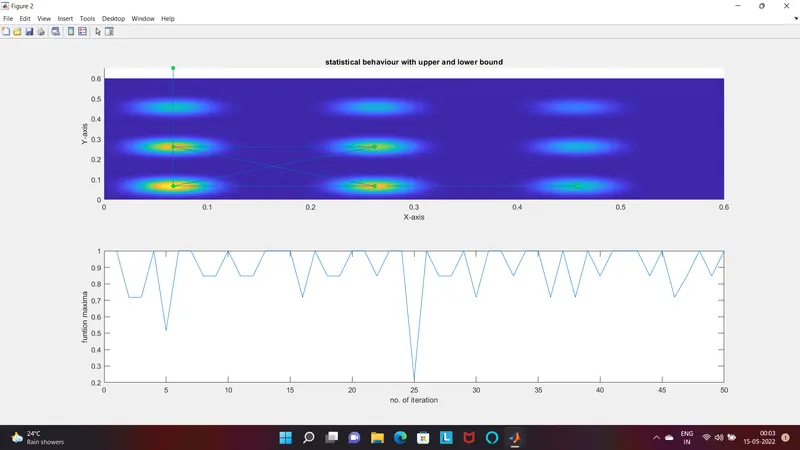
figure(2)
subplot(2,1,1)
hold on
surfc(xx,yy,-f)
shading interp
xlabel('X-axis')
ylabel('Y-axis')
plot3(xopt,yopt,-fopt,'Marker','o','MarkerSize',5,'MarkerFaceColor','g')
title('statistical behaviour with upper and lower bound')
subplot(2,1,2)
plot(-fopt)
xlabel('no. of iteration')
ylabel('funtion maxima')


%study 3-statistical behaviour with increace in iteration of GA
options = optimoptions('ga');
options = optimoptions(options,'populationsize',300);
tic

for i=1: num_cases
[inputs,fopt(i)]=ga(@get_stalagmite,2,[],[],[],[],[0;0],[1;1],[],[],options);
  xopt(i)=inputs(1);
  yopt(i)=inputs(2);
end

study3_time=toc;


%plotting


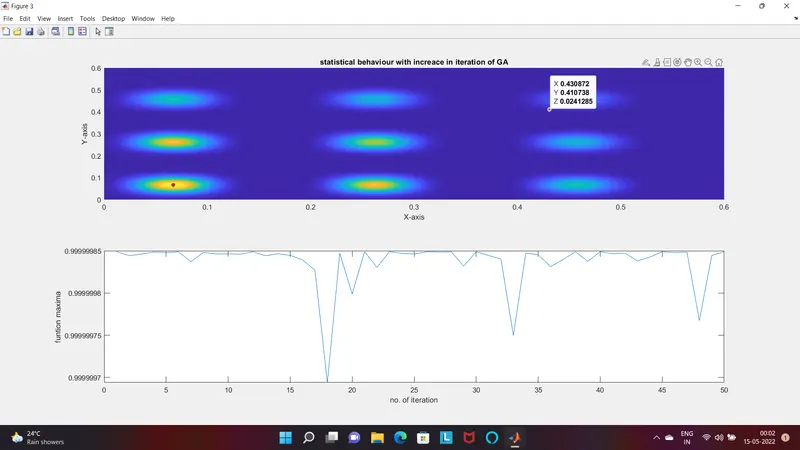
figure(3)
subplot(2,1,1)
hold on
surfc(xx,yy,-f)
shading interp
xlabel('X-axis')
ylabel('Y-axis')
plot3(xopt,yopt,-fopt,'Marker','o','MarkerSize',5,'MarkerFaceColor','r')
title('statistical behaviour with increace in iteration of GA')
subplot(2,1,2)
plot(-fopt)
xlabel('no. of iteration')
ylabel('funtion maxima')
RESULTS
1.
2.
3.
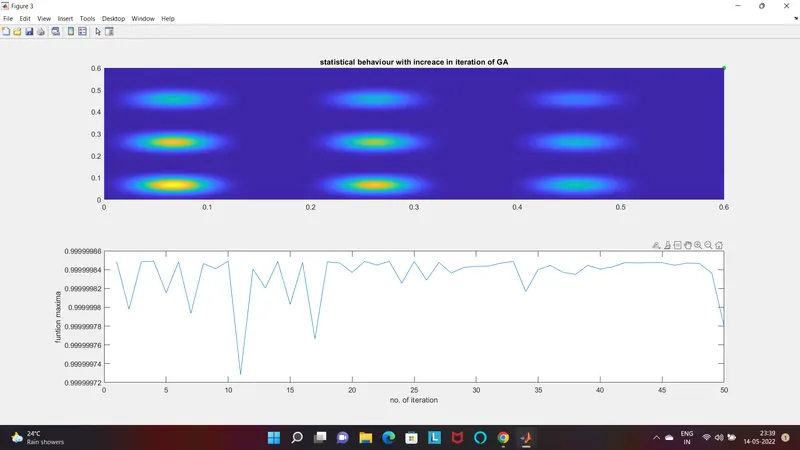
ERROR
when i wrote
REPORT
Genetic algorithm
The concept of genetic algorithm(ga) work on the natural selection where the surviver of ther fittest to creat nxt generation.It includes constrained and unconstrained optimization that based on the natural selection.The algorithm is initialy creating a random initial population of induvidual selection of population and modifying this population and creating a sequence of new population. Over sucssesive generation the population evolves towards an optimal solution.
The genetic algorithm use three main type of rule
- selection
- cross over
- mutation.
SYNTAX OF GENETIC ALGORITHM
The syntax of ga in matlab is used to find the minimum of funtion using genetic algorithm. the different ways of defining the syntax ga is as follows
1. x=ga(func,nvars)
- x= optimal variables
- func= objective function
- nvars= number of variables
2. x=ga(func,nvars,A,B,Aeq,Beq,lb,ub)
- A,B = linear inequality constraints
- Aeq,Beq=linear equality constraints
if there are no linear equalities and inequalities then A,B, Aeq,Beq are set of []
3. x=ga(func,nvars,A,B,Aeq,Beq,lb,ub,nonicon,intCon,options)
- nonicon=nonlinear contsraints
- intCon =integer values
- options=optimization options
if there are non linear constrsins and integrs values , the nonicon and intcon are set of []
First of all we need to define stalagmite function in a different script. The negative sign in the function will invert the stalagmite plot which will eventually gives the funtion maxima
- clear all, clear the data stored in the workspace
- close all, closes all the plots and figures
- clc,clear the command window
After preparing thr input needed for the funtion next step is to obtain the result for three cases such as unbounfd ,upper and lower bound,incrasing the iteration.This is done by for llop and the ga syntax
tic & toc -coomand used to know the time taken to solve 50 iteration
surfc-command to plotting the loop created by the funtion
shade intrep- to neglect the gridlines on the surface obtain
subplot(2,1,1) -used to plot multiple plots on same figure which also divids figure in grid of 2x1 and axes to be placed at 1
plot3-command plots the 3D points at xopt,yopt and optimum value of function
[0;0],[1;1]-in oder to restrict the program within specific bounder v use this code
Thus we take the 3 studyies and find the optimum statical behaviour of genetical algorithm