Week 4.1 - Genetic Algorithm
clear all- used for clear all the data stored in previous workspace
close all- used for colse the all the figures and plots of before program
clc-use for clear the command window
meshgrid -command is used for generate the 2Dimentional matrix with the values[xx yy] of x and y
for loop is used for repatative vector data formation and executed by calling hyperlink functional code for stalagmite
surfc(xx,yy,f)-command used for generating the surface of (xx,yy,f)
shading intrp-command is used for removing the grids on the surface
ga-Find minimum of function using genetic algorithm
tic-starts a stopwatch timer.
toc-prints the elapsed time since
tic was used.study_time_2= toc- returns the elapsed time
[inputs Fopt(i)]=ga(@stalagmite_func,2,[],[],[],[],[0,0],[1,1])
syntax of above line :-
x = ga(fun,nvars,A,b,Aeq,beq,lb,ub,nonlcon,intcon, options)the above line reprasents the "finds a local minimum inputs to
fun,subject to the linear inequalities A*x ≤ b. ga evaluates the matrix product A*x as if x is transposed (A*x'), Set A=[] and b=[] if no linear inequalities exist, Set nonlcon=[] if no nonlinear constraints exist.) Create options using optimoptions and ga evaluates the matrix product.marker- command use for highlight the point
MarkerFaceColor-command used for coloring the highlighted point which are shown in result figiure
code
clear all
close all
clc

x=linspace(0,0.6,150);
y=linspace(0,0.6,150);

[xx, yy]=meshgrid(x,y);

for i=1:length(xx)

    for j=1:length(yy)
    input_vector(1)=xx(i,j);
    input_vector(2)=yy(i,j);
    f(i,j) = stalagmite_func(input_vector);

    end
end

surfc(xx,yy,f)
shading interp
xlabel('x-axis')
ylabel('y-axis')
[x_outputs, fval] = ga(@stalagmite,2);
Output
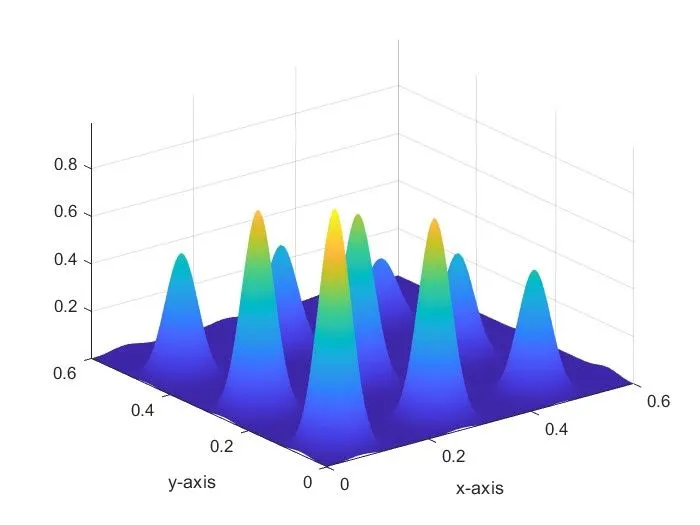
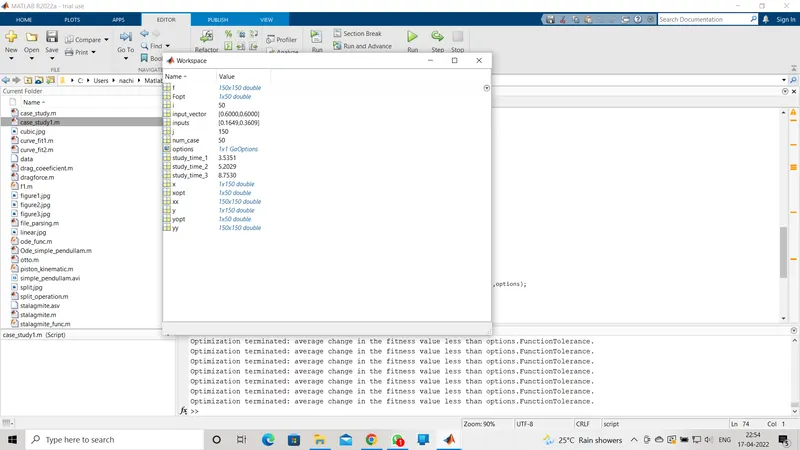
Work space

function code
function [f]=stalagmite_func(input_vector)
x = input_vector(1);
y = input_vector(2);
f1x = (sin(5.1*pi*x+0.5))^6;
f2y = (sin(5.1*pi*y+0.5))^6;
f3x = exp(-4*log(2)*(x-0.066)^2/(0.64));
f4y = exp(-4*log(2)*(y-0.066)^2/(0.64));

f = -(f1x.*f2y.*f3x.*f4y);
end here we used '-' to get minimum value
Defining our search space optimised
one dimensional
close all
clear all
clc


x=linspace(0,0.6,150);
y=linspace(0,0.6,150);
num_case=50;
[xx, yy]=meshgrid(x,y);

for i=1:length(xx)
 for j=1:length(yy)
     input_vector(1)=xx(i,j);
     input_vector(2)=yy(i,j);
     f(i,j)=stalagmite_func(input_vector);

 end
end

surf(xx,yy,f);
shading interp

%study_1 Statical behaviour
    tic
    for i=1:num_case
    [inputs, Fopt(i)]=ga(@stalagmite_func,2);
    xopt(i)= inputs(1);
    yopt(i)=inputs(2);

    end
 study_time_1= toc;

    figure(1)
    subplot(2,1,1)
    hold on
    xlabel('x data')
    ylabel('y data')
    surf(xx,yy,f)
    shading interp
    plot3(xopt,yopt,Fopt,'marker','o','MarkerFaceColor','r')
    subplot(2,1,2)
    plot(Fopt)
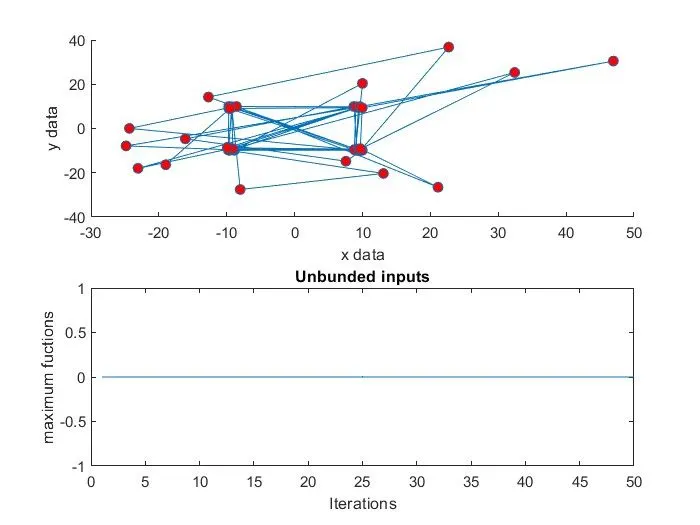
    title('Unbunded inputs')
    xlabel('Iterations')
    ylabel('maximum fuctions')

    %study_2_bopunded values

     tic
    for i=1:num_case
    [inputs Fopt(i)]=ga(@stalagmite_func,2,[],[],[],[],[0,0],[1,1]);
    xopt(i)= inputs(1);
    yopt(i)=inputs(2);

    end
 study_time_2= toc;

    figure(2)
    subplot(2,1,1)
    hold on
    xlabel('x data')
    ylabel('y data')
    surf(xx,yy,f)
    shading interp
    plot3(xopt,yopt,Fopt,'marker','o','MarkerFaceColor','g')
    subplot(2,1,2)
    plot(Fopt)
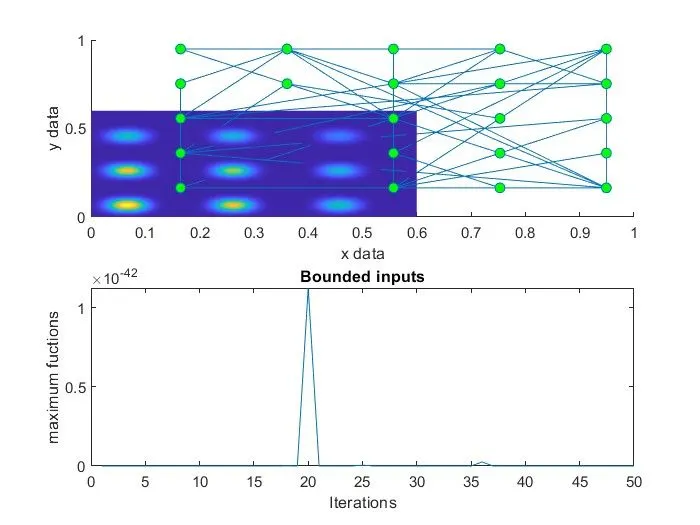
    title('Bounded inputs')
    xlabel('Iterations')
    ylabel('maximum fuctions')


    %study_3_bounded values with increasing populations size

    options=optimoptions('ga');
    options=optimoptions(options,'PopulationSize',300);

    options = optimoptions('ga');
    options = optimoptions (options, 'PopulationSize', 200);
    tic
    for i=1:num_case
         [inputs, Fopt(i)] = ga(@stalagmite_func,2,[],[],[],[],[0;0],[1;1],[],[],options);

        xopt(i)=inputs(1);
        yopt(i)=inputs(2);

    end

    study_time_3 = toc;
    figure(3)
    subplot(2,1,1);
    hold on
    surfc(xx,yy,f)
    shading interp
    xlabel('X data')
    ylabel( 'Y data')
    plot3(xopt,yopt,Fopt,'marker','o','MarkerFaceColor','b')
    subplot(2,1,2)
    plot(Fopt)
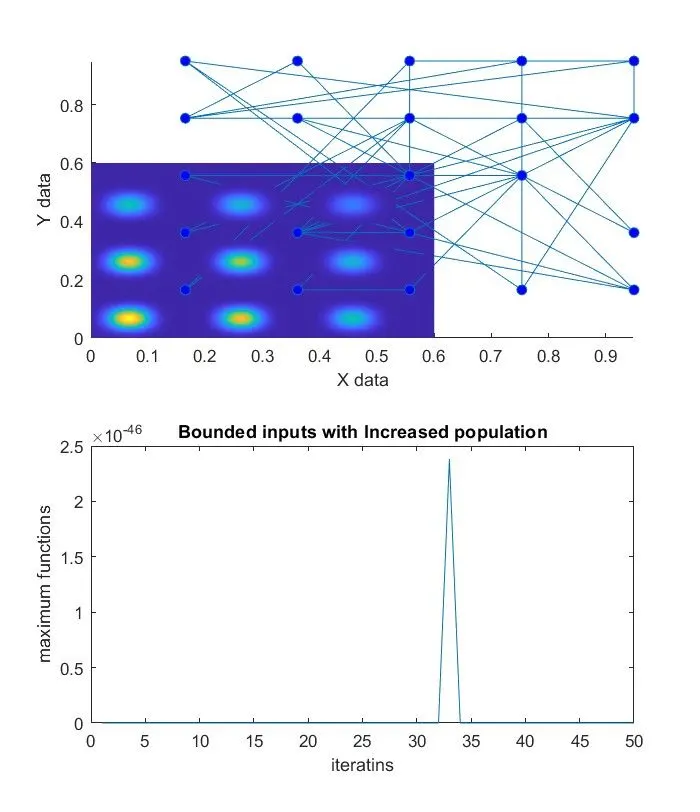
    title('Bounded inputs with Increased population')
    xlabel('iteratins')
    ylabel('maximum functions')
results
study_1 Statical behaviour
study_2_bopunded values
study_3_bounded values with increasing populations size
Work space
Errors
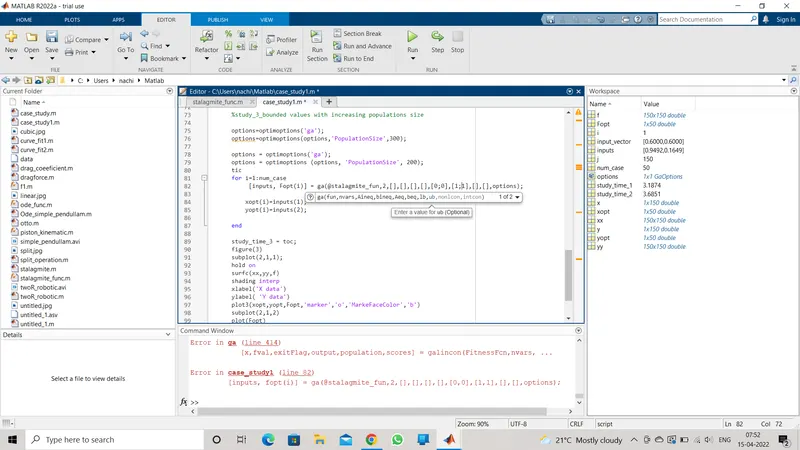
I am rsovle this error by entring the correct spelling of
[inputs,Fopt(i)]=ga(@stalagmite_func,2,[],[],[],[],(0;0),(1;1),options)
Reference
https://in.mathworks.com/videos/what-is-a-genetic-algorithm-100904.html