Week 4.1 - Genetic Algorithm
Aim: To write a code in Matlab to optimise the stalagmite function and to find the global maxima of the function.
Theory:
The genetic algorithm GA is a method for solving both constrained and unconstrained optimisation problems that is based on natural selection,the process that drives biological evolution.
Ga repeatedly modifies the population of individual solutions.
At each step,the genetic algorithm selects individuals at random from the current population to be parents and uses them to produce children for the next generation.over seccessive generations,the popultation evolves towards an optimal solution.
Ga can be applied to solve a variety of optimization problems that are not well suited for standard optimazation algorithms,including problems in which the objective function is discontinuous,non differentiable,stochastic,or highly non linear.
The Ga uses 3 main types of rules at each step to create the next generation from the current population:
Selection rule selects the individuals,called parents,that contribute to the population at the next generation.
Crossover rules combine two parents to form children for the next generation.
Mutation rules apply random changes to individual parents to form children.
x = ga(fun,nvars,A,b,Aeq,beq,lb,ub,nonlcon,option)
- x is the local minima point.
- fun is the function to be called.
- nvars indicates the no of variables used.
- A and b are used to indicate and kind inequalities that exist in the function.
- Aeq and Beq also denotes thw inequalities.
- lb = lower bound
- ub = upper bound.
- nonlcon gives a two vectors representing ineualities and equalities.
- options is used to perform additional operations like increasing population size. this is done with the help of 'optimoptions'.
Procedure:
- Initially stalagmite function is defined as a seperate script.
- A negative sign is used in front of of the fuction to obtain maxima of the function rather minima.
- A nested for loop is utilized to iterate each of the elements.
- GA is used to determine the optimal of the function.
- plot is generated for diffeerent cases.
The three cases considered are:
Bounded Inputs
Unbounded Inputs
Bounded Inputs with Options
Stalagmite Function:
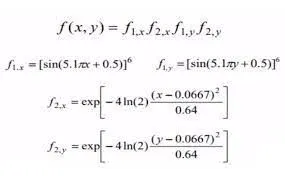
Explaination:
- Firstly,creating the mesh from the two vectors which will be acting as a search space to find the maxima of the function.
- creating the mesh of these two vectors using the 'mesh' command and defining the no. of iteration as num_cases to iteration the values of the optimum values of fucntio.
- Now calculating the values of function at each point of the mesh grid formed.
- Now creating its surface through'surf'command which will also provide the contour of the generated surface.
- while using surf applying the -ve sign to the fucntion will generate the surface upside down which will be good to view.
Matlab code:
clear all
close all
clc
%defining are search space
x = linspace(0,0.6,150)
y = linspace(0,0.6,150)
%iteration cout
num_cases=50;
%creaating a 2d mesh
[xx yy] = meshgrid(x,y);
%evaluating stalagmite fucntion
for i = 1:length(xx);
for j = 1:length(yy);
input_vector(1) = xx(i,j);
input_vector(2) = yy(i,j);
f(i,j) = Stalagmite_func(input_vector);
end
end
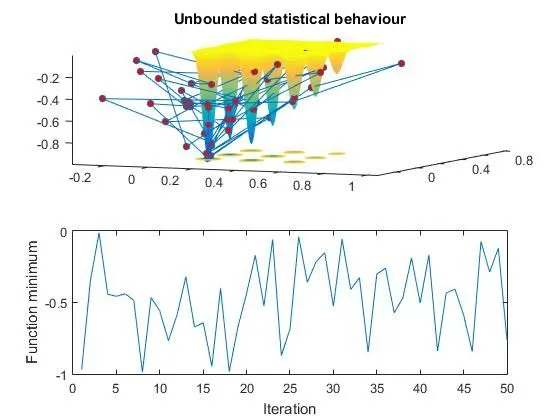
%unbounded statisticla behaviour
tic
for i=1:num_cases;
[inputs,fopt(i)] = ga(@Stalagmite_func,2);
x_opt(i) = inputs(1);
y_opt(i) = inputs(2);
end
study1_time = toc;
figure(1)
subplot(2,1,1)
hold on
surfc(x,y,f)
shading interp
plot3(x_opt,y_opt,fopt,'marker','o','markersize',5,'markerfacecolor','r')
title('Unbounded statistical behaviour')
subplot(2,1,2)
plot(fopt)
xlabel('Iteration')
ylabel('Function minimum')
%Second Iteration
tic
for i=1:num_cases;
[inputs,fopt(i)] = ga(@Stalagmite_func,2,[],[],[],[],[0;0],[1;1]);
x_opt(i) = inputs(1);
y_opt(i) = inputs(2);
end
study2_time = toc
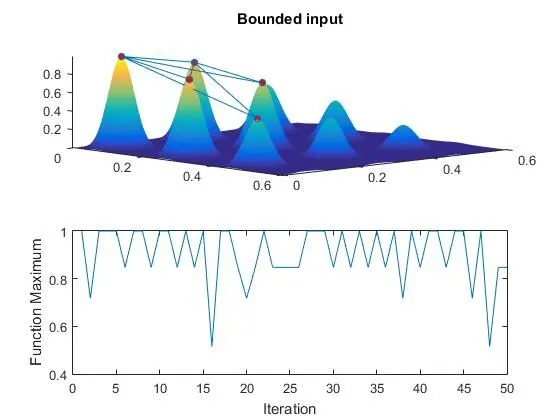
figure(2)
subplot(2,1,1)
hold on
surfc(xx,yy,-f)
shading interp
plot3(x_opt,y_opt,-fopt,'marker','o','markersize',5,'markerfacecolor','r')
title('Bounded input')
subplot(2,1,2)
plot(-fopt)
xlabel('Iteration')
ylabel('Function Maximum')
%Third Iteration GA
options = optimoptions('ga');
options = optimoptions(options,'Populationsize',170);
tic
for i=1:num_cases;
[inputs,fopt(i)] = ga(@Stalagmite_func,2,[],[],[],[],[0;0],[1;1],[],[],options);
x_opt(i) = inputs(1);
y_opt(i) = inputs(2);
end
study3_time = toc
figure(3)
subplot(2,1,1)
hold on
surfc(x,y,f)
shading interp
plot3(x_opt,y_opt,fopt,'marker','o','markersize',5,'markerfacecolor','r')
title('Bounded input')
subplot(2,1,2)
plot(fopt)
xlabel('Iteration')
ylabel('Function Minimum')
Result: