Project 1 - Parsing NASA thermodynamic data
AIM : To write a matlab code for parsing the NASA thermodynamic data file and to extract 14 coefficients thermodynamic properties like CP,H and S, for all the species in the data file.
To find out the molecular mass of each species and finally to plot a graph of enthalpy,entropy, and CP with respect to temperature.
Theory:
File prasing
The defination for prase is to split the file or ther input into pieces or data which can be easily stored or manipulated.Here we will be splitting string into parts then recoganise the parts to convert it into something simpler than string.
Here we extract the data from the given thermodynamic data file and will calculate the Enthalpy , Entropy, Specific Heat , Molecular weight of each species .
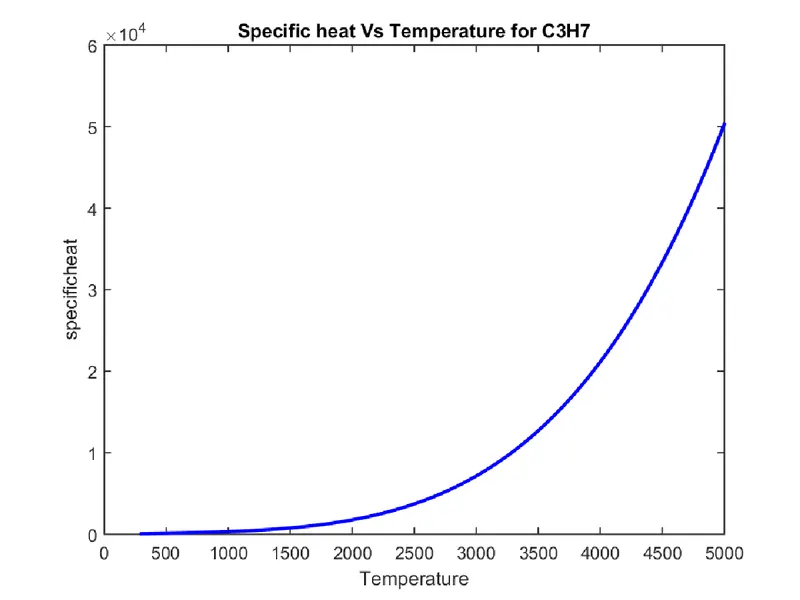
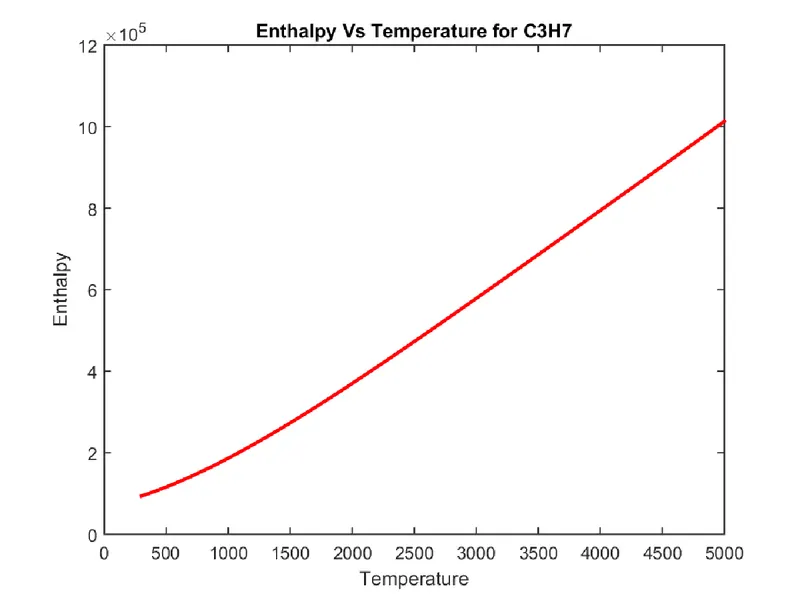
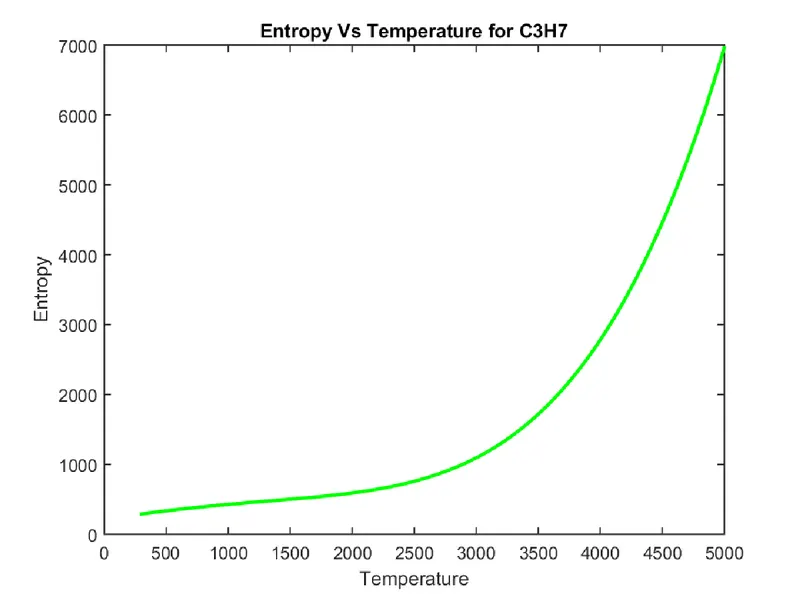
The plots for Enthalpy , Entrophy and Specific Heat for each specis will be plotted and will be stored in seperate file.
Formula Used :
To calculate Enthalpy,Entropy,Specificheat

Here the temperature will vary for each species here the first seven coefficient will use local high temperature and last seven coefficient will use local low temperature.
To calculate the molecular weight of each species
Molecular weight = (Number of atoms)*(Atomic weight),where we calculate the molecular weight of all species
Function code:
% Specific Heat:
function cp = specificheat(a1,a2,a3,a4,a5,b1,b2,b3,b4,b5,T,R,global_medium_temp)
%comparing with global temperature
% If less than global temperature - minimum coefficients are taken
if T <= global_medium_temp
cp = R.*(a1+a2.*T+a3.*T.^2+a4.*T.*3+a5.*T.^4);
else
cp = R.*(b1+b2.*T+b3.*T.^2+b4.*T.*3+b5.*T.^4);
end
end
% Calculation of enthalpy
function h = enthalpy(a1,a2,a3,a4,a5,a6,b1,b2,b3,b4,b5,b6,T,R,global_medium_temp)
if T > global_medium_temp
h = R.*(b1.*T+(b2.*T.^2)./2+(b3.*T.^3)./3+(b4.*T.^4)./4+(b5.*T.^5)./5+b6);
else
h = R.*(a1.*T+(a2.*T.^2)./2+(a3.*T.^3)./3+(a4.*T.^4)./4+(a5.*T.^5)./5+a6);
end
end
% Calculation for entropy
function s = entropy_calc(a1,a2,a3,a4,a5,a7,b1,b2,b3,b4,b5,b7,T,R,global_medium_temp)
if T <= global_medium_temp
s = R*(a1.*log(T)+a2.*T+a3.*(T.^2)./2+a4.*(T.^3)./3+a5.*(T.^4)./4+a7);
else
% Else maximum coefficient are taken
s = R*(b1.*log(T)+b2.*T+b3.*(T.^2)./2+b4.*(T.^3)./3+b5.*(T.^4)./4+b7);
end
end
%Function to calculate molecular weight
function MW = molecular_weight(name)
atoms = ['H','C','O','N','R'];
fprintf('Molecular Weight of');
fprintf(name)
fprintf(' : ');
atomic_Weight = [1 12 16 14 40];
MW = 0;
%Adding Atomic number to obtain particular value
for i = 1:length(name)
for j = 1:length(atoms)
if strcmpi(name(i),atoms(j))
MW = MW + atoms(j);
position = j;
end
end
n = str2num(name(i));
if n>1
MW = MW+ atomic_Weight(position)*(n-1);
end
end
fprintf('%d',MW);
disp(' ');
end
%create plotting function
function plotting(cp,h,s,T,name)
mkdir('species')
% dir_name = name;
% mkdir(dir_name);
cd('C:\Users\kmaha\OneDrive\Desktop\New folder\species')
mkdir(name)
cd(name)
figure(1)
plot(T,cp,'linewidth',2,'color','b')
title(sprintf('Specific heat Vs Temperature for %s',name))
xlabel('Temperature')
ylabel('specificheat')
figure(2)
plot(T,h,'linewidth',2,'color','r')
title(sprintf('Enthalpy Vs Temperature for %s',name))
xlabel('Temperature')
ylabel('Enthalpy')
figure(3)
plot(T,s,'linewidth',2,'color','g')
title(sprintf('Entropy Vs Temperature for %s',name))
xlabel('Temperature')
ylabel('Entropy')
% cd(dir_name)
saveas(1,'cp_vs_t.png')
saveas(2,'h_vs_t.png')
saveas(3,'s_vs_t.png')
cd('C:\Users\kmaha\OneDrive\Desktop\New folder')
end
By using the function program we can calculate the specific heat ,Enthalpy,Entropy
Code explained:
By using the function code we can calculate the molecular weight of all species.here we give atomic weight and tomic names as input to the species.
Then we make use of for loop to calculate the molecular weight of each species individually. Then further we use command called strsplit to compare the species with the elements and calculate their molecular weight.
The string is converted to number by sung str2num command
Main Code:
clear all
close all
clc
%Opening of 'Thermodynamic data
f1 = fopen('THERMO.dat','r')
first_line = fgetl(f1);
% obtaining of global max,min and medium temperature
global_temp = fgetl(f1);
temp_range = strsplit(global_temp,' ');
global_min_temp = str2num(temp_range{2});
global_medium_temp = str2num(temp_range{3});
global_max_temp = str2num(temp_range{4});
% Temperature Range assumed
T = linspace(global_min_temp,global_max_temp,400);
%Universal Gas constant j/(mol-K)
R = 8.314;
% Skipping three comment lines in the file
for i = 3:5
comments = fgetl(f1);
end
%Geting the coeffs of species
for i = 1:53
%Extracting line 1 and the name of the species
line1 = fgetl(f1);
name = strtok(line1);
% Extracting higher and lower temperature coeffs
line2 = fgetl(f1);
line3 = fgetl(f1);
line4 = fgetl(f1);
A = strfind(line2,'E');
B = strfind(line3,'E');
C = strfind(line4,'E');
%Extracting higher temperature coeffs
a1 = str2num(line2(1:A(1)+3));
a2 = str2num(line2(A(1)+4:A(2)+3));
a3 = str2num(line2(A(2)+4:A(3)+3));
a4 = str2num(line2(A(3)+4:A(4)+3));
a5 = str2num(line2(A(4)+4:A(5)+3));
a6 = str2num(line3(1:B(1)+3));
a7 = str2num(line3(B(1)+4:B(2)+3));
%Extracting lower temperature coeffs
b1 = str2num(line3(B(2)+4:B(3)+3));
b2 = str2num(line3(B(3)+4:B(4)+3));
b3 = str2num(line3(B(4)+4:B(5)+3));
b4 = str2num(line4(1:C(1)+3));
b5 = str2num(line4(C(1)+4:C(2)+3));
b6 = str2num(line4(C(2)+4:C(3)+3));
b7 = str2num(line4(C(3)+4:C(4)+3));
% mkdir('species')
% cd('C:\Users\kmaha\OneDrive\Desktop\New folder\species')
%Specific heat calculation
cp = specificheat(a1,a2,a3,a4,a5,b1,b2,b3,b4,b5,T,R,global_medium_temp);
%Enthalpy calculation
h = enthalpy(a1,a2,a3,a4,a5,a6,b1,b2,b3,b4,b5,b6,T,R,global_medium_temp)
%Entropy calculation
s = entropy_calc(a1,a2,a3,a4,a5,a7,b1,b2,b3,b4,b5,b7,T,R,global_medium_temp)
%calculating molecular weight of species
Molecular_wt(i) = molecular_weight(name);
%creating individual folder for each species and plotting
plotting(cp,h,s,T,name)
% cd('C:\Users\kmaha\OneDrive\Desktop\New folder')
end
Explanation :
- Initially we will be opening the given data THERMO.dat file using fopen command.
- Global temperature by using strsplit command
- Loop command to get all the temperature and coefficient that are present in file.
- For getting temperature and coefficient we use finstr command inorder to input the accurate spot and specifying it.
- The data obatin by file will be in string format which we need to convert into numbers by using str2numcommand.
- To create a file for each folder and saveas to save the plot
- Now the Specificheat,Enthalpy,Entrophy is calculated
- Plot command is used to plot the graph
- CD command is used to change the direction
Results: