Week 4.1 - Genetic Algorithm
1. Code to Execute Stalagmite Function to calculate global maxima
function[f] = stalagmite_function(input_vector)
x1= input_vector(1)
y1= input_vector(2)


f1_x = (sin((5.1*pi*x1)+0.5))^6;
f1_y = (sin((5.1*pi*y1)+0.5))^6;

f2_x = exp((-4*(log(2))*(x1-0.0667).^2)/0.64);
f2_y = exp((-4*(log(2))*(y1-0.0667).^2)/0.64);


f = -(f1_x*f1_y*f2_x*f2_y);
% - sign to obtain maxima

end
2. Code to optimize stalagmite function to calculate global maxima
close all
clear all
clc

% Defining our search space
x = linspace(0,0.6,150);
y = linspace(0,0.6,150);

% Creating a 2Dimensional mesh
[xx yy] = meshgrid(x,y);


% eveluating thestalagmite function

for i = 1:length(xx);
    for j = 1: length(yy);
        input_vector(1) = xx(i,j);
        input_vector(2) = yy(i,j);
        f(i,j) = stalagmite_function(input_vector);
    end
end


surfc(xx,yy,f)
xlabel('x_value')
ylabel('y_value')

shading interp

[inputs, fval] = ga(@stalagmite_function,2);
3. Results
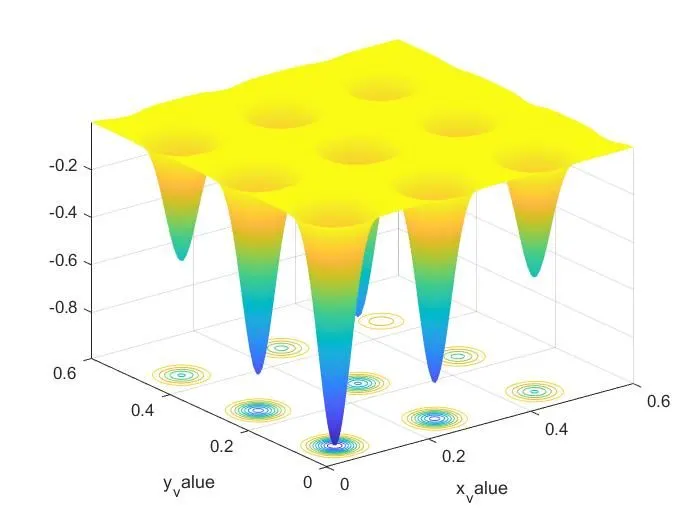
Results
fval =
-0.7285
inputs =
0.2650 0.0804
4. Report
initially used linspace command to creat an array of 150 values
then by using mesh grid convert the data into 3 dimension
by using the pre defined stalagmite function for 150 values of y for each value of x
for i = 1:length(xx);
for j = 1: length(yy);
input_vector(1) = xx(i,j);
input_vector(2) = yy(i,j);
f(i,j) = stalagmite_function(input_vector);
end
end
by using GA plot the graph