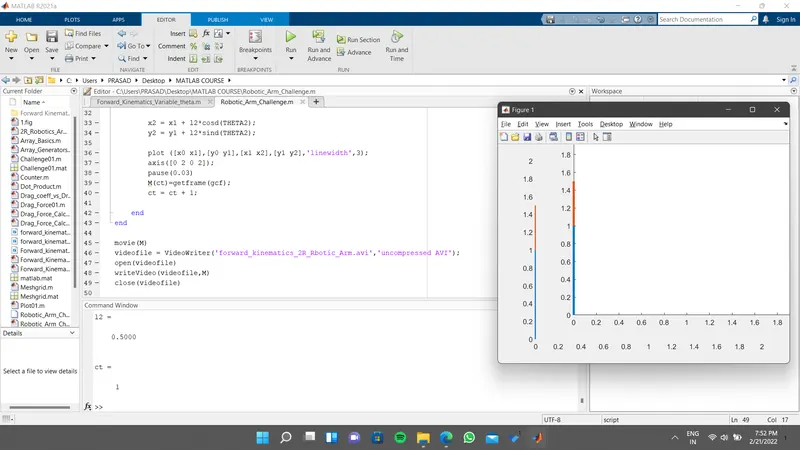
Week 2- 2R Robotic Arm Challenge
% program in Matlab to simulate the forward kinematics of a 2R Robotic Arm

% Input Parameters

% Length of 1 st arm

l1 = 1

% Length of 1 st arm

l2 = 2

% Angle maee by 1 st arm with Horizontal

theta1 =  linspace(0,90,10);

% Angle maee by 2 nd arm with Horizontal

theta2 =  linspace(0,90,10);

ct = 1
for i = 1:length(theta1)
    THETA1 = theta1(i);
    for j = 1:length(theta2)
        THETA2 = theta2(j);

        x0 = 0;
        y0 = 0;

        x1 = l1*cosd(THETA1);
        y1 = l1*sind(THETA1);

        x2 = x1 + l2*cosd(THETA2);
        y2 = y1 + l2*sind(THETA2);

        plot ([x0 x1],[y0 y1],[x1 x2],[y1 y2],'linewidth',3);
        axis([0 4 0 4]);
        pause(0.03)
        M(ct)=getframe(gcf);
        ct = ct + 1;

    end
end

movie(M)
videofile = VideoWriter('forward_kinematics_2R_Rbotic_Arm.avi','uncompressed AVI');
open(videofile)
writeVideo(videofile,M)
close(videofile)
Result Movie
Google Drive Link
Location as Mentioned - Skill Lync Challenges > Week 2 - 2R Robotic Arm Challenge > Movie
Week 2 - 2R Robotic Arm Challenge
Report
1. Code Execution Explanation
l1 = 1
Length of 1 st arm Stored as l1 = 1
l2 = 2
Length of 2 nd arm Stored as l2 = 2
Angle made by 1 st & 2nd arm with Horizontal
theta1 = linspace(0,90,10)
theta2 = linspace(0,90,10)
Results in formation 1*10 Matrix as Shown
theta1 & theta2=
0 10 20 30 40 50 60 70 80 90
Now
In for Loop
for i = 1:length(theta1)
i stores 1st value of theta1 as 0 and calculate For THETA1 = theta1(i) i.e THETA1 = theta1(0)
now for i = 0
2nd for loop executed
for j = 1:length(theta2)
j stores 1st value of theta2 as 0 and calculate For THETA2 = theta2(j) i.e THETA2 = theta2(0)
now for stored values of
THETA1 & THETA2
Following co-ordinates get calculated
x0 = 0;
y0 = 0;
x1 = l1*cosd(THETA1);
y1 = l1*sind(THETA1);
x2 = x1 + l2*cosd(THETA2);
y2 = y1 + l2*sind(THETA2);
The cycle repeats for 10 values with calculating co-ordinates for x0 x1 x2 y0 y1 y2 by storing 10 values of j from theta 2
similary aginst every 1 single value of THETA1, 10 values of THETA generated and Co - ordinares are calculated
and 100 Positions recorded with varying co ordinares for ([x0 x1],[y0 y1],[x1 x2],[y1 y2])
Plot a graph aginst this 100 positins with linewidth 3
plot ([x0 x1],[y0 y1],[x1 x2],[y1 y2],'linewidth',3);
Fix Axis Limits for ease of understanding
Fix X Axis limits from 0 to 4
Fix y Axis limits range from 0 to 4
axis([0 4 0 4])
to visualise the plot
generate counter ct =1
and increment the couter after excecution of for loop by 1 i.e ct + 1
Pause the code in order to smooth execution and display of plot
the animation of the 100 positions Displayed
2. Errors Faced
1. Unrecognised Function l1cosd(THETA1)
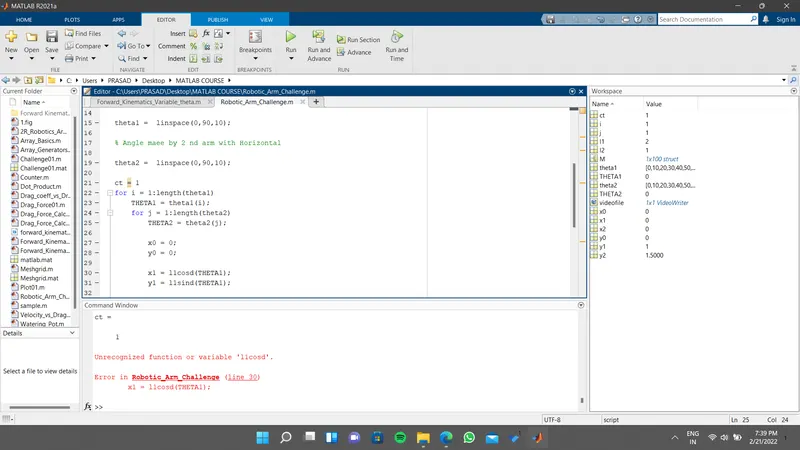
Steps taken to overcome
Multiplication sign were missing
corrrected as
l1cosd*(THETA1)
2. Plot Were Distinct
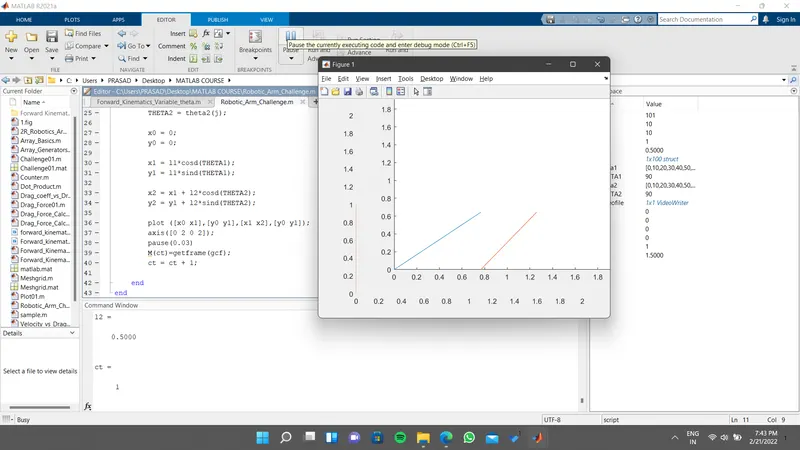
Steps Taken to Overcome
Plot was mentioned wrong as
plot ([x0 x1],[y0 y1],[x1 x2],[y0 y1],'linewidth',3);
Corrected as
plot ([x0 x1],[y0 y1],[x1 x2],[y1 y2],'linewidth',3);
3. Filename invalid
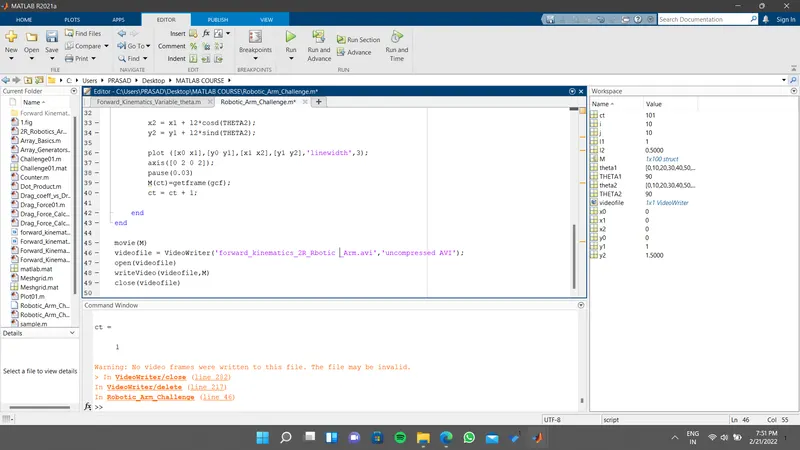
Stesps to oversome
A space observed in file name hence removed
4. Excuted Completely without errors