Project 1 - Parsing NASA thermodynamic data
- Progarm Code
- Code to Extract 14 co-efficient and calculates the enthalpy, entropy and specific heats with function for all the species in the data file
close all
clear all
clc

% Load the data file to read (write(w), Read(r))
f1 = fopen('thermo.txt','r');

% reading header Information
fgetl(f1);

% reding Global Temperatures in Data file
t_line = fgetl(f1);

% Construction of array with global temperature data from data file
a = strsplit(t_line,' ');

% Assign low, medium & high temp values of global temperature data
global_low_temp = str2double(a{2});
global_medium_temp = str2double(a{3});
global_high_temp = str2double(a{4});


% Neglect three lines as no useful data
fgetl(f1);
fgetl(f1);
fgetl(f1);

% From 53 Gaseous Species of data file

for i=1:53
    % 1st line involve species & local temperature ranges
    t_line2 = fgetl(f1);
    % Split the data in separate cells
    s = strsplit(t_line2, ' ');
    % 1st cell is of species name
    species_name = s{1};
    % location of G in order to extract temp after G in same line
    A = strfind(t_line2,'G');
    % Extract local temp ranges for Species
    temp_values = t_line2(A+4:length(t_line2));
    % Split the data in separate cells
    B = strsplit(temp_values,' ');
    % Assign Local temperature values seperated in cells
    local_low_temp = str2double(B{1});
    local_mid_temp = str2double(B{2});
    local_high_temp = str2double(B{3});

    % line 1
    % next line involve 1-5 co-efficients
    line1 = fgetl(f1);
    % location of E in order to extract co-efficient
    b=findstr(line1,'E');
    % 1 st coefficient
    b1 = line1(1:b(1)+3);
    b1 = str2num(b1);
    % 2nd coefficient
    b2 = line1(b(1)+4:b(2)+3);
    b2 = str2num(b2);
    % 3rd coefficient
    b3 = line1(b(2)+4:b(3)+3);
    b3 = str2num(b3);
    % 4th coefficient
    b4 = line1(b(3)+4:b(4)+3);
    b4 = str2num(b4);
    % 5th coefficient
    b5 = line1(b(4)+4:b(5)+3);
    b5 = str2num(b5);

    % line 2
    % next line involve 5-10 co-efficient
    line2 = fgetl(f1);
    % location of E in order to extract co-efficient
    b=findstr(line2,'E');
    % 6th coefficient
    b6 = line2(1:b(1)+3);
    b6 = str2num(b6);
    % 7th Coefficient
    b7 = line2(b(1)+4:b(2)+3);
    b7 = str2num(b7);
    % 8th Coefficient
    b8 = line2(b(2)+4:b(3)+3);
    b8 = str2num(b8);
    % 9th Coefficient
    b9 = line2(b(3)+4:b(4)+3);
    b9 = str2num(b9);
    % 10th Coefficient
    b10 = line2(b(4)+4:b(5)+3);
    b10 = str2num(b10);

    % line 3
    % next line involves 11-14 Co-efficient
    line3 = fgetl(f1);
    % location of E in order to extract co-efficient
    b = findstr(line3,'E');
    %11th coefficient
    b11 = line3(1:b(1)+3);
    b11 = str2num(b11);
    %12th Coefficient
    b12 = line3(b(1)+4:b(2)+3);
    b12 = str2num(b12);
    %13th coefficient
    b13 = line3(b(2)+4:b(3)+3);
    b13 = str2num(b13);
    %14th coefficient
    b14 = line3(b(3)+4:b(4)+4);
    b14 = str2num(b14);

    % universal gas constant
    R = 8.314;

    % Temperature Array for calculation
    t = linspace(local_low_temp,local_high_temp,100);

    % Calculate specific,Enthaly & Entropy by calling predefined function
    % specific heat
    c_p = Specific_heat(b1,b2,b3,b4,b5,b6,b7,b8,b9,b10,b11,b12,b13,b14,local_low_temp,local_mid_temp,local_high_temp,t,R);
    % Enthalpy
    H = Enthalpy(b1,b2,b3,b4,b5,b6,b7,b8,b9,b10,b11,b12,b13,b14,local_low_temp,local_mid_temp,local_high_temp,t,R);
    % Entropy
    S = Entropy(b1,b2,b3,b4,b5,b6,b7,b8,b9,b10,b11,b12,b13,b14,local_low_temp,local_mid_temp,local_high_temp,t,R);

    % Creating Folder

    mkdir(['E:',species_name])
    cd(species_name)

    % plotting for

    % temperature vs Specific heat
    figure(1)
    plot(t,c_p)
    xlabel('Temperature')
    ylabel('Specific heat')
    title('Temperature vs Specific Heat')
    image = getframe(gcf);
    imwrite(image.cdata,'T vs CP.png')
    saveas(1,'specific heat','jpg')

    % Temperature vs Enthalpy
    figure(2)
    plot(t,H)
    xlabel('Temperature')
    ylabel('Enthalpy')
    title('Temperature vs Enthalpy')
    image = getframe(gcf);
    imwrite(image.cdata,'T vs H.png')
    saveas(2,'Enthalpy','jpg')

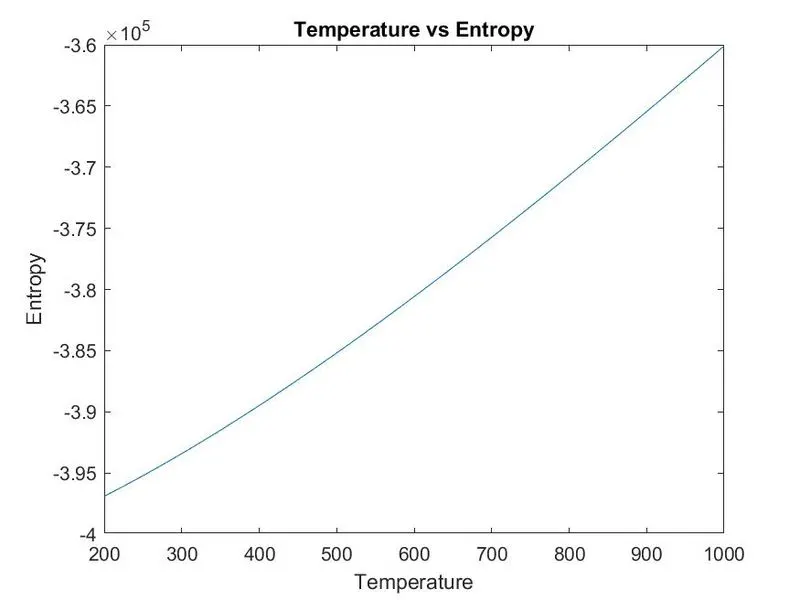
    % Temperature vs Entropy
    figure(3)
    plot(t,H)
    xlabel('Temperature')
    ylabel('Entropy')
    title('Temperature vs Entropy')
    image = getframe(gcf);
    imwrite(image.cdata,'T vs S.png')
    saveas(3,'Entropy','jpg')

    cd ..

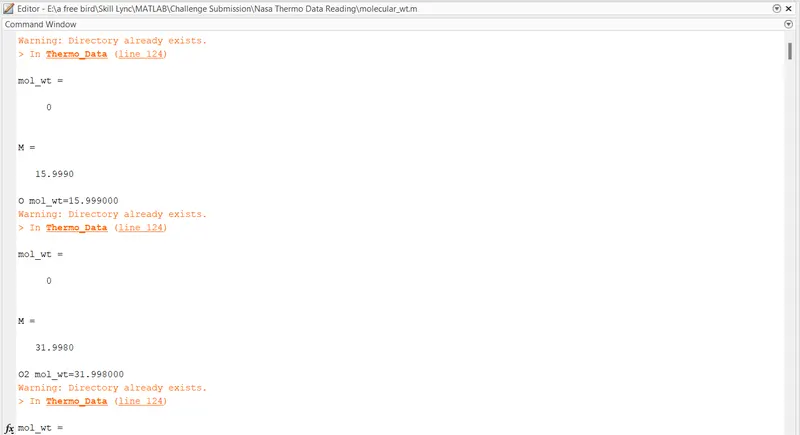
    % Calculating Molecular mass
    [M] = molecular_wt(species_name);
    k = sprintf('%s mol_wt=%f',species_name,M);
    disp(k)
end
- Specific Heat Function
% Specific heat

function [c_p] = Specific_heat(b1,b2,b3,b4,b5,b6,b7,b8,b9,b10,b11,b12,b13,b14,local_low_temp,local_mid_temp,local_high_temp,t,R)

% considering high temp co-efficient for high temperature ranges
if (t>local_mid_temp)
    c_p = R*(b1+(b2.*t)+(b3.*(t.^2))+(b4.*(t.^3))+(b5.*(t.^4)));
else
% considering low temp co-efficient for low temperature ranges
    c_p = R*(b8+(b9.*t)+(b10.*(t.^2))+(b11.*(t.^3))+(b12.*(t.^4)));
end- Enthalpy Function
% Enthalpy

function [H] = Enthalpy(b1,b2,b3,b4,b5,b6,b7,b8,b9,b10,b11,b12,b13,b14,local_low_temp,local_mid_temp,local_high_temp,t,R)

% considering high temp co-efficient for high temperature ranges
if (t>local_mid_temp)
    H =(b1+((b2.*t)/2)+((b3.*(t.^2))/3)+((b4.*(t.^3))/4)+((b5.*(t.^4))/5)+(b6./t)).*t*R;
% considering low temp co-efficient for low temperature ranges
else
    H =(b8+((b9.*t)/2)+((b10.*(t.^2))/3)+((b11.*(t.^3))/4)+((b12.*(t.^4))/5)+(b13./t)).*t*R;
end- Entropy Function
% Entropy

function [S] = Entropy(b1,b2,b3,b4,b5,b6,b7,b8,b9,b10,b11,b12,b13,b14,local_low_temp,local_mid_temp,local_high_temp,t,R)

% considering high temp co-efficient for high temperature ranges
if (t>local_mid_temp)
    S = ((b1.*log(t))+(b2.*t)+((b3.*(t.^2))/2)+((b4.*(t.^3))/3)+((b5.*(t.^4))/4)+(b7)).*R;
% considering low temp co-efficient for low temperature ranges
else
    S = ((b8.*log(t))+(b9.*t)+((b10.*(t.^2))/2)+((b11.*(t.^3))/3)+((b12.*(t.^4))/4)+(b14)).*R;
end- Molecular Weight Function
% For Molecular Weight

function [M] = molecular_wt(species_name)

atomic_mass = [15.999,1.008,12.011,14.007,39.948];
elements = ['O','H','C','N','A'];

mol_wt = 0
for i = 1:length(species_name)
    for j=1:length(elements)
        if strcmpi(species_name(i),elements(j))
            mol_wt = mol_wt + atomic_mass(j);
            z = j;
        end
    end
    t = str2double(species_name(i));
    if (t>1)
        mol_wt = mol_wt + (atomic_mass(z)*(t-1));
    end
end
M = mol_wt
end
- Result
- Folder Involving 53 species of Data File

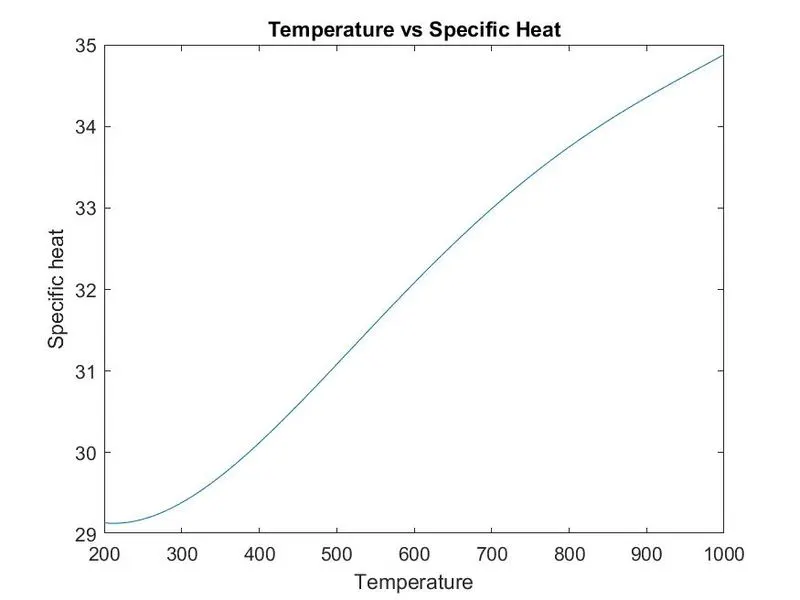
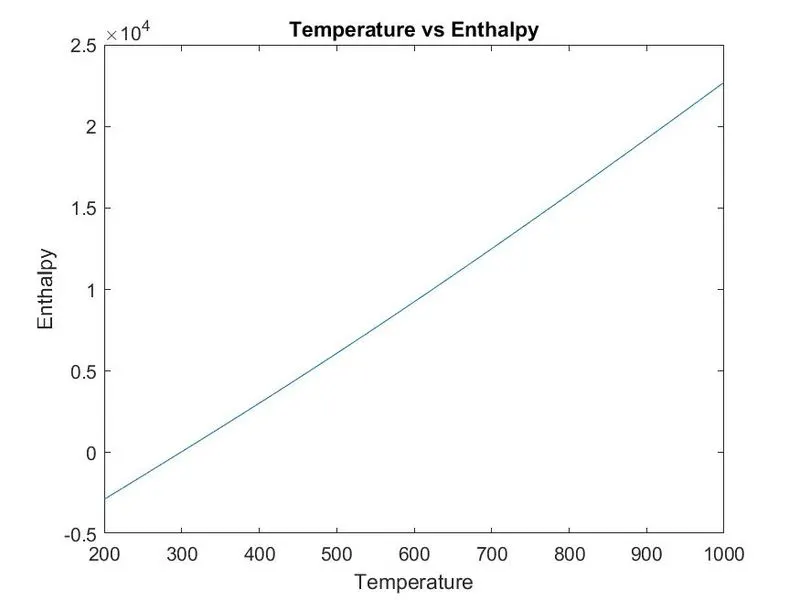
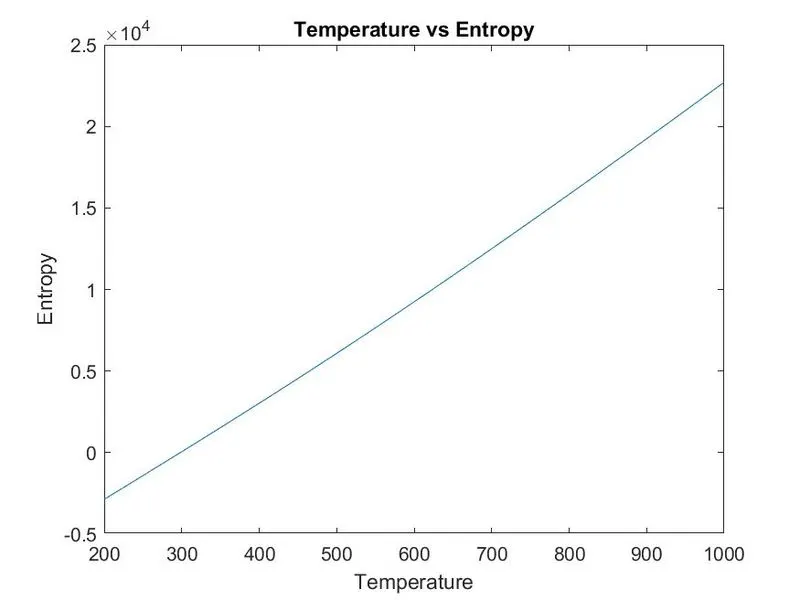
- Plot for o2
- Temperature vs Specific Heat
2. Enthalpy
3. Entropy
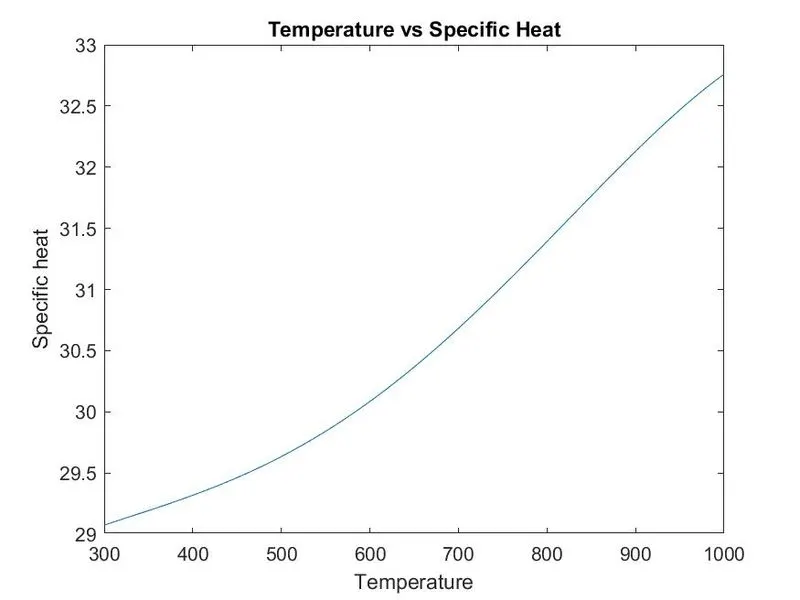
- Plot for N2
1. Specific Heat
2. Enthalpy
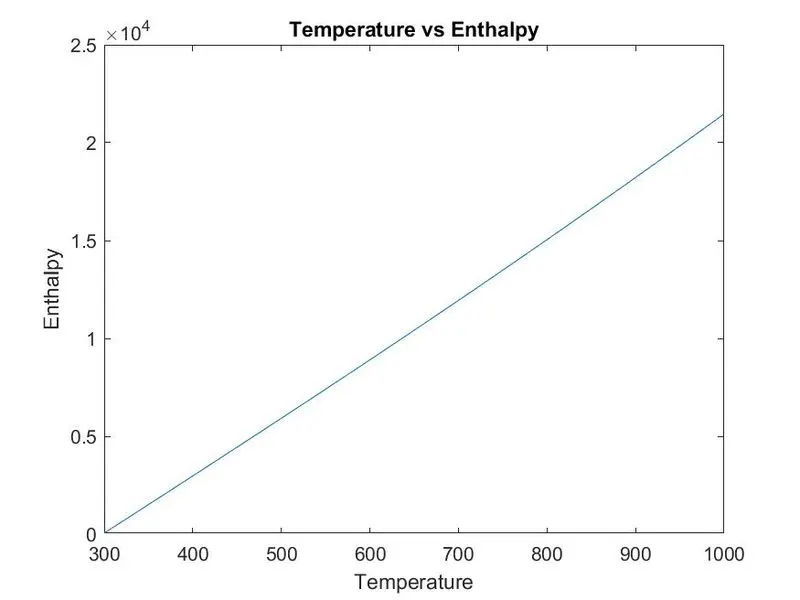
3. Entropy
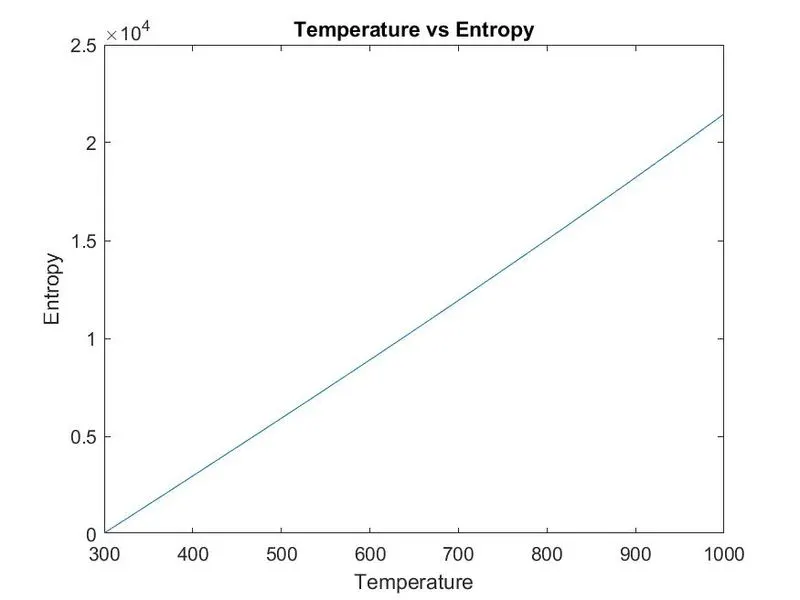
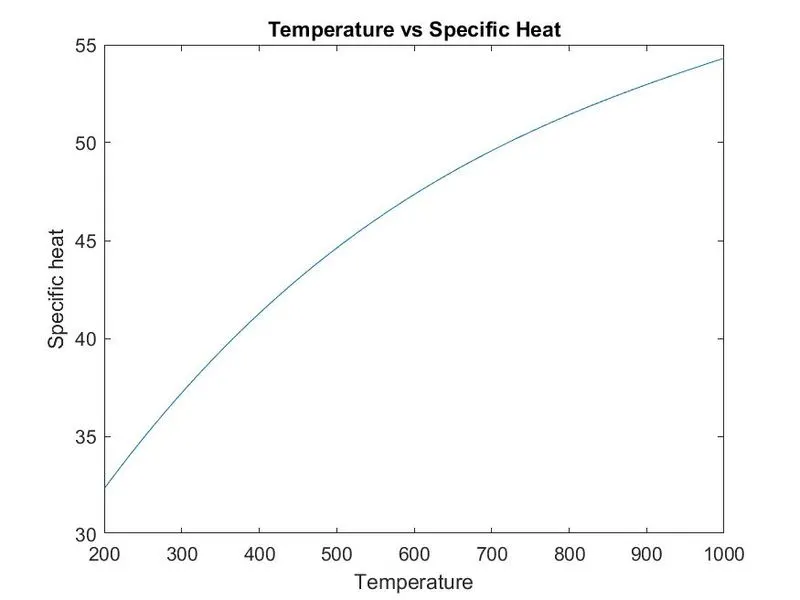
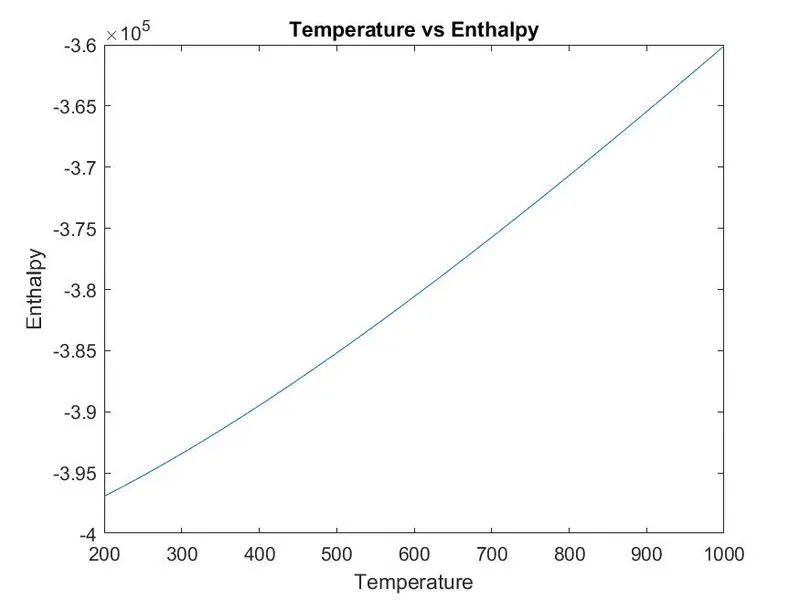
- Plot for CO2
1. Specific heat
2. Enthalpy
3. Entropy
- Molecular Weight in Command Window
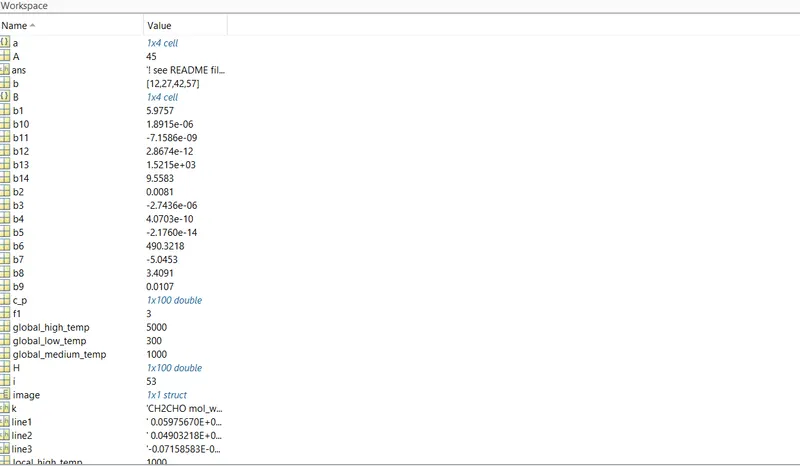
- WorkPlace Snap
- Report
1. Initially created a folder and make sure the data file and the program code file are the part of same folder location
2. load the data file with fopen command with the help of file name and the permissiom to read the file and assign f1 as a file handle
f1 = fopen('thermo.txt','r');
3. Read the header line with fgetl command
fgetl(f1);
4. Shift to next line with fgetl command to read the Global Temperature Data
t_line = fgetl(f1);
Construct the array with strsplit command to separate the global temperature values
a = strsplit(t_line,' ');
Assign low, medium & high temp values of global temperature data separated in above step
global_low_temp = str2double(a{2});
global_medium_temp = str2double(a{3});
global_high_temp = str2double(a{4});
5. Neglecting next three lines with fgetl command as no data useful while calculation
6. in the data provided contain the 53 species for each of which we have to extrct local temperature ranges & 14 Co-efficients in order to calculate specific heat, Enthalpy, Entropy and plot them with temperature
hence for 1 to 53
Repeted the below code 53 times in order to extarct local temperature ranges & 14 Co-efficients and calculate specific heat ,Enthalpy & Entropy and plot them
1st line involve species name & local temperature ranges
t_line2 = fgetl(f1);
Split the data in line 1 separate cells
s = strsplit(t_line2, ' ');
1st cell is of species name
species_name = s{1};
Extract location of G in order to extract local temperature ranges after G in same line
A = strfind(t_line2,'G');
Extract local temp ranges for Species ahead to G as per location
temp_values = t_line2(A+4:length(t_line2));
Split the data in separate cells
B = strsplit(temp_values,' ');
Assign Local temperature values seperated in cells
local_low_temp = str2double(B{1});
local_mid_temp = str2double(B{2});
local_high_temp = str2double(B{3});
now the furthur lines consisits of co-efficients hence by calling each line ahead extract coefficients from each line till 14 co-efficients collected for each species
next line involve 1-5 co-efficients (lne 1)
line1 = fgetl(f1);
location of E in order to extract co-efficient
b=findstr(line1,'E');
1 st coefficient
from the 1location to 3 locations ahead to E gives 1st coefficient on L1
b1 = line1(1:b(1)+3);
b1 = str2num(b1);
2nd coefficient
ahead 4 locations from 1st location E to ahead 3 locations from next Cosecutive location of E gives 2nd co-efficient on L1
b2 = line1(b(1)+4:b(2)+3);
b2 = str2num(b2);
3rd coefficient
ahead 4 locations from 2nd location of E to ahead 3 locations from next Cosecutive location of E gives 3rd co-efficient on L1
b3 = line1(b(2)+4:b(3)+3);
b3 = str2num(b3);
4th coefficient
ahead 4 locations from 3rd location of E to ahead 3 locations from next Cosecutive location of E gives 4th co-efficient on L1
b4 = line1(b(3)+4:b(4)+3);
b4 = str2num(b4);
5th coefficient
ahead 4 locations from 4th location of E to ahead 3 locations from next Cosecutive location of E gives 5th co-efficient on L1
b5 = line1(b(4)+4:b(5)+3);
b5 = str2num(b5);
By Repeating the same senerio ahed to 3 lines gives all 14 co-efficients required
Assign universal gas constant
R = 8.314;
Temperature Array for calculation
t = linspace(local_low_temp,local_high_temp,100);
Calculate specific,Enthaly & Entropy by calling predefined function for Specific Heat,Enthalpy,Entropy
specific heat
c_p = Specific_heat(b1,b2,b3,b4,b5,b6,b7,b8,b9,b10,b11,b12,b13,b14,local_low_temp,local_mid_temp,local_high_temp,t,R);
Specific heat function
By using the provided formulae with predefined function call
if (t>local_mid_temp)
if t is greater than mid temperature use high temperature co-efficients
considering high temp co-efficient for high temperature ranges
c_p = R*(b1+(b2.*t)+(b3.*(t.^2))+(b4.*(t.^3))+(b5.*(t.^4)));
else
considering low temp co-efficient for low temperature ranges
c_p = R*(b8+(b9.*t)+(b10.*(t.^2))+(b11.*(t.^3))+(b12.*(t.^4)));
Enthalpy
H = Enthalpy(b1,b2,b3,b4,b5,b6,b7,b8,b9,b10,b11,b12,b13,b14,local_low_temp,local_mid_temp,local_high_temp,t,R);
Enthalpy Function
By using the provided formulae with predefined function call
if (t>local_mid_temp)
if t is greater than mid temperature use high temperature co-efficients
considering high temp co-efficient for high temperature ranges
H =(b1+((b2.*t)/2)+((b3.*(t.^2))/3)+((b4.*(t.^3))/4)+((b5.*(t.^4))/5)+(b6./t)).*t*R;
else
considering low temp co-efficient for low temperature ranges
H =(b8+((b9.*t)/2)+((b10.*(t.^2))/3)+((b11.*(t.^3))/4)+((b12.*(t.^4))/5)+(b13./t)).*t*R;
Entropy
S = Entropy(b1,b2,b3,b4,b5,b6,b7,b8,b9,b10,b11,b12,b13,b14,local_low_temp,local_mid_temp,local_high_temp,t,R);
Entropy Function
By using the provided formulae with predefined function call
if (t>local_mid_temp)
if t is greater than mid temperature use high temperature co-efficients
considering high temp co-efficient for high temperature ranges
S = ((b1.*log(t))+(b2.*t)+((b3.*(t.^2))/2)+((b4.*(t.^3))/3)+((b5.*(t.^4))/4)+(b7)).*R;
else
considering low temp co-efficient for low temperature ranges
S = ((b8.*log(t))+(b9.*t)+((b10.*(t.^2))/2)+((b11.*(t.^3))/3)+((b12.*(t.^4))/4)+(b14)).*R;
Molecular Weight
function [M] = molecular_wt(species_name)
atomic_mass = [15.999,1.008,12.011,14.007,39.948];
elements = ['O','H','C','N','A'];
mol_wt = 0 -
for i = 1:length(species_name) - Name of species who's Molecular wt i to calculate
for j=1:length(elements) - Elements involved in species
if strcmpi(species_name(i),elements(j)) - check species_name(i) = elements(j)
mol_wt = mol_wt + atomic_mass(j); - if yes Molecular wt of species = Atomic mass
z = j; - Assign z = j
end
end
t = str2double(species_name(i)); - Extract digits involved in species name and assign to t
if (t>1)
mol_wt = mol_wt + (atomic_mass(z)*(t-1)); - if t>1 multiply atomic mass with t
end
end
M = mol_wt
end
7. Creating folder with mkdir command with inut of folder name & file name to save all plots
plotting for
% temperature vs Specific heat
figure(1)
plot(t,c_p)
xlabel('Temperature')
ylabel('Specific heat')
title('Temperature vs Specific Heat')
image = getframe(gcf);
imwrite(image.cdata,'T vs CP.png')
saveas(1,'specific heat','jpg')
% Temperature vs Enthalpy
figure(2)
plot(t,H)
xlabel('Temperature')
ylabel('Enthalpy')
title('Temperature vs Enthalpy')
image = getframe(gcf);
imwrite(image.cdata,'T vs H.png')
saveas(2,'Enthalpy','jpg')
% Temperature vs Entropy
figure(3)
plot(t,H)
xlabel('Temperature')
ylabel('Entropy')
title('Temperature vs Entropy')
image = getframe(gcf);
imwrite(image.cdata,'T vs S.png')
saveas(3,'Entropy','jpg')
cd ..
% Calculating Molecular mass
[M] = molecular_wt(species_name);
k = sprintf('%s mol_wt=%f',species_name,M);
disp(k)
end
this code repeats 53 times in order to extract 14 co-efficients and plots for all 53 species involved in the data file