Week 3 - Solving second order ODEs
1. Programme to define a ode function
function [dtheta_dt] = ode_func(t,theta,b,g,l,m)

theta1 = theta(1);
theta2 = theta(2);
dtheta1_dt = theta2;
dtheta2_dt = -(b/m)*theta2-(g/l)*sin(theta1);
dtheta_dt = [dtheta1_dt ; dtheta2_dt];

end
2. Programme to plot change in angular dispalacement & Angular Velocity with respect to time and a movie showing an animation of pendulum under damping
close all
clear all
clc


% input

% Damping Coefficient
b = 0.05;

% Accln due to gravity(m/s^2)
g = 9.81;

% Length of pendulum(m)
l = 1

% mass of ball(kg)
m = 1

% Initial condition
theta_0 =  [0;3];

% Time span
t_span = linspace(0,20,500);

% solve code
[t,results] = ode45(@(t,theta)ode_func(t,theta,b,g,l,m),t_span,theta_0)

figure(1)
plot(t,results(:,1))
hold on
plot(t,results(:,2))
ylabel('plot')
xlabel('time')
legend('angle','angular velocity')

%X and Y location of bob
x=sin(results(:,1))
y=-cos(results(:,1))


% Plotting results for animation

figure(2)
for i=1:length(t_span);
    i
    clf
    plot([-1.5,1.5],[0,0],'b-','LineWidth',5)
    hold on
    plot([0,0],[0,-1.5],'b--')
    hold on
    plot(x,y)
    hold on

    plot([0,x(i)],[0,y(i)],'LineWidth',3)
    plot(x(i),y(i),'o','markersize',25,'markerfacecolor','r')
    axis([-1.5 1.5 -1.5 0])

    movieVector(i)=getframe;
end

myWriter=VideoWriter('pendulum_movie');

open(myWriter);
writeVideo(myWriter,movieVector);
close(myWriter);
3. Results
Plot Time vs angular displacement & angular velocity
movie showing an animation of pendulum under damping
Google Drive Link for an animation video
4. Report
Step wise explanation of code.
- Reducing 2nd order ode into 1st order ode
Reduced the provided 2nd order ode into 1st order ode and receivd 2 equations as follows
dtheta1_dt = theta2;
dtheta2_dt = -(b/m)*theta2-(g/l)*sin(theta1);
and hence ODE to solve
dtheta_dt = [dtheta1_dt ; dtheta2_dt]
- Define Function
While function call provided all the inputs required for the errorless excection of ode function while function call
- Programme to plot change in angular dispalacement & Angular Velocity with respect to time and a movie showing an animation of pendulum under damping
initially provided all the input parameters required while function call
Damping Coefficient
b = 0.05;
Accln due to gravity(m/s^2)
g = 9.81;
Length of pendulum(m)
l = 1
mass of ball(kg)
m = 1
Defined Intial conditions at t = 0
at t = 0
v = 3 rad/s
Defined the time span for which the change in angular dispalacement & Angular Velocity to be calculated
as provided we have to calculate the change in angular dispalacement & Angular Velocity for 20 seconds
hence
used linspace command to define change in time
t_span = linspace(0,20,500)
Use of inbuit ode45 matlab function to calculate change in angular dispalacement & Angular Velocity by input of ode_func which defines the output for required ODE
ode45 where provided
1. t & theta are independent & dependent variables respectievely
2. ode_fuc which defines ode for which results to be calculated
3. time span for which results required
4. initial conditions at t = 0
Received Result
1. change in angular displacement
2. Change in angular velocity
Plot against the change in time vs angular dispalacement & Angular Velocity
Plot against time and 1 st output of results i.e angular displacement
plot(t,results(:,1))
Plot against time and 2nd output of results i.e angular velocity (rad/s)
plot(t,results(:,2))
Defined the lable description
ylabel('plot')
xlabel('time')
as plot involve 2 curve hence defined the the curve for angular dispalacement & Angular Velocity as per the color obtained in plot
legend('angle','angular velocity')
for x & y co ordinates of Bob Location plot animation
x & Y co ordinates for Location of Pendulum Bob
From the results received for angular dispalacement (:,1) calculate x & y co ordinates for Bob Location
x=sin(results(:,1))
y=-cos(results(:,1))
1. for each value of of x & y received plot a line with reference of fixed point (0,0)
plot([0,x(i)],[0,y(i)])
2. for each value of of x & y draw a circle
plot(x(i),y(i),'o','markersize',25,'markerfacecolor','r')
3. Provides x & y axis
defined a movie to animate pendulum motion
movieVector(i)=getframe;
for each plot generated created a movie
myWriter=VideoWriter('pendulum_movie');
open(myWriter);
writeVideo(myWriter,movieVector);
close(myWriter);
Errors Faced
1. Unrecognised function variable
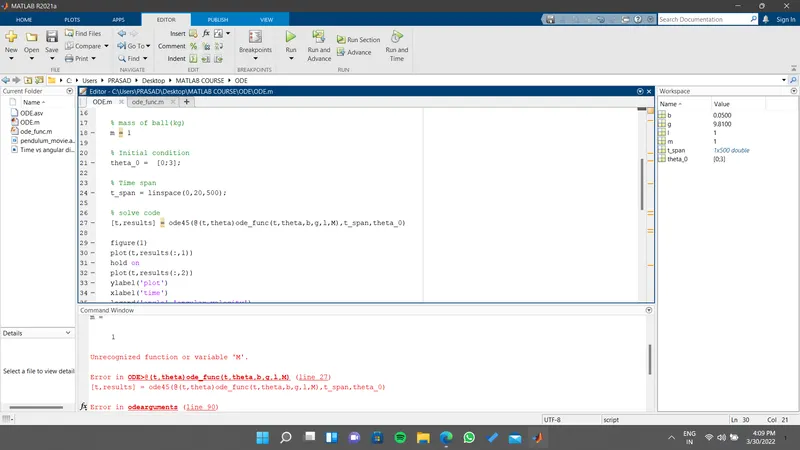
Steps Taken to overcome
Variable m in function is in lower case
but in solve code were in upper case
updtae in solve code with lower case m and resolvded
2. Only 1 result were displpayed in plot
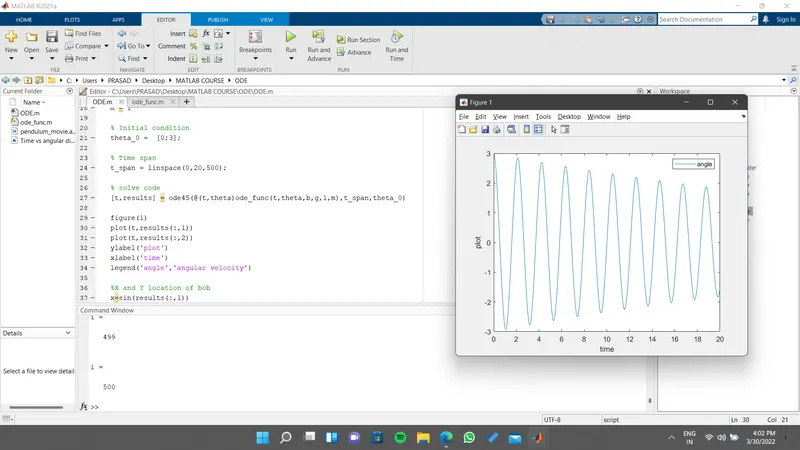
Steps to overcome
hold on command were missing in between plot declaration of two results
hence resolved
3. Previsious figure were repeating and were not get cleared
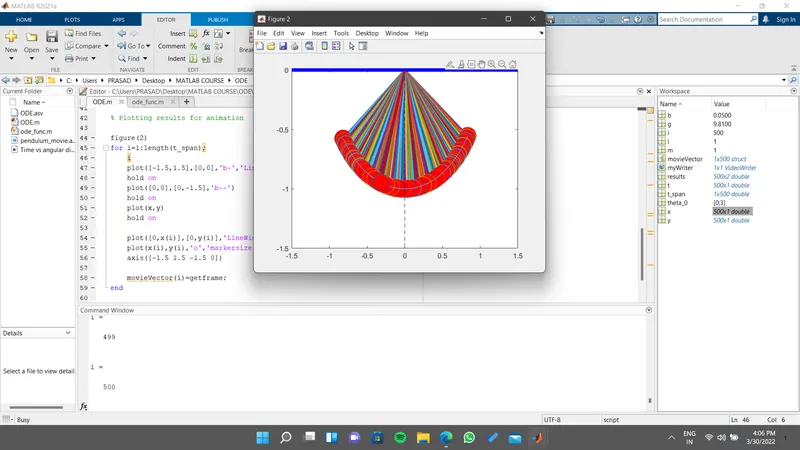
Steps taken to overcome
clf command used to clear previous figure in for loop