Week 4.1 - Genetic Algorithm
Aim:-
- To calculate the global maxima of a stalagmite function.
Introduction:-
- Genetic algorithms are primarily used in optimization problems of various kinds, but they are frequently used in other application areas as well.
- Genetic algorithm is a procedure used in the field of Computer Science and operations research to solve problems of optimization copying the process of natural selection. Genetic Algorithm attempts to generate the best solution by employing operations such as mutation, cross-over, and selection.
- What is 'GA':- It is one of the optimization processes. A genetic algorithm (GA) is a search-based optimization technique based on the principles of genetic and natural selection. It is frequently used to find optimal or near-optimal solutions. It is frequently used to solve optimization problems, in research and machine learning.
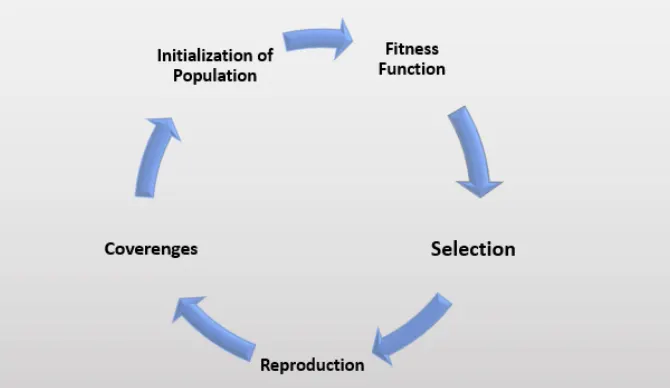
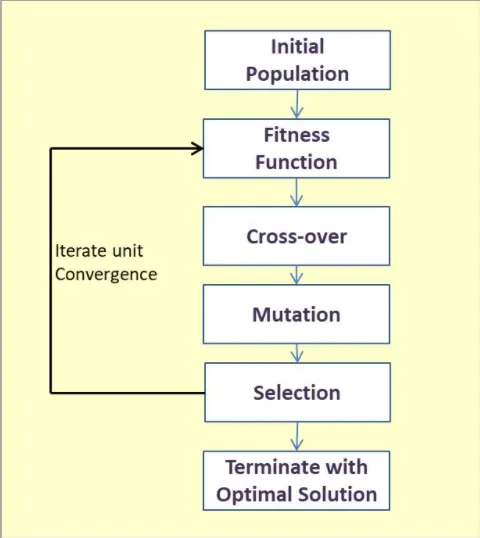
Five phases are considered a genetic algorithm.
- Initial population:- Every gene represents a parameter (variables) in the solution. This collection of parameters that forms the solution is the chromosome. Therefore, the population is a collection of chromosomes. Order of genes on the chromosome matters. Chromosomes are often depicted in binary as 0’s and 1’s, but other encodings are also possible.
- Fitness function:- We have to select the best ones to reproduce offspring out of the available chromosomes, so each chromosome is given a fitness value. The fitness score helps to select the individuals who will be used for reproduction.
- Crossover:- Crossover is the most vital stage in the genetic algorithm. During crossover, a random point is selected while mating a pair of parents to generate offspring.
- Selection:- This phase’s main goal is to find the region where getting the best solution is more. Inspiration for this is from the survival of the fittest. It should be a balance between exploration and exploitation of search space.GA tries to move the genotype to higher fitness in the search space. Too strong fitness selection bias can lead to sub-optimal solutions. Too little fitness bias selection results in an unfocused search.
- Mutation:- In a few new offspring formed, some of their genes can be subjected to a low random probability mutation. This indicates that some of the bits in the bit chromosome can be flipped. Mutation happens to take care of diversity among the population and stop premature convergence.
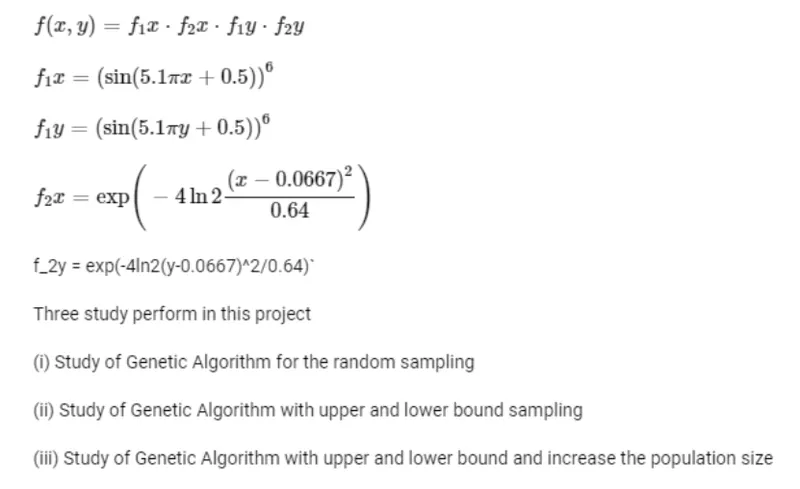
The stalagmite function used in the program is written below.
Matlab code:-
clear all
close all
clc
%defining our search space
x=linspace(0,0.6,150);
y=linspace(0,0.6,150);

%Creating 2Dimensional mesh
[xx,yy]=meshgrid(x,y);
num_case=150;

%evaluating the stalagmite function
for i=1:length(xx)
    for j=1:length(yy)
        input_vector(1)=xx(i,j);
        input_vector(2)=yy(i,j);
        f(i,j)=stalagmite(input_vector);
    end
end

%study 1
tic
for i=1:num_case
    [inputs,Fopt(i)]=ga(@stalagmite,2);
    xopt(i)=inputs(1);
    yopt(i)=inputs(2);
end

study_time_1=toc

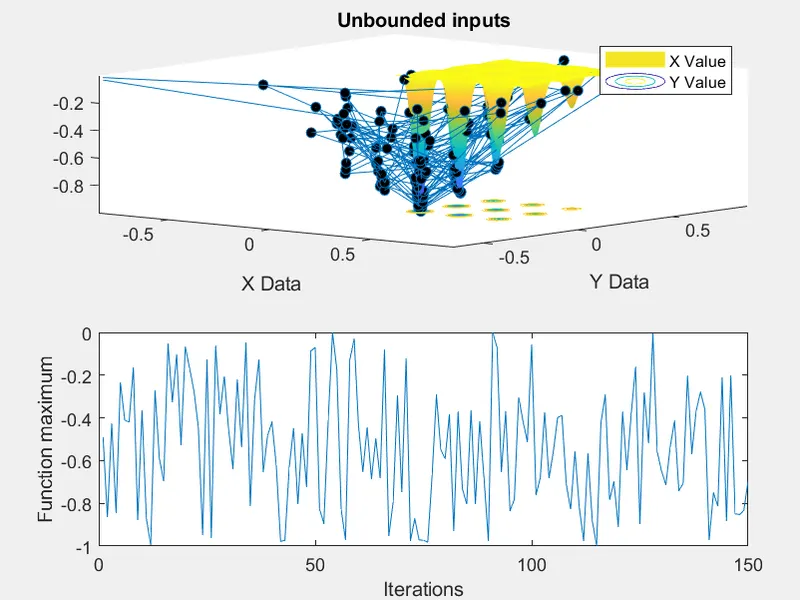
figure(1)
subplot(2,1,1);
hold on
surfc(x,y,f);
shading interp;
xlabel('X Data');
ylabel('Y Data');
plot3(xopt,yopt,Fopt,'marker','o','markersize',5,'markerfacecolor','k')
title('Unbounded inputs')
legend('X Value','Y Value')
subplot(2,1,2);
plot(Fopt);
xlabel('Iterations');
ylabel('Function maximum');

%study 2
tic
for i=1:num_case
    [inputs,Fopt(i)]=ga(@stalagmite,2,[],[],[],[],[0,0],[.6,.6]);
    xopt(i)=inputs(1);
    yopt(i)=inputs(2);
end

study_time_2=toc

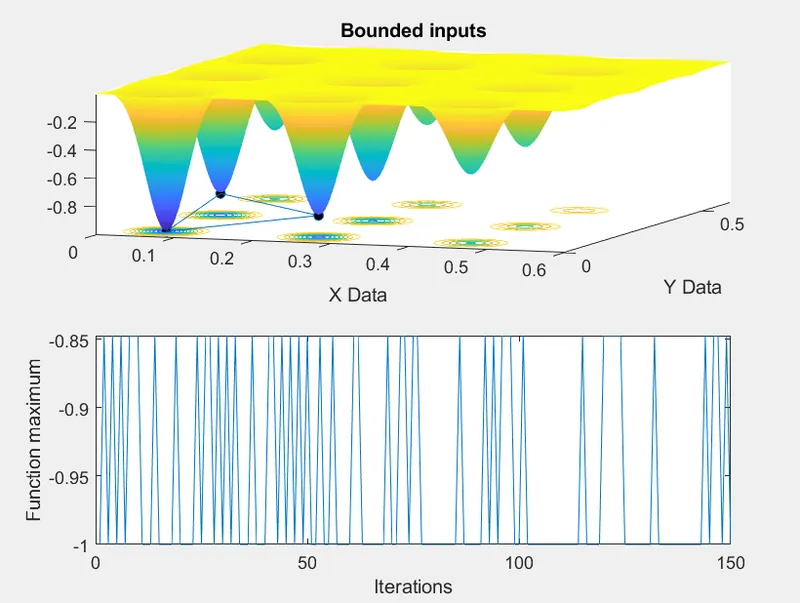
figure(2)
subplot(2,1,1);
hold on
surfc(x,y,f);
shading interp;
xlabel('X Data');
ylabel('Y Data');
plot3(xopt,yopt,Fopt,'marker','o','markersize',5,'markerfacecolor','k')
title('Bounded inputs')
subplot(2,1,2);
plot(Fopt);
xlabel('Iterations');
ylabel('Function maximum');

%study 3
options=optimoptions('ga');
options=optimoptions(options,'populationsize',450);
tic
for i=1:num_case
    [inputs,Fopt(i)]=ga(@stalagmite,2,[],[],[],[],[0,0],[.6,.6],[],[],options);
    xopt(i)=inputs(1);
    yopt(i)=inputs(2);
end

study_time_3=toc

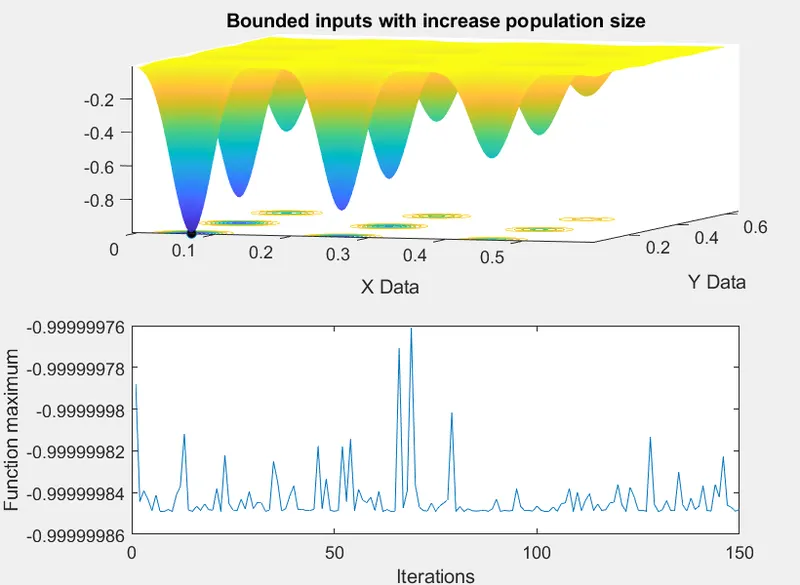
figure(3)
subplot(2,1,1);
hold on
surfc(x,y,f);
shading interp;
xlabel('X Data');
ylabel('Y Data');
plot3(xopt,yopt,Fopt,'marker','o','markersize',5,'markerfacecolor','k')
title('Bounded inputs with increase population size')
subplot(2,1,2);
plot(Fopt);
xlabel('Iterations');
ylabel('Function maximum');
Output:-