Week 4.1 - Genetic Algorithm
Aim: To write a code in MATLAB to optimise the stalagmite function and find the global maxima of the function
Genetic Algorithm (GA):
GA is a search-based optimization technique based on the principles of Genetics and Natural Selection. It is frequently used to find optimal or near-optimal solutions to difficult problems. It is used to solve optimization problems, in research, and in machine learning.
Optimization:
Optimization is the process of making something better. In any process, we have a set of inputs and a set of outputs.
Inputs----->|Process|----->Outputs
It refers to finding the values of the inputs in such a way that we get the 'best' output values. the 'best' refers to maximizing or minimizing one or more objective functions, by varying the input parameters.
Stalagmite Function:
A stalagmite is an upward-growing mound of mineral deposits that have precipitated from water dripping onto the floor of a cave. Most stalagmites have rounded or flattened tips.
A stalagmite function refers to the function with which we are generating values over a stalagmite kind of surface for finding out the local and global maxima and minima of that particularly given function.
For this, in MATLAB we use a method called 'Optimization'. It is programming that does a selection of the best element with regard to some criterion from some set of population.
Optimization is done by systematically choosing input values from within an allowed set and computing the results of the function.
In MATLAB to perform optimization, we use the 'GA' method which is an inbuilt function in MATLAB to find the global maxima of that given stalagmite function.
Formula:
F(x, y) = f1x.f2x.f1y.f2y
Where,
f1x = [sin(5.1 + 0.5)]6
f1y = [sin(5.1 + 0.5)]6
f1x = exp[-ln(2)*(x-0.0667)2/0.64]
f1y = exp[-ln(2)*(y-0.0667)2/0.64]
What Are Genetic Algorithms?
A genetic algorithm is a search heuristic that is inspired by Charles Darwin’s theory of natural evolution. This algorithm reflects the process of natural selection where the fittest individuals are selected for reproduction in order to produce offspring of the next generation.
The Notion of Natural Selection:
The process of natural selection starts with the selection of the fittest individuals from a population. They produce offspring which inherit the characteristics of the parents and will be added to the next generation. If parents have better fitness, their offspring will be better than parents and have a better chance at surviving. This process keeps on iterating and in the end, a generation with the fittest individuals will be found.
This notion can be applied to a search problem. We consider a set of solutions for a problem and select the set of best ones out of them.
Five phases are considered in a genetic algorithm.
- Initial population
- Fitness function
- Selection
- Crossover
- Mutation
Initial Population: The process begins with a set of individuals which is called a Population. Each individual is a solution to the problem you want to solve.
An individual is characterized by a set of parameters (variables) known as Genes. Genes are joined into a string to form a Chromosome (solution).
In a genetic algorithm, the set of genes of an individual is represented using a string, in terms of an alphabet. Usually, binary values are used (strings of 1s and 0s). We say that we encode the genes in a chromosome.
Fitness Function: The fitness function determines how to fit an individual is (the ability of an individual to compete with other individuals). It gives a fitness score to each individual. The probability that an individual will be selected for reproduction is based on its fitness score.
Selection: The idea of the selection phase is to select the fittest individuals and let them pass their genes to the next generation.
Two pairs of individuals (parents) are selected based on their fitness scores. Individuals with high fitness have more chances to be selected for reproduction.
Crossover: Crossover is the most significant phase in a genetic algorithm. For each pair of parents to be mated, a crossover point is chosen at random from within the genes.
For example, consider the crossover point to be 3 as shown below.
Offspring are created by exchanging the genes of parents among themselves until the crossover point is reached.
The new offspring are added to the population.
Mutation: In certain new offspring formed, some of their genes can be subjected to a mutation with a low random probability. This implies that some of the bits in the bit string can be flipped.
Mutation occurs to maintain diversity within the population and prevent premature convergence.
Termination: The algorithm terminates if the population has converged (does not produce offspring which are significantly different from the previous generation). Then it is said that the genetic algorithm has provided a set of solutions to our problem.
Comments: The population has a fixed size. As new generations are formed, individuals with the least fitness die, providing space for new offspring.
The sequence of phases is repeated to produce individuals in each new generation who are better than the previous generation.
The syntax for Genetic Algorithm:
x = ga(fun,nvars)x, to the objective function, fun. nvars is the dimension (number of design variables) of fun.
Note
Passing Extra Parameters explains how to pass extra parameters to the objective function and nonlinear constraint functions, if necessary.
x = ga(fun,nvars,A,b,Aeq,beq,lb,ub,nonlcon)nonlcon. The function nonlcon accepts x and returns vectors C and Ceq, representing the nonlinear inequalities and equalities respectively. ga minimizes the fun such that C(x) ≤ 0 and Ceq(x) = 0. (Set lb=[] and ub=[] if no bounds exist.)
x = ga(fun,nvars,A,b,[],[],lb,ub,nonlcon,IntCon)x = ga(fun,nvars,A,b,[],[],lb,ub,nonlcon,IntCon,options)IntCon take integer values.
Note: When there are integer constraints, ga does not accept linear or nonlinear equality constraints, only inequality constraints.
[ also returns a matrix x,fval,exitflag,output,population,scores] = ga(___)population, whose rows are the final population, and a vector scores, the scores of the final population.
Program:
Stalagmite Function:
% Stalagmite function
function[z] = stalagmite(input_vector)

% Defining Objective Function
x = input_vector(1); % defining inputs x
y = input_vector(2); % defining inputs y

% Formula
% z = -(f1x*f2x*f1y*f2y);

% Calculating values of input
% f1x = [sin(5.1*pi*x+0.5)].^6
% f1y = [sin(5.1*pi*y+0.5)].^6
% f2x = exp[-4ln(2).*((x-0.667).^2)./0.64]
% f2y = exp[-4ln(2).*((y-0.667).^2)./0.64]

f1x = (sin((5.1*pi*x)+0.5)).^6;
f1y = (sin((5.1*pi*y)+0.5)).^6;
f2x = exp(-4*log(2).*((x-0.667).^2)./0.64);
f2y = exp(-4*log(2).*((y-0.667).^2)./0.64);

z = -(f1x*f2x*f1y*f2y);
end
End of the Stalagmite Function
Main Program:
% Clearing Workspace, Command Window and Closing Previous Plots
clear all
close all
clc

% Inputs
x = linspace(0,0.6,150); % taking 150 values between 0 to 0.6
y = linspace(0,0.6,150); % taking 150 values between 0 to 0.6
num_cases = 50; % no. of iterations to 50
% Forming 2D arrays
[xx yy] = meshgrid(x,y);

for i = 1:length(xx)
    for j = 1:length(yy)
        input_vector(1) = xx(i,j);
        input_vector(2) = yy(i,j);
        f(i,j) = stalagmite(input_vector);
    end
end
tic
% Study 1 - Satistical Behavior of Unbounded Inputs

for i = 1:num_cases
    [results, fopt(i)] = ga(@ stalagmite, 2)
    xopt(i) = results(1);
    yopt(i) = results(2);
end

study1_time = toc

figure(1)
subplot(2,1,1)
surf(x, y, -f) % to get 3D surface
shading interp
hold on
plot3(xopt,yopt,-fopt,'marker','o','markersize',5,'markerfacecolor','r')
title('Unbounded Inputs')
subplot(2,1,2)
plot(-fopt)
title('Iteration vs Function Maximum')
xlabel('Iterations')
ylabel('Function minimum')

% Study 2- Statistical Behavior of Bounded Inputs

tic
for i = 1:num_cases
    [results,fopt(i)] = ga(@stalagmite,2,[],[],[],[],[0;0],[0.6;0.6]);
        xopt(i) = results(1)
        yopt(i) = results(2)
end
study2_time = toc
figure(2)
subplot(2,1,1)
surf(x,y,-f)
shading interp
hold on
plot3(xopt,yopt,-fopt,'marker','o','markersize',5,'markerfacecolor','r')
title('Bounded Inputs')
subplot(2,1,2)
plot(-fopt)
title('Iteration vs Function Maximum')
xlabel('Iteration')
ylabel('Function Maximum')

% Study 3- Statistical Behavior of Increased Initial Population
tic
options = optimoptions('ga');
options = optimoptions(options,'populationsize',250);
for i = 1:num_cases
    [results,fopt(i)] = ga(@stalagmite,2,[],[],[],[],[0;0],[0.6;0.6],[],[],options);
     xopt(i) = results(1);
     yopt(i) = results(2);
end
study3_time = toc
figure(3)
subplot(2,1,1)
surf(x,y,-f)
shading interp
hold on
plot3(xopt,yopt,-fopt,'marker','o','markersize',5,'markerfacecolor','r')
title('Increased Initial Population')
subplot(2,1,2)
plot(-fopt)
title('Iteration vs Function Maximum')
xlabel('Iteration')
ylabel('Function Maximum')
End of the program
Explanation of the Program and Stalagmite function:
Study 1: Unbounded Values
Clearing Workspace, Command Window and Closing Previous Plots
clear all
close all
clc
% Inputs
x = linspace(0,0.6,150); % taking 150 values between 0 to 0.6
y = linspace(0,0.6,150); % taking 150 values between 0 to 0.6
num_cases = 50; % no. of iterations to 50
% Forming 2D arrays
[xx yy] = meshgrid(x,y);
To plot a 3D surface plot, take the 2D array of x and y using meshgrid command and store them in input_vector array, stalagmite function is called for this.
for i = 1:length(xx)
for j = 1:length(yy)
input_vector(1) = xx(i,j);
input_vector(2) = yy(i,j);
f(i,j) = stalagmite(input_vector);
end
end
Stalagmite function has been created to take the output as -f since ga only minimises a given function. So if -f considered it automatically gives us the maxima.
% Stalagmite function
function[z] = stalagmite(input_vector)
% Defining Objective Function
x = input_vector(1); % defining inputs x
y = input_vector(2); % defining inputs y
% Formula
% z = -(f1x*f2x*f1y*f2y);
% Calculating values of input
% f1x = [sin(5.1*pi*x+0.5)].^6
% f1y = [sin(5.1*pi*y+0.5)].^6
% f2x = exp[-4ln(2).*((x-0.667).^2)./0.64]
% f2y = exp[-4ln(2).*((y-0.667).^2)./0.64]
f1x = (sin((5.1*pi*x)+0.5)).^6;
f1y = (sin((5.1*pi*y)+0.5)).^6;
f2x = exp(-4*log(2).*((x-0.667).^2)./0.64);
f2y = exp(-4*log(2).*((y-0.667).^2)./0.64);
z = -(f1x*f2x*f1y*f2y);
end
Continuation of Study 1
No. of iteration = num_cases and using the genetic algorithm function to calculate the maxima of the function. Outputs are stored into results that contain maxima and fopt which contain the value at which the maxima is obtained.
Study 1 - Statistical Behavior of Unbounded Inputs
The ga is initiated with a random population.
tic
for i = 1:num_cases
[results, fopt(i)] = ga(@ stalagmite, 2)
xopt(i) = results(1);
yopt(i) = results(2);
end
study1_time = toc
To get complete cycle, the tic toc command is used to record the time.
figure(1)
subplot(2,1,1)
surf(x, y, -f) % to get 3D surface
shading interp
hold on
plot3(xopt,yopt,-fopt,'marker','o','markersize',5,'markerfacecolor','r')
title('Unbounded Inputs')
subplot(2,1,2)
plot(-fopt)
title('Iteration vs Function Maximum')
xlabel('Iterations')
ylabel('Function minimum')
Storing the results into xopt,yopt, plot the surface of x,y,-f tp get the 3D plot.
To get the time taken to complete the cycle by using the tic toc command to record the time.
Study 1 output is executed as:
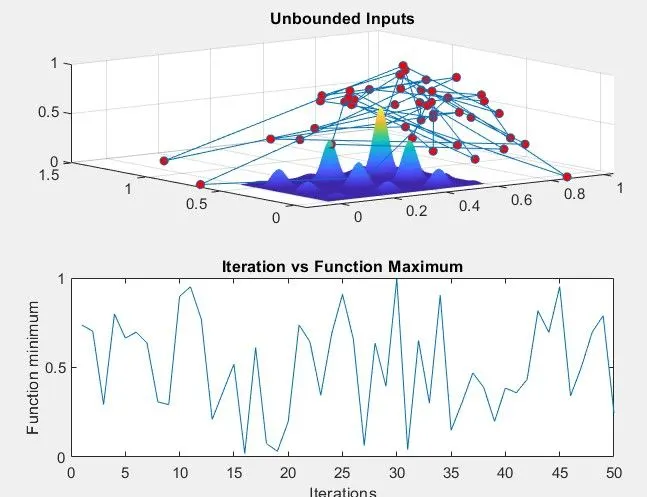
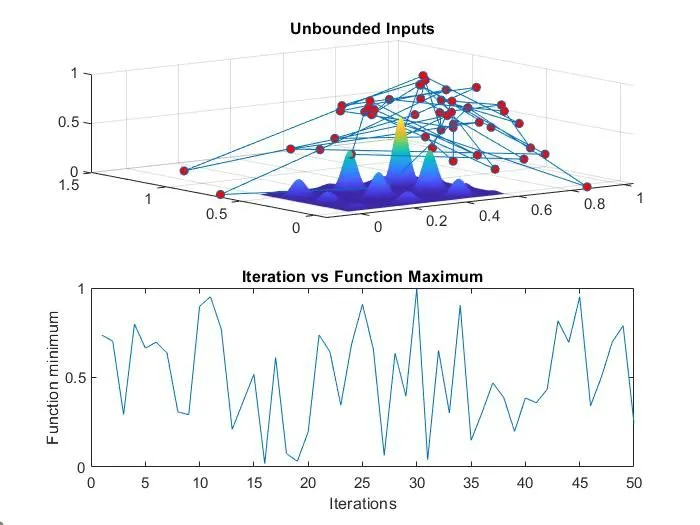
The optimal values went outside the values of x and y resulting in falling away from the stalagmite surface.
Failed to reach the global maxima in this case.
The Study time = 3.4044
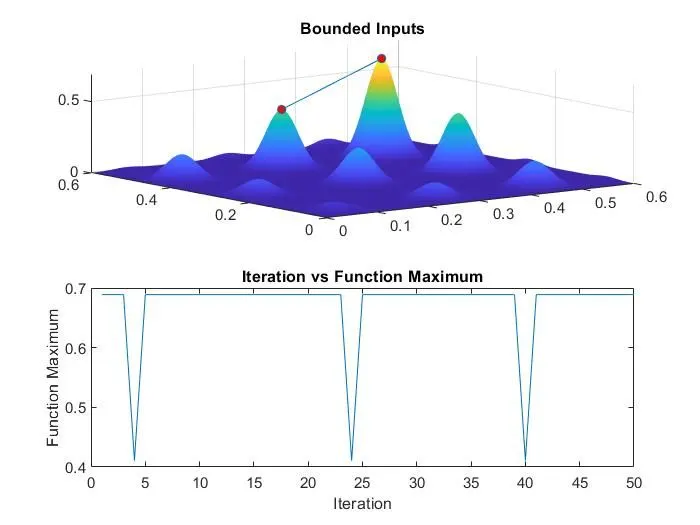
Study 2: Bonded Values
Specifying the lower and upper bounds of x and y in this case, the ga is initiated with a random population only.
tic
for i = 1:num_cases
[results,fopt(i)] = ga(@stalagmite,2,[],[],[],[],[0;0],[0.6;0.6]);
xopt(i) = results(1)
yopt(i) = results(2)
end
study2_time = toc
figure(2)
subplot(2,1,1)
surf(x,y,-f)
shading interp
hold on
plot3(xopt,yopt,-fopt,'marker','o','markersize',5,'markerfacecolor','r')
title('Bounded Inputs')
subplot(2,1,2)
plot(-fopt)
title('Iteration vs Function Maximum')
xlabel('Iteration')
ylabel('Function Maximum')
Storing the results into xopt,yopt, plot the surface of x,y,-f tp get the 3D plot.
To get the time taken to complete the cycle by using the tic toc command to record the time.
Study 2 output is executed as: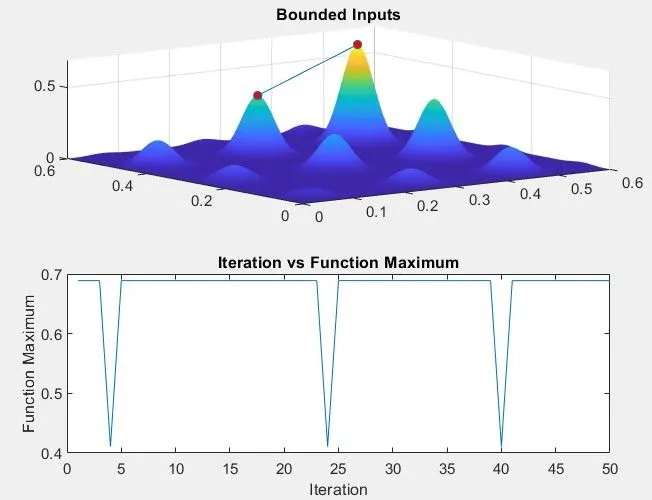
Though the optimum values are within the limits it could not give us the exact maxima values.
The Study time = 4.0090 more than the above study.
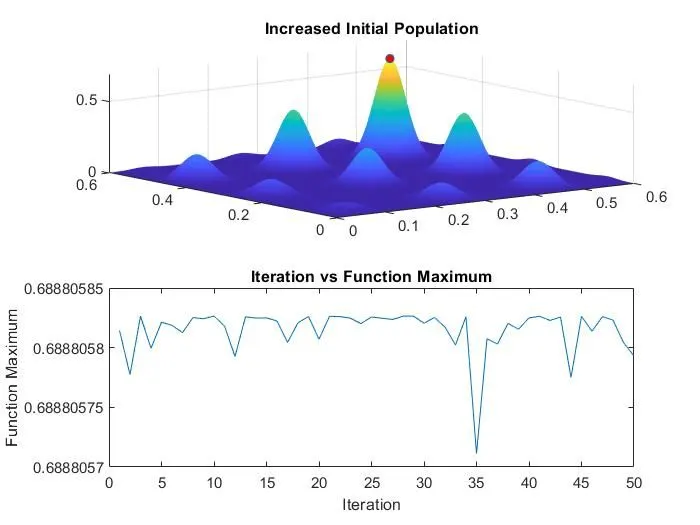
Study 3: Initial Population and Bounded values
Increasing initial population which default as 50 to 250.
tic
options = optimoptions('ga');
options = optimoptions(options,'populationsize',250);
for i = 1:num_cases
[results,fopt(i)] = ga(@stalagmite,2,[],[],[],[],[0;0],[0.6;0.6],[],[],options);
xopt(i) = results(1);
yopt(i) = results(2);
end
study3_time = toc
figure(3)
subplot(2,1,1)
surf(x,y,-f)
shading interp
hold on
plot3(xopt,yopt,-fopt,'marker','o','markersize',5,'markerfacecolor','r')
title('Increased Initial Population')
subplot(2,1,2)
plot(-fopt)
title('Iteration vs Function Maximum')
xlabel('Iteration')
ylabel('Function Maximum')
In this case, the initial population is set by using a command called optimumoption and get the value of 'populationsize' to 250
Storing the results into xopt,yopt, plot the surface of x,y,-f tp get the 3D plot.
To get the time taken to complete the cycle by using the tic toc command to record the time.
Study 3 output is executed as:
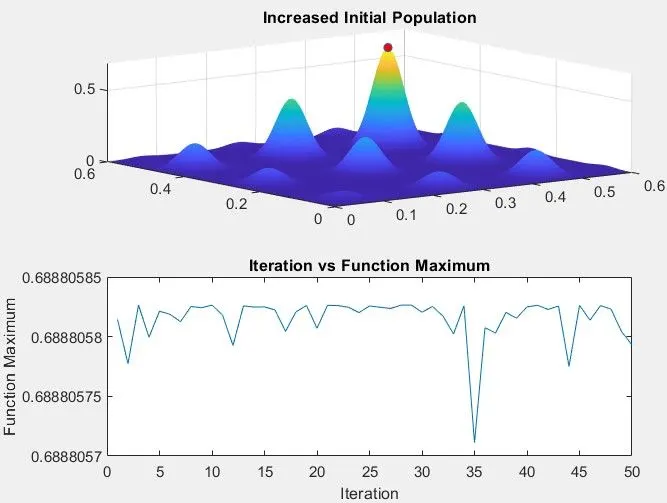
Thought time of execution is more in this case but successful to find out the correct maxima for the stalagmite function.
So by increasing the initial population size of the ga we can increase the accuracy of the algorithm.
The Study time = 23.1109 which is more than the above two studies.
Outputs:
Study 1: Unbonded values
Study 2: Bonded Values
Study 3: Initial Population Size and Bonded Values
All the explanations for the output graphs are given in the program explanation section individually.