Genetic Algorithm - MATLAB
OBJECTIVES
- Write a code in MATLAB to optimise the stalagmite function and find the global maxima of the function.
THEORY
- Genetic Algorithm
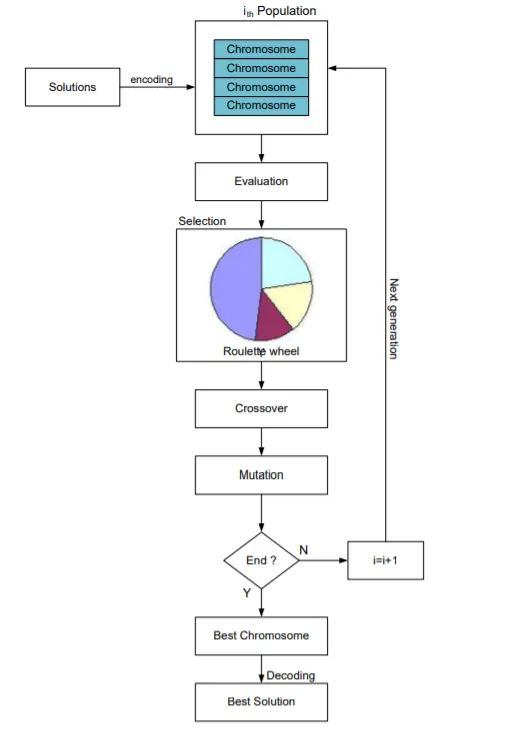
Genetic algorithm developed by Goldberg was inspired by Darwin's theory of evolution which states that the survival of an organism is affected by rule "the strongest species that survives". Darwin also stated that the survival of an organism can be maintained through the process of reproduction, crossover and mutation. Darwin's concept of evolution is then adapted to computational algorithm to find solution to a problem called objective function in natural fashion. A solution generated by genetic algorithm is called a chromosome, while collection of chromosome is referred as a population. A chromosome is composed from genes and its value can be either numerical, binary, symbols or characters depending on the problem want to be solved. These chromosomes will undergo a process called fitness function to measure the suitability of solution generated by GA with problem. Some chromosomes in population will mate through process called crossover thus producing new chromosomes named offspring which its genes composition are the combination of their parent. In a generation, a few chromosomes will also mutation in their gene. The number of chromosomes which will undergo crossover and mutation is controlled by crossover rate and mutation rate value. Chromosome in the population that will maintain for the next generation will be selected based on Darwinian evolution rule, the chromosome which has higher fitness value will have greater probability of being selected again in the next generation. After several generations, the chromosome value will converges to a certain value which is the best solution for the problem.
The genetic algorithm process is as follows :
Step 1. Determine the number of chromosomes, generation, and mutation rate and crossover rate value
Step 2. Generate chromosome-chromosome number of the population, and the initialization value of the genes chromosome-chromosome with a random value
Step 3. Process steps 4-7 until the number of generations is met
Step 4. Evaluation of fitness value of chromosomes by calculating objective function
Step 5. Chromosomes selection
Step 6. Crossover
Step 7. Mutation
Step 8. Solution (Best Chromosomes)
- Flowchart of the algorithm
- Stalagmite Function
A stalagmite function is a function which generating values over a stalagmite kind of surface for finding out the local and global maxima and minima of that particular given function.
Here the stalagmite function is given as,
`f(x,y)=f_(1,x)xxf_(2,x)xxf_(1,y)xxf_(2,y)`
Where,
`f_(1,x)=[sin(5.1pix+0.5)]^6`
`f_(1,y)=[sin(5.1piy+0.5)]^6`
`f_(2,x)=exp(-4ln(2)(x-0.667)^2/0.64)`
`f_(2,y)=exp(-4ln(2)(y-0.667)^2/0.64)`
SOLUTION PROCEDURE
When we define the stalagmite function in the program we put a negative sign in the equation of f(x,y). Then only we can find the global maxima of the function using 'ga' function. 'ga' is an inbuilt function in matlab used to find minimum of function using genetic algorithm
MATLAB CODE
% Genetic Algorithm

clear all
close all
clc

x=linspace(0,0.6,150);
y=linspace(0,0.6,150);

[xx, yy] = meshgrid(x,y);

for i=1:length(xx)
    for j=1:length(yy)
        input_vector(1) = xx(i,j);
        input_vector(2) = yy(i,j);
        f(i,j) = stalagmite(input_vector);
    end
end

% case 1 - Statistical behaviour

for k=1:50

    [inputs, fopt(k)] = ga(@stalagmite,2);
    xopt(k) = inputs(2);
    yopt(k) = inputs(2);

end

figure(1)
subplot(2,1,1)
surf(x,y,f)
shading interp
hold on
plot3(xopt,yopt,fopt,'marker','o',MarkerFaceColor='r')
title('unbounded inputs')
subplot(2,1,2)
plot(fopt)
xlabel('Iterations')
ylabel('function minimum')


% case 2 - Statistical behaviour with upper and lower bounds

for k=1:50

    [inputs, fopt(k)] = ga(@stalagmite,2,[],[],[],[],[0,0],[0.6,0.6]);
    xopt(k) = inputs(2);
    yopt(k) = inputs(2);

end

figure(2)
subplot(2,1,1)
surf(x,y,f)
shading interp
hold on
plot3(xopt,yopt,fopt,'marker','o',MarkerFaceColor='r')
title('bounded inputs')
subplot(2,1,2)
plot(fopt)
xlabel('Iterations')
ylabel('function minimum')

% case 3 - population increased

options = optimoptions('ga');
options = optimoptions(options,'PopulationSize',250);

for k=1:50

    [inputs, fopt(k)] = ga(@stalagmite,2,[],[],[],[],[0,0],[0.6,0.6],[],[],options);
    xopt(k) = inputs(2);
    yopt(k) = inputs(2);

end

figure(3)
subplot(2,1,1)
surf(x,y,f)
shading interp
hold on
plot3(xopt,yopt,fopt,'marker','o',MarkerFaceColor='r')
title('bounded inputs - population increased')
subplot(2,1,2)
plot(fopt)
xlabel('Iterations')
ylabel('function minimum')
CODE EXPLANATION
- First 3 lines is used to clear all variables from workspace, close all figure handles, and clear the command window.
- Line 7 to 8 - Defining x and y arrays for generating surface to project the function.
- [xx, yy] = meshgrid(x, y) - meshgrid returns 2-D grid coordinates based on the coordinates contained in vectors x and y.
- Line 12 to 17 - For loop starts. It is used to create a array of containing values of stalagmite function 'f'. Inside for loop we call the 'stalagmite' function.
- Line 22 to 28 - Next for loop is for creating arrays for x and y co-ordinates of minimum function and store minimum function. We run for 50 times. Inside the loop we use 'ga' function.
- ga - It is an inbuilt function in matlab used to find the minimum of function using genetic algorithm. Inside the 'ga' function we call the 'stalagmite' function and define the number of variables. In this case there are 2 variables.
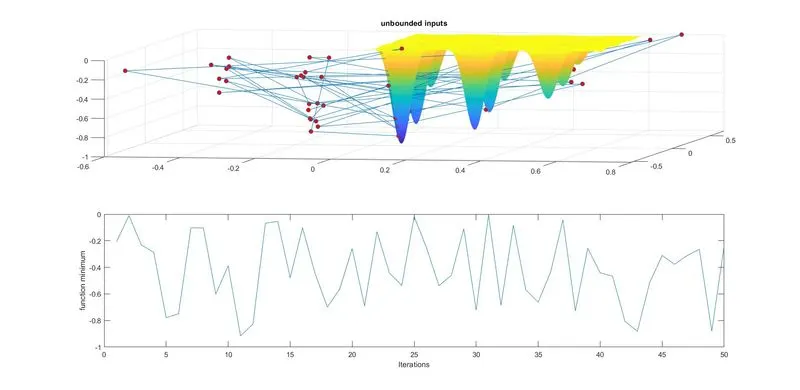
- Line 20 to 40 - 1st case. Here we didn't define the boundary to values taken by the 'ga' function.
- figure() - To create figure windows.
- subplot() - subplot( m , n , p ) divides the current figure into an m -by- n grid and creates axes in the position specified by p .
- surf() - surf( X , Y , Z ) creates a three-dimensional surface plot, which is a three-dimensional surface that has solid edge colors and solid face colors.
- shading interp - The shading function controls the color shading of surface and patch graphics objects. Shading interp varies the color in each line segment and face by interpolating the colormap index or true color value across the line or face.
- plot3() - plot3( X , Y , Z ) plots coordinates in 3-D space. To plot a set of coordinates connected by line segments, specify X , Y , and Z as vectors of the same length. To plot multiple sets of coordinates on the same set of axes, specify at least one of X , Y , or Z as a matrix and the others as vectors.
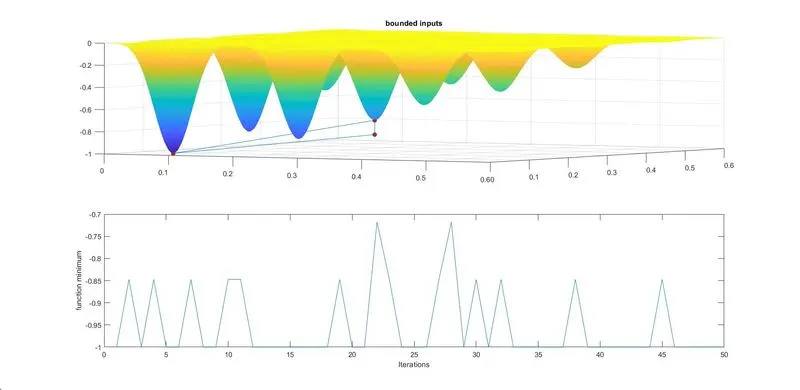
- Line 45 to 63 - 2st case. Here we define the boundary to values taken by the 'ga' function.
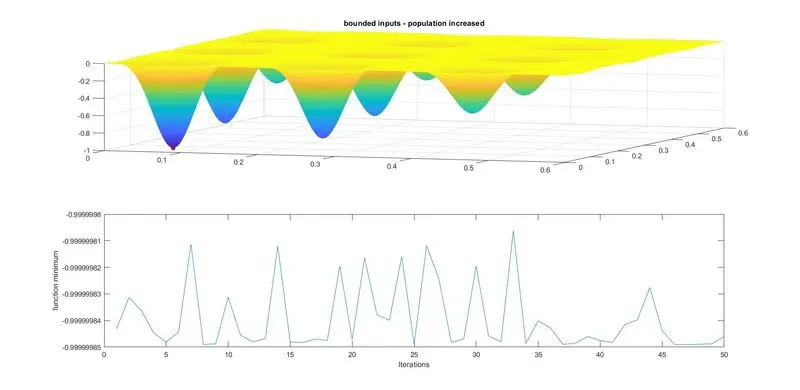
- Line 67 to 88 - 3st case. Here we increase the population size to 250 with bounded inputs.
- optimoptions - optimoptions organizes options by solver, with a more focused and comprehensive display than optimset : Creates and modifies only the options that apply to a solver. Shows your option choices and default values for a specific solver/algorithm.
- options - Set options for ga by using optimoptions.
- PopulationSize - It is used to define the population size of ga. The default population size used by ga is 50 when the number of decision variables is less than 5, and 200 otherwise.
RESULTS
- Case 1 - Statistical Behaviour
- Case 2 - Statistical behaviour with upper and lower bounds
- Case 3 - Increased population
CONCLUSION
We can understand that case 3 is giving the right answer.
- For the first case we didn't define boundary values taken by 'ga'. So for each iteration it passes random values to the function and causes more points for minimum function.
- In the 2nd case we define the boundary. So for each iteration it passes only the random variables within the boundary, which 0 to 0.6 in both x and y direction.
- In the third case, we increased the population size, here population refers to the set of data points. By default population size is taken as 50. So we changed into 250, which results only one value for Minimum function.
Function Minimum = -0.99999
But actually our objective is to find the global maxima. Since we use 'ga' it only gives the minimum value. In order to solve that we change the 'stalagmite' function into negative.( Put a negative sign in the equation of f). So we get the global minima as -0.99999981.
Since we change the stalagmite function to negative,
The Global Maxima of stalagmite function is , -(-0.99999981)
Which is,
Global Maxima = 0.99999981