Week 4.1 - Genetic Algorithm
clear all
close all
clc
%defining our search space
x = linspace(0,0.6,150);
y = linspace(0,0.6,150);
%creating 2dimensional mesh
[xx yy] = meshgrid(x,y);
%evaluating the stalagmite function
for i = 1:length(xx)
for j = 1:length(yy)
input_vector(1) = xx(i,j);
input_vector(2) = yy(i,j);
f(i,j) = himu26(input_vector);
end
end
surfc(xx,yy,f)
xlabel = ('x value')
ylabel = ('y value')
shading interp
[x,fval] = ga(@himu26,2)
This is programe is used for the creating the and finding the mini and max values of the fuction this max/mini values are see in the graphs as showin in the fig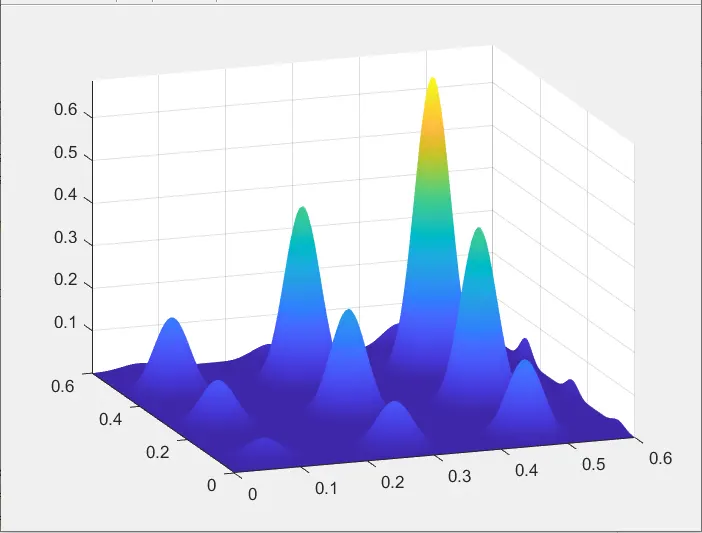
TO form the fuction we need to creat the stalagmite code is
function [f] = himu26(input_vector)
x = input_vector(1);
y = input_vector(2);
fx1 = (sin((5.1*pi)*x+0.5))^6;
fy1 = (sin((5.1*pi)*y+0.5))^6;
fx2 = exp(-4*log(2)*(((x-0.6667)^2)/0.64));
fy2 = exp(-4*log(2)*(((y-0.6667)^2)/0.64));
f = (fx1*fy1*fx2*fy2);
THE REPORT ABOUT THE GENETIC ALGORITHM
this algorithm reflects the process of natural selection where the fittest individuals are selected for reproduction in order to produce off spring of the next generation.the working of genetic algorithm works by building a population of chromoremes which is a set of possible solution to the optimization promble,with in a generation of a population the chromosomes are ramdomly altered in hopes of creating new chromosomes that have better evalting scores the working of the genetic algorithm isthe algorithm begines by creating a random initial population the alogorithm then creates asequence of new populations individuals in the current generation to creat the next popluation
clear all
close all
clc
%defining our search space
x = linspace(0,0.6,150);
y = linspace(0,0.6,150);
%creating 2dimensional mesh
[xx yy] = meshgrid(x,y);
%evaluating the stalagmite function
for i = 1:length(xx)
for j = 1:length(yy)
input_vector(1) = xx(i,j);
input_vector(2) = yy(i,j);
f(i,j) =stalagmite(input_vector);
end
end
for k = 1:50
[x1,fval(k)] = ga(@stalagmite,2);
x_input(k) = x1(1);
y_input(k) = x1(2);
end
hold on
surfc(xx,yy,-f)
plot3(x_input,y_input,-fval,'marker','o','markersize',5,'markerfacecolor','r')
xlabel = ('x value')
ylabel = ('y value')
shading interp
THIS IS THE ANOTHER CASE
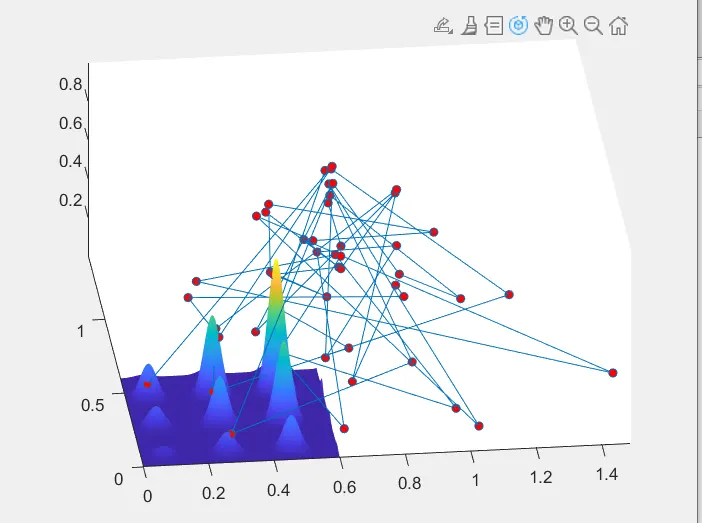
The output of the fuction is