Week 4.1 - Genetic Algorithm
Aim,
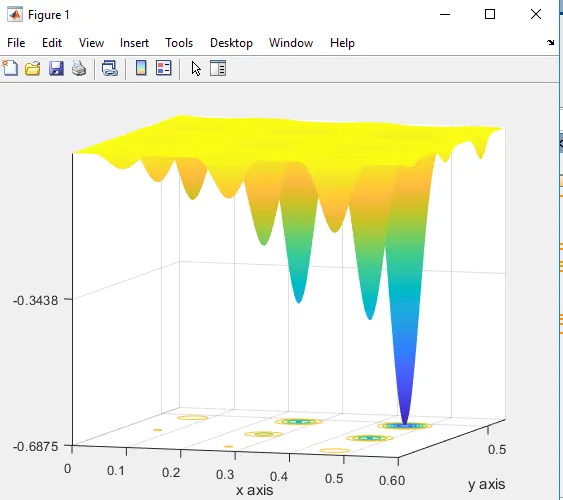
To find the Global maxima for the stalagmite function using GA in matlab.
Syntax of G.A,
(i), x=ga(@func,nvars)
(ii), x=ga(@func,nvars,A,B,Aeq,Beq,lb,Ub)
(iii), x=ga(@func,nvars,A,B,Aeq,Beq,lb,Ub,nonlcon,intcon,options)
where:
ga - genetic algorithm
func - function
nvars - no. of. variables
A - A matrix for linear inequality constraints
B - b vector for linear inequality constraints
Aeq - Aeq matrix for linear equality constraints
Beq - beq vector for linear equality constraints
lb - Lower bound on x
Ub - Upper bound on x
nonlcon - Nonlinear constraint function
intcon - Indices of integer variables
options - Options created using optimoptions or an options structure
Stalagmite function
function[f]=stalagmite(input_vector)
x=input_vector(1);
y=input_vector(2);

f1=(sin(5.1*pi*x+0.5))^6;
f2=(sin(5.1*pi*y+0.5))^6;
f3=exp((-4*log(2)*(x-0.667)^2/(0.64)));
f4=exp((-4*log(2)*(y-0.667)^2/(0.64)));

f=-(f1*f2*f3*f4);
end
Programming for finding global maxima:
clear all
close all
clc

x= linspace (0,0.6,150);
y= linspace (0,0.6,150);
num_cases=50;
% creating 2D mesh
[xx,yy]= meshgrid(x,y);

% stalagmite function
for i=1:length(xx);
    for j=1:length(yy);
        input_vector(1)=xx(i,j);
        input_vector(2)=yy(i,j);
        f(i,j)=stalagmite(input_vector);
    end;
end;

surfc(xx,yy,f);
xlabel('x axis');
ylabel('y axis');
shading interp;

tic
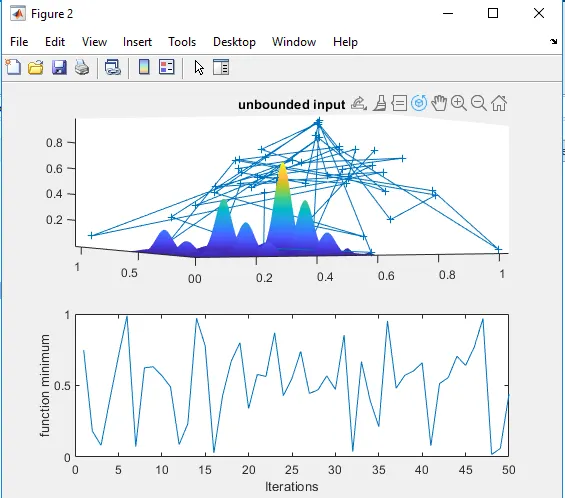
% study 1 - satistical behavior-unbounded condition
for i= 1: num_cases
    [inputs,fopt(i)]=ga(@stalagmite,2);
    xopt(i)=inputs(1);
    yopt(i)=inputs(2);
end
study1_time=toc

figure(2)
subplot(2,1,1);
hold on
surfc(xx,yy,-f);
shading interp;
plot3(xopt,yopt,-fopt,'marker','+','markersize',5,'markerfacecolor','r');
title('unbounded input');
subplot(2,1,2);
plot(-fopt);
xlabel('Iterations');
ylabel('function minimum');

tic
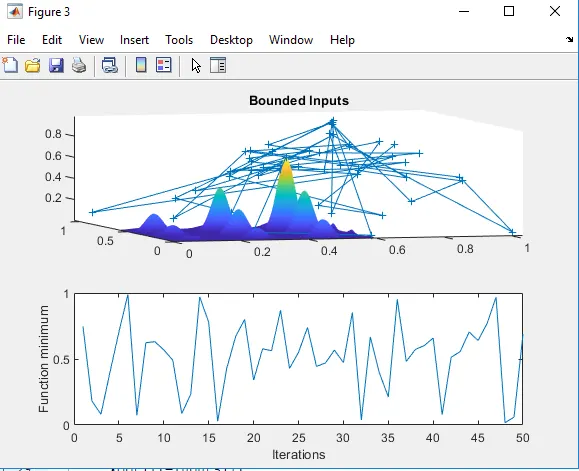
% study 2 - statistical behaviour - with upper and lower bounds

for i=num_cases
    [inputs,fopt(i)]=ga(@stalagmite,2,[],[],[],[],[0;0],[0.6;0.6]);
    xopt(i)=inputs(1);
    yopt(i)=inputs(2);
end
study2_time=toc;

figure(3);
subplot(2,1,1);
hold on ;
surfc(xx,yy,-f);
shading interp;
plot3(xopt,yopt,-fopt,'marker','+','markersize',5,'markerfacecolor','r');
title('Bounded Inputs');
subplot(2,1,2);
plot(-fopt);
xlabel('Iterations');
ylabel('Function minimum');

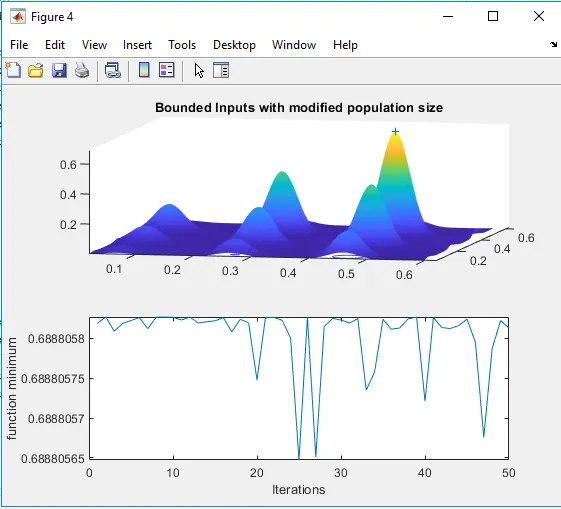
% study_3 Increasing ga iterations
options=optimoptions('ga');
options=optimoptions(options,'populationsize',170);

tic

for i=1:num_cases;
    [inputs,fopt(i)]=ga(@stalagmite,2,[],[],[],[],[0;0],[0.6;0.6],[],[],options);
    xopt(i)=inputs(1);
    yopt(i)=inputs(2);
end

study3_time=toc;
figure(4);
subplot(2,1,1);
hold on;
surfc(xx,yy,-f);
shading interp;
plot3(xopt,yopt,-fopt,'marker','+','markersize',5,'markerfacecolor','r');
title('Bounded Inputs with modified population size');
subplot(2,1,2);
plot(-fopt);
xlabel('Iterations');
ylabel('function minimum');
study 1 - satistical behavior-unbounded condition
study 2 - statistical behaviour - with upper and lower bounds
study_3 Increasing ga iterations
Results:
This point of the peak is called global maxima.