Week 4.1 - Genetic Algorithm
AIM
To optimize the given stalagmite function and find the global maxima.
A genetic algorithm (GA) is a method for solving both constrained and unconstrained optimization problems based on a natural selection process that mimics biological evolution. The algorithm repeatedly modifies a population of individual solutions. The sequence of points approaches an optimal solution.
At each step, the genetic algorithm uses the current population to create the children that make up the next generation. The algorithm selects a group of individuals in the current population, called parents, who contribute their genes—the entries of their vectors—to their children.
three main component or genetic operation in generic algorithm are crossover , mutation and selection of the fittest.
Code
close all
clear all
clc
% defining the search space
x = linspace(0,0.6,150);
y = linspace(0,0.6,150);
% to create 2d mesh;'
% [xx,yy] = meshgrid(x,y);
% % assigning valus to inputs
for i = 1:length(x)% takes values until length of xx
for j = 1:length(y)% takes values until length of xx
inputs(1) = x(i);
inputs(2) = y(j);
f(i,j) = stalagmite(inputs);
end
end
num_case = 50; % creating a variable and assigning the number to which iterations performed
% f = get_stalagmite(x,y);
tic % Starts the timer
% Studt case-1
for z = 1:num_case % takes values until length of num_cases
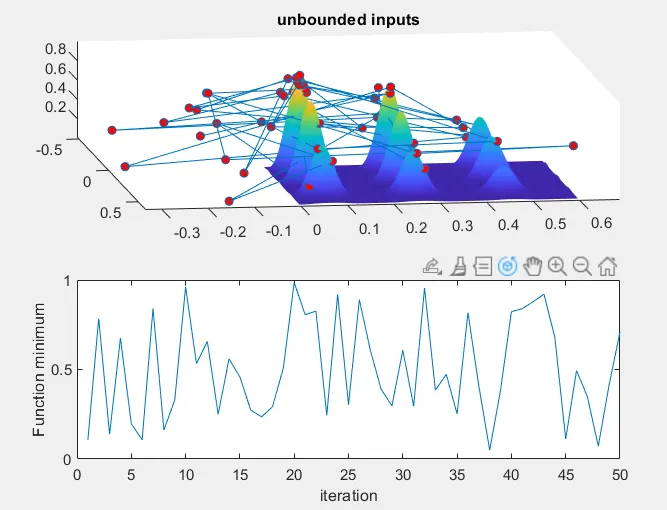
[inputs,fopt(z)] = ga(@stalagmite,2);% solve stalagmite function using GA and assigning to variables
xopt(z) = inputs(1);
yopt(z) = inputs(2);
end
Time_study1 = toc % Gives time taken to perform the case
figure(1)
subplot(2,1,1) % creates sub-plot in the figure
hold on
surfc(x,y,-f) % Creates a surface
shading interp % varies the color in each line segment and face by interpolating the colormap index or true color value across the line or face.
plot3(xopt,yopt,-fopt,'marker','o','markersize',5,'markerfacecolor','r')% plot3 command used to plot in 3 axis
% marker is used to create a visible points on the plot
title('unbounded inputs')
xlabel('x-axis')
ylabel('y-axis')
zlabel('z-axis')
subplot(2,1,2)
plot(-fopt)
xlabel('iterations')
ylabel('Function maximum')
% Study Case-2 Defining upper and lower bounds
tic
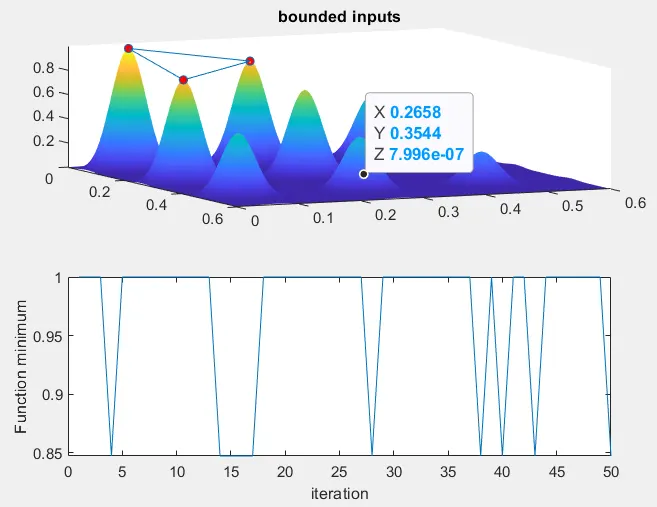
for z = 1:num_case
[inputs,fopt(z)] = ga(@stalagmite,2,[],[],[],[],[0;0],[0.4;0.4]);
%defines a set of lower and upper bounds on the design variables
xopt(z) = inputs(1);
yopt(z) = inputs(2);
end
Time_study2 = toc
figure(2)
subplot(2,1,1)
hold on
surfc(x,y,-f)
shading interp
plot3(xopt,yopt,-fopt,'marker','o','markersize',5,'markerfacecolor','r')
title('Bounded inputs')
xlabel('x-axis')
ylabel('y-axis')
zlabel('z-axis')
subplot(2,1,2)
plot(-fopt)
xlabel('iterations')
ylabel('Function maximum')
clc
% Study Case-3 Increasing iterations
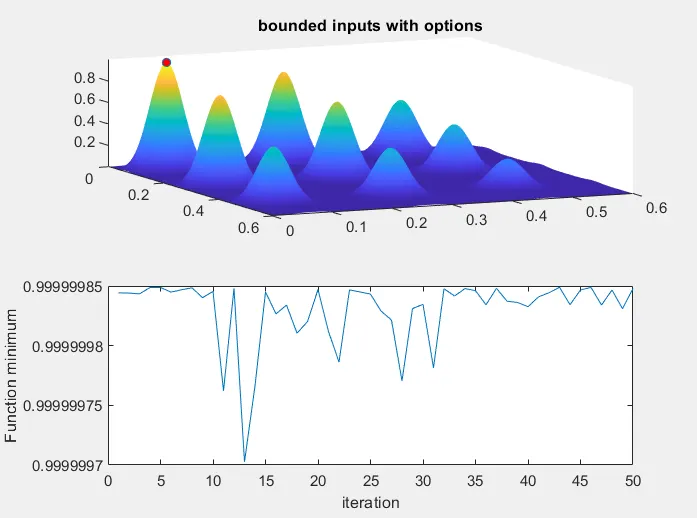
options = optimoptions('ga');% returns a set of default options for the SolverName solver.
options = optimoptions(options,'PopulationSize',270);%Defining population size
tic
for z = 1:num_case
[inputs,fopt(z)] = ga(@stalagmite, 2,[],[],[],[],[0;0],[0.4;0.4],[],[],options);
% takes the values of options and solves ga in required population
xopt(z) = inputs(1);
yopt(z) = inputs(2);
end
Time_study3 = toc;
figure(3)
subplot(2,1,1)
hold on
surfc(x,y,-f)
shading interp
plot3(xopt,yopt,-fopt,'marker','o','markersize',5,'markerfacecolor','r')
title('Increased population')
xlabel('x-axis')
ylabel('y-axis')
zlabel('z-axis')
subplot(2,1,2)
plot(-fopt)
xlabel('iterations')
ylabel('Function maximum')
% The Global Maximum at the position
% display(inputs)
code explanation
close all
clear all
clc
% defining the search space
x = linspace(0,0.6,150);
y = linspace(0,0.6,150);
% to create 2d mesh;'
% [xx,yy] = meshgrid(x,y);
% % assigning valus to inputs
for i = 1:length(x)% takes values until length of xx
for j = 1:length(y)% takes values until length of xx
inputs(1) = x(i);
inputs(2) = y(j);
f(i,j) = stalagmite(inputs);
end
end
num_case = 50; % creating a variable and assigning the number to which iterations performed
% f = get_stalagmite(x,y);
tic % Starts the timer
% Studt case-1
for z = 1:num_case % takes values until length of num_cases
[inputs,fopt(z)] = ga(@stalagmite,2);% solve stalagmite function using GA and assigning to variables
xopt(z) = inputs(1);
yopt(z) = inputs(2);
end
Time_study1 = toc % Gives time taken to perform the case
figure(1)
subplot(2,1,1) % creates sub-plot in the figure
hold on
surfc(x,y,-f) % Creates a surface
shading interp % varies the color in each line segment and face by interpolating the colormap index or true color value across the line or face.
plot3(xopt,yopt,-fopt,'marker','o','markersize',5,'markerfacecolor','r')% plot3 command used to plot in 3 axis
% marker is used to create a visible points on the plot
title('unbounded inputs')
xlabel('x-axis')
ylabel('y-axis')
zlabel('z-axis')
subplot(2,1,2)
plot(-fopt)
xlabel('iterations')
ylabel('Function maximum')
% Study Case-2 Defining upper and lower bounds
tic
for z = 1:num_case
[inputs,fopt(z)] = ga(@stalagmite,2,[],[],[],[],[0;0],[0.4;0.4]);
%defines a set of lower and upper bounds on the design variables
xopt(z) = inputs(1);
yopt(z) = inputs(2);
end
Time_study2 = toc
figure(2)
subplot(2,1,1)
hold on
surfc(x,y,-f)
shading interp
plot3(xopt,yopt,-fopt,'marker','o','markersize',5,'markerfacecolor','r')
title('Bounded inputs')
xlabel('x-axis')
ylabel('y-axis')
zlabel('z-axis')
subplot(2,1,2)
plot(-fopt)
xlabel('iterations')
ylabel('Function maximum')
clc
% Study Case-3 Increasing iterations
options = optimoptions('ga');% returns a set of default options for the SolverName solver.
options = optimoptions(options,'PopulationSize',270);%Defining population size
tic
for z = 1:num_case
[inputs,fopt(z)] = ga(@stalagmite, 2,[],[],[],[],[0;0],[0.4;0.4],[],[],options);
% takes the values of options and solves ga in required population
xopt(z) = inputs(1);
yopt(z) = inputs(2);
end
Time_study3 = toc;
figure(3)
subplot(2,1,1)
hold on
surfc(x,y,-f)
shading interp
plot3(xopt,yopt,-fopt,'marker','o','markersize',5,'markerfacecolor','r')
title('Increased population')
xlabel('x-axis')
ylabel('y-axis')
zlabel('z-axis')
subplot(2,1,2)
plot(-fopt)
xlabel('iterations')
ylabel('Function maximum')
% The Global Maximum at the position
% display(inputs)