Week 4.1 - Genetic Algorithm
GENETIC ALGORITHM
In computer science and operations research, a genetic algorithm (GA) is a metaheuristic inspired by the process of natural selection that belongs to the larger class of evolutionary algorithms (EA). Genetic algorithms are commonly used to generate high-quality solutions to optimization and search problems by relying on biologically inspired operators such as mutation, crossover and selection. Some examples of GA applications include optimizing decision trees for better performance, solving Sudoku puzzles, hyperparameter optimization, etc.
The Genetic Algorithm works on the process of natural selection where the fittest individuals are selected for reproduction in order to produce offspring of the next generation. It is a method for solving both constrained and unconstrained optimization problems that is based on natural selection. The algorithm begins by creating a random initial population of individual selections and it keeps on modifying this population repeatedly creating a sequence of new population. The algorithm uses the individuals in the current generation to create the next population. The genetic algorithm selects individuals at random from the current population to be parents and uses them to produce the children for the next generation. Over successive generations, the population evolves toward an optimal solution.
The genetic algorithm uses three main types of rules at each step to create the next generation from the current population:
- Selection rules select the individuals called parents, that contribute to the population at the next generation. The selection is generally stochastic, and can depend on the individuals' scores.
- Crossover rules combine two parents to form children for the next generation.
- Mutation rules apply random changes to individual parents to form children.
The basic steps in creating a genetic algorithm is as follows,
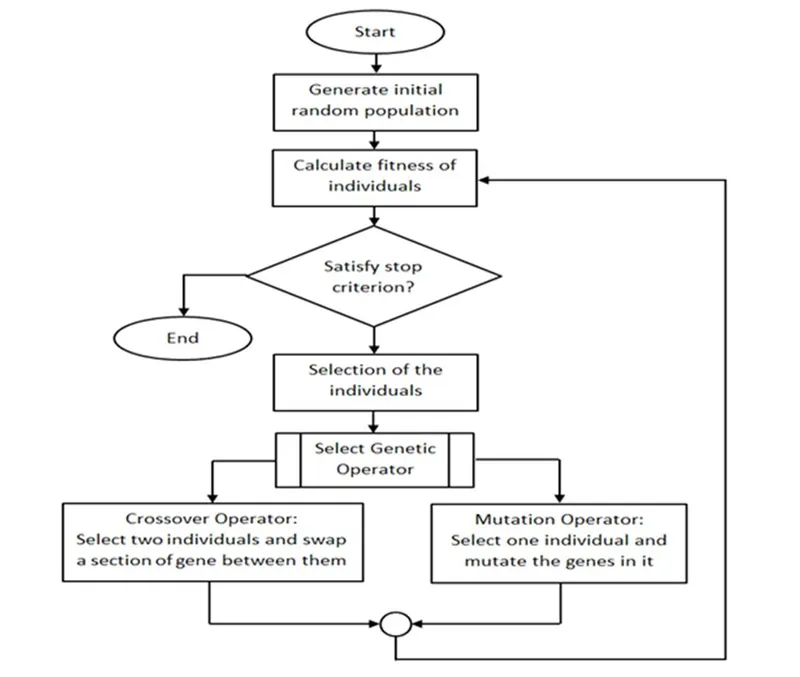
- The algorithm creates a random initial population at beginning.
- Then to create new population, the algorithm scores each member of the current population by computing its fitness value and converts them into a more usable range of values.
- Then based on these new values the algorithm selects members, called as parents.
- Then the algorithm produces children from the parents. Children are produced either by making random changes to a single parent which is mutation or by combining the vector entries of a pair of parents which is crossover.
- In this way the algorithm replaces the current population with the children to form the next generation.
- The algorithm stops when it reaches any one of the specified factors factors such as time limit, fitness limit, generations, function tolerance, constraint tolerance, etc.
Flow chart for Genetic Algorithm is as follows
The genetic algorithm differs from a classical, derivative-based, optimization algorithm in two main ways, as summarized in the following table:
| Classical Algorithm | Genetic Algorithm |
|---|---|
|
Generates a single point at each iteration. The sequence of points approaches an optimal solution. |
Generates a population of points at each iteration. The best point in the population approaches an optimal solution. |
|
Selects the next point in the sequence by a deterministic computation. |
Selects the next population by computation which uses random number generators. |
|
Typically converges quickly to a local solution. |
Typically takes many function evaluations to converge. May or may not converge to a local or global minimum. |
Advantages of Genetic Algorithm:
- Does not require any derivative information (which may not be available for many real-world problems).
- Is faster and more efficient as compared to the traditional methods.
- Has very good parallel capabilities.
- Optimizes both continuous and discrete functions and also multi-objective problems.
- Provides a list of “good” solutions and not just a single solution.
- Always gets an answer to the problem, which gets better over the time.
- Useful when the search space is very large and there are a large number of parameters involved.
Limitations of Genetic Algorithm:
- GAs are not suited for all problems, especially problems which are simple and for which derivative information is available.
- Fitness value is calculated repeatedly which might be computationally expensive for some problems.
- Being stochastic, there are no guarantees on the optimality or the quality of the solution.
- If not implemented properly, the GA may not converge to the optimal solution.
Applications of Genetic Algorithm:
Genetic Algorithms are primarily used in optimization problems of various kinds, but they are frequently used in other application areas as well.
Optimization − Genetic Algorithms are most commonly used in optimization problems wherein we have to maximize or minimize a given objective function value under a given set of constraints. The approach to solve Optimization problems has been highlighted throughout the tutorial.
Neural Networks − GAs are also used to train neural networks, particularly recurrent neural networks.
Multimodal Optimization − GAs are obviously very good approaches for multimodal optimization in which we have to find multiple optimum solutions.
Parametric Design of Aircraft − GAs have been used to design aircrafts by varying the parameters and evolving better solutions.
Vehicle routing problems − With multiple soft time windows, multiple depots and a heterogeneous fleet.
Parallelization − GAs also have very good parallel capabilities, and prove to be very effective means in solving certain problems, and also provide a good area for research.
Image Processing − GAs are used for various digital image processing (DIP) tasks as well like dense pixel matching.
Scheduling applications − GAs are used to solve various scheduling problems as well, particularly the time tabling problem.
Economics − GAs are also used to characterize various economic models like the cobweb model, game theory equilibrium resolution, asset pricing, etc.
Machine Learning − as already discussed, genetics based machine learning (GBML) is a niche area in machine learning.
Robot Trajectory Generation − GAs have been used to plan the path which a robot arm takes by moving from one point to another.
DNA Analysis − GAs have been used to determine the structure of DNA using spectrometric data about the sample.
Traveling salesman problem and its applications − GAs have been used to solve the TSP, which is a well-known combinatorial problem using novel crossover and packing strategies.
Constrained optimization problems:
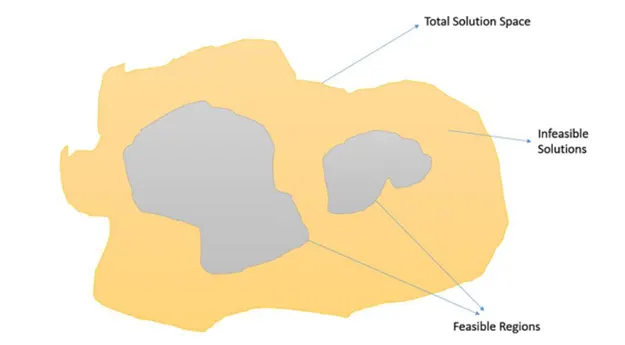
Constrained Optimization Problems are those optimization problems in which we have to maximize or minimize a given objective function value that is subject to certain constraints. Therefore, not all results in the solution space are feasible, and the solution space contains feasible regions as shown in the following image.
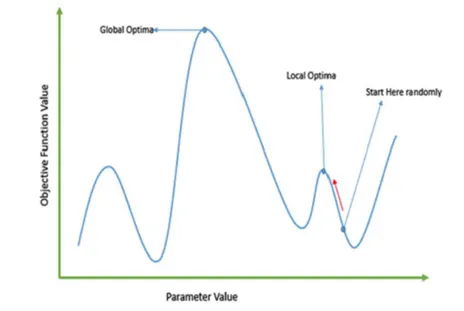
In such a scenario, crossover and mutation operators might give us solutions which are infeasible. Therefore, additional mechanisms have to be employed in the GA when dealing with constrained Optimization Problems.
Some of the most common methods are −
- Using penalty functions which reduces the fitness of infeasible solutions, preferably so that the fitness is reduced in proportion with the number of constraints violated or the distance from the feasible region.
- Using repair functions which take an infeasible solution and modify it so that the violated constraints get satisfied.
- Not allowing infeasible solutions to enter into the population at all.
- Use a special representation or decoder functions that ensures feasibility of the solutions.
Syntax for defining ‘ga’ (Genetic Algorithm) in matlab –
x = ga(fun,nvars)
x = ga(fun,nvars) finds a local unconstrained minimum, x, to the objective function, fun. nvars is the dimension (number of design variables) of fun.
x = ga(fun,nvars,A,b)
x = ga(fun,nvars,A,b) finds a local minimum x to fun, subject to the linear inequalities A*x ≤ b. ga evaluates the matrix product A*x as if x is transposed (A*x').
x = ga(fun,nvars,A,b,Aeq,beq)
x = ga(fun,nvars,A,b,Aeq,beq) finds a local minimum x to fun, subject to the linear equalities Aeq*x = beq and A*x ≤ b. (Set A=[] and b=[] if no linear inequalities exist.) ga evaluates the matrix product Aeq*x as if x is transposed (Aeq*x').
x = ga(fun,nvars,A,b,Aeq,beq,lb,ub)
x = ga(fun,nvars,A,b,Aeq,beq,lb,ub) defines a set of lower and upper bounds on the design variables, x, so that a solution is found in the range lb ≤ x ≤ ub. (Set Aeq=[] and beq=[] if no linear equalities exist.)
x = ga(fun,nvars,A,b,Aeq,beq,lb,ub,nonlcon)
x = ga(fun,nvars,A,b,Aeq,beq,lb,ub,nonlcon) subjects the minimization to the constraints defined in nonlcon. The function nonlcon accepts x and returns vectors C and Ceq, representing the nonlinear inequalities and equalities respectively. ga minimizes the fun such that C(x) ≤ 0 and Ceq(x) = 0. (Set lb=[] and ub=[] if no bounds exist.)
x = ga(fun,nvars,A,b,Aeq,beq,lb,ub,nonlcon,options)
x = ga(fun,nvars,A,b,Aeq,beq,lb,ub,nonlcon,options) minimizes with the default optimization parameters replaced by values in options. (Set nonlcon=[] if no nonlinear constraints exist.) Create options using optimoptions.
x = ga(fun,nvars,A,b,[],[],lb,ub,nonlcon,IntCon)
x = ga(fun,nvars,A,b,[],[],lb,ub,nonlcon,IntCon) or x = ga(fun,nvars,A,b,[],[],lb,ub,nonlcon,IntCon,options) requires that the variables listed in IntCon take integer values.
x = ga(fun,nvars,A,b,[],[],lb,ub,nonlcon,IntCon,options)
x = ga(problem)
x = ga(problem) finds the minimum for problem, a structure described in problem.
[x,fval] = ga(___)
[x,fval] = ga(___), for any previous input arguments, also returns fval, the value of the fitness function at x.
[x,fval,exitflag,output] = ga(___)
[x,fval,exitflag,output] = ga(___) also returns exitflag, an integer identifying the reason the algorithm terminated, and output, a structure that contains output from each generation and other information about the performance of the algorithm.
[x,fval,exitflag,output,population,scores] = ga(___)
[x,fval,exitflag,output,population,scores] = ga(___) also returns a matrix population, whose rows are the final population, and a vector scores, the scores of the final population.
The ‘ga’ syntax in matlab is used to find the minimum of function using genetic algorithm. There are several ways to define the ‘ga’ function depending on the problem being solved. The syntax used for this study is shown below.
- x = ga(fun,nvars)
where,
x = optimal solution/variables;
fun = Objective function;
nvars = Number of variables;
Sometimes ‘[x,fval]’ is used instead of ‘x’ where ‘fval’ gives objective function value at the solution
- x = ga(fun,nvars,A,B,Aeq,Beq,lb,ub)
where,
A, B = Linear inequality constraints
Aeq, Beq = Linear equality constraints
If there are no linear equalities and inequalities, then A, B, Aeq, Beq are set to ‘[ ]’.
- x = ga(fun,nvars,A,B,Aeq,Beq,lb,ub,nonlcon,IntCon,options)
where,
nonlcon = Nonlinear constraints
IntCon = Integer Values
options = Optimization options
If there are no nonlinear constraints and integer values, the nonlcon and IntCon are set to ‘[ ]’.
Stalagmite Function
Stalagmite function is a mathematical model which helps to generate local minima and maxima. It is a three dimensional function and the way the function is designed is that it has a lot of local maxima or minima and one global maxima or minima. The name stalagmite is actually a type of rock formation that arises from the floor of a cave due to the accumulation of material deposited on the floor from ceiling drippings.
In my MATLAB code the stalagmite function is get_stalagmite which is as follows

function [f] = get_stalagmite(input_vector) %get_stalagmite function with input as input_vector which contains the x and y variables
x=input_vector(1);
y=input_vector(2);

f1 = (sin((5.1*pi*x)+0.5))^6;
f2 = (sin((5.1*pi*y)+0.5))^6;
f3 = exp(-4*log(2)*((x-0.0667)^2)/0.64);
f4 = exp(-4*log(2)*((y-0.0667)^2)/0.64);

f = -(f1*f2*f3*f4);
end
A. MATLAB Code for ga_statistics.m (num_cases =50)
clear variables
close all
clc

x = linspace(0,0.6,150); %x array
y = linspace(0,0.6,150); %y array

[xx,yy] = meshgrid(x,y); %Creating a 2D mesh

% Evalauting a stalagmite function. In this program, the stalagmite function
% is get_stalagmite
for i = 1:length(xx)
    for j = 1 :length(yy)
        input_vector(1)=xx(i,j);
        input_vector(2)=yy(i,j);
        f(i,j) = get_stalagmite(input_vector);
    end
end

num_cases = 50 %Number of cases

%Study 1 - Statistical behaviour with unbound inputs

tic %Study time count starts
for i  = 1:num_cases
    [inputs,f_opt(i)] = ga(@get_stalagmite,2); % ga function is used to run the stalagmite data and give the optimal solutions
    x_opt(i) = inputs(1);
    y_opt(i) = inputs(2);
    opt_f(i)=-f_opt(i); %ga gives us minima value. Negative sign is introduced for maxima value
end
study1_time = toc %Study time count ends

figure(1)
subplot(2,1,1)
hold on
surfc(xx,yy,f) %Surface plot generation for stalagmite function
shading interp %To bring visually smooth curve surface without mesh lines
xlabel('X-axis')
ylabel('Y-axis')
%Plotting the optimum values with a red dot marker along the stalagmite 3D curves
plot3(x_opt,y_opt,f_opt,'marker','o','markersize',4,'markerfacecolor','r')
title('Statistical Behaviour with Unbounded Inputs')
subplot(2,1,2)
plot(opt_f) %plot of opt_f for every iterations
xlabel('Number of Iterations')
ylabel('Function Max')

%Study 2 - Statistical behaviour with upper and lower bounds

tic %Study time count starts
for i=1:num_cases
    [inputs,fopt(i)] = ga(@get_stalagmite,2,[],[],[],[],[0;0],[0.6;0.6])
    x_opt(i)=inputs(1);
    y_opt(i)=inputs(2);
    opt_f(i)=-f_opt(i); %ga gives us minima value. Negative sign is introduced for maxima value
end
study2_time = toc %Study time count ends

figure(2)
subplot(2,1,1)
hold on
surfc(xx,yy,f) %Surface plot generation for stalagmite function
shading interp %To bring visually smooth curve surface without mesh lines
xlabel('X-axis')
ylabel('Y-axis')
%Plotting the optimum values with a green dot marker along the stalagmite 3D curves
plot3(x_opt,y_opt,f_opt,'marker','o','markersize',4,'markerfacecolor','g')
title('Statistical Behaviour with Bounded Inputs')
subplot(2,1,2)
plot(opt_f) %plot of opt_f for every iterations
xlabel('Number of Iterations')
ylabel('Function Max')

%Study 3 - Statistical behaviour with increasing GA iteration

options=optimoptions('ga')
options=optimoptions(options,'populationsize',350)

tic %Study time count ends
for i=1:num_cases
    [inputs,f_opt(i)]=ga(@get_stalagmite,2,[],[],[],[],[0;0],[0.6;0.6],[],options);
    x_opt(i)=inputs(1);
    y_opt(i)=inputs(2);
    opt_f(i)=-f_opt(i); %ga gives us minima value. Negative sign is introduced for maxima value
end
study3_time = toc %Study time count ends


figure(3)
subplot(2,1,1)
hold on
surfc(xx,yy,f) %Surface plot generation for stalagmite function
shading interp
xlabel('X-axis')
ylabel('Y-axis')
%Plotting the optimum values with a red dot marker along the stalagmite 3D curves
plot3(x_opt,y_opt,f_opt,'marker','o','markersize',4,'markerfacecolor','r')
title('Statistical behaviour with increasing GA iteration')
subplot(2,1,2)
plot(opt_f) %plot of opt_f for every iterations
xlabel('Number of Iterations')
ylabel('Function Max')- The ‘x’ array and ‘y’ array is defined using ‘linspace’ command to create values at 150 equal intervals.
- A 2D mesh of x and y array is created by using ‘meshgrid’ command.
- To evaluate the stalagmite function, ‘for’ loop is used where ‘i’ is initialized and for every value of ‘i’ another ‘for’ loop is used to initialize ‘j’.
- The input vector values of ‘xx’ and ‘yy’ are defined and the stalagmite function for these input vector is defined. This will form a basic stalagmite function and we can plot it separately if needed.
- The number of iterations or cases that the code should perform is defined. This is given by num_cases = 50.
- After preparing the inputs needed for the function, next step is to obtain the results for 3 cases of the genetic algorithm. In first case or study, the maximum value of function is found out with no restrictions, no bounds and no limits.
- This is done using ‘for’ loop where we use ‘ga’ syntax to give values for inputs and optimum max value. The stalagmite function is called in ‘ga’ syntax and number of variables ‘nvars’ are 2.
- To know the time that is taken to solve the loop for 50 iterations, ‘tic’ and ‘toc’ command is used before and after the loop respectively.
- Then the function created in the loop is plotted by using ‘surfc’ command for ‘xx, yy and function output’. To neglect the gridlines on the surface and obtain a smooth and clean plot, ‘shading interp’ command is used. The ‘subplot(2,1,1)’ is used to plot multiple plots on same figure which also divides figure in grid of 2x1 and axes to be placed at 1.
- The ‘plot3’ command plots the 3D points at ‘x_opt, y_opt and optimum value of function(f_opt)’ with ‘o’ shaped and red colour. The labels and title are then provided. Now in the same figure, the values of optimum function ‘opt_f’ are plotted for 50 iterations.
- The results of the above case will be different for each time we run the program.
- To get same value each time, we need to restrict the program within specific bounds namely upper bound and lower bound. The procedure for coding and plotting this procedure is same as Study 1. The only difference is in the ‘ga’ syntax.
- This time the algorithm is provided lower limits and upper limits as [0;0] and [0.6;0.6] respectively.
- After plotting the results for Study 2 or the bounded case, it is observed that the results are not same every time the program terminates. A solution to this problem is to increase the number of cases or iterations.
- In study 3, the number of iterations are increased to 350. So for this study, the syntax, “options = optimoptions(‘SolverName’,’Name’,‘Value’)” is used which returns with named parameter ‘Populations’ with the altered values ‘350’.
- The syntax for ‘ga’ contains ‘option’ term and the rest of the code is same as for Study 1 and 2.
Results:
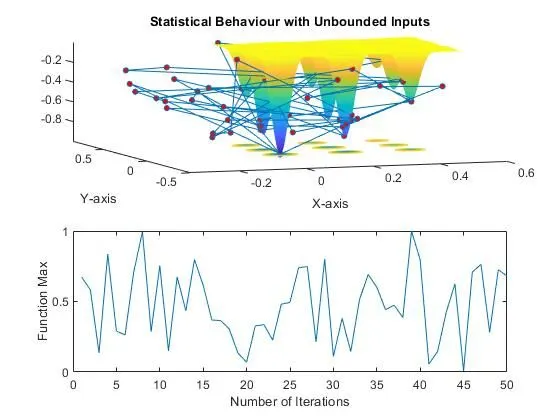
Figure 1A Statistical Behaviour with Unbounded Inputs (num_cases = 50)
In Figure 1A, it can be observed that how the random sampling of the genetic algorithm generates a new optimum value for the function every time the code is run. Although this falls in line with the definition of Genetic Algorithm. Large number of red dots shows values of co-ordinates of x, y varies each time the iteration runs.
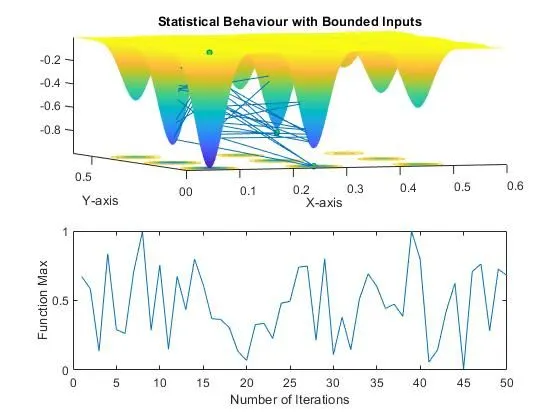
Figure 2A Statistical Behaviour with Bounded Inputs (num_cases = 50)
In Figure 2A, plot shows the convergence of x and y values. The number of green dots are less compared to previous plot(Figure 1A). This is the result of providing upper and lower bounds to the function.
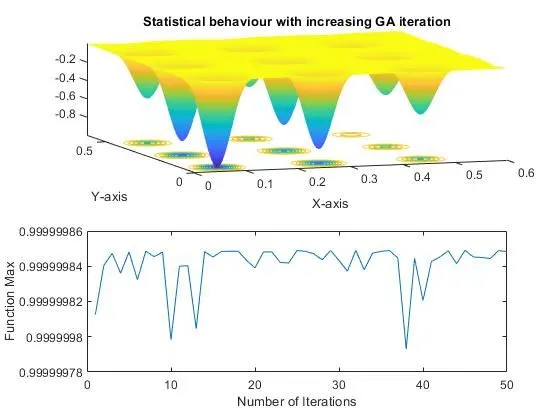
Figure 3A Statistical Behaviour with Increasing GA Iteration (num_cases = 50 , Population size =350)
In figure 3A , the number of iterations is increased to 350 to converge and find the global maxima of the function. Here we can see that there is only one red dot on the stalagmite function and that is the required global maxima point.
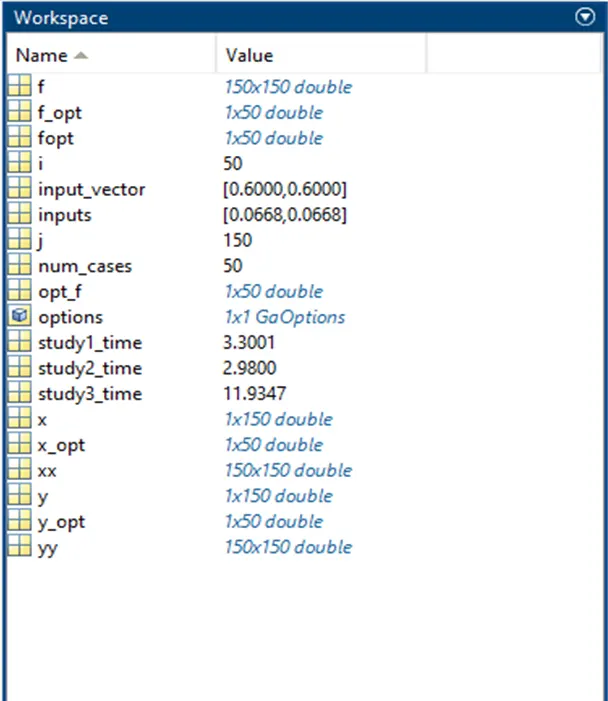
Figure 4A Workspace (num_cases = 50)
Except for many typo errors no error were found.
B. MATLAB Code for ga_statistics.m (num_cases =100)
clear variables
close all
clc

x = linspace(0,0.6,150); %x array
y = linspace(0,0.6,150); %y array

[xx,yy] = meshgrid(x,y); %Creating a 2D mesh

% Evalauting a stalagmite function. In this program, the stalagmite function
% is get_stalagmite
for i = 1:length(xx)
    for j = 1 :length(yy)
        input_vector(1)=xx(i,j);
        input_vector(2)=yy(i,j);
        f(i,j) = get_stalagmite(input_vector);
    end
end

num_cases = 100 %Number of cases

%Study 1 - Statistical behaviour with unbound inputs

tic %Study time count starts
for i  = 1:num_cases
    [inputs,f_opt(i)] = ga(@get_stalagmite,2); % ga function is used to run the stalagmite data and give the optimal solutions
    x_opt(i) = inputs(1);
    y_opt(i) = inputs(2);
    opt_f(i)=-f_opt(i); %ga gives us minima value. Negative sign is introduced for maxima value
end
study1_time = toc %Study time count ends

figure(1)
subplot(2,1,1)
hold on
surfc(xx,yy,f) %Surface plot generation for stalagmite function
shading interp %To bring visually smooth curve surface without mesh lines
xlabel('X-axis')
ylabel('Y-axis')
%Plotting the optimum values with a red dot marker along the stalagmite 3D curves
plot3(x_opt,y_opt,f_opt,'marker','o','markersize',4,'markerfacecolor','r')
title('Statistical Behaviour with Unbounded Inputs')
subplot(2,1,2)
plot(opt_f) %plot of opt_f for every iterations
xlabel('Number of Iterations')
ylabel('Function Max')

%Study 2 - Statistical behaviour with upper and lower bounds

tic %Study time count starts
for i=1:num_cases
    [inputs,fopt(i)] = ga(@get_stalagmite,2,[],[],[],[],[0;0],[0.6;0.6])
    x_opt(i)=inputs(1);
    y_opt(i)=inputs(2);
    opt_f(i)=-f_opt(i); %ga gives us minima value. Negative sign is introduced for maxima value
end
study2_time = toc %Study time count ends

figure(2)
subplot(2,1,1)
hold on
surfc(xx,yy,f) %Surface plot generation for stalagmite function
shading interp %To bring visually smooth curve surface without mesh lines
xlabel('X-axis')
ylabel('Y-axis')
%Plotting the optimum values with a green dot marker along the stalagmite 3D curves
plot3(x_opt,y_opt,f_opt,'marker','o','markersize',4,'markerfacecolor','g')
title('Statistical Behaviour with Bounded Inputs')
subplot(2,1,2)
plot(opt_f) %plot of opt_f for every iterations
xlabel('Number of Iterations')
ylabel('Function Max')

%Study 3 - Statistical behaviour with increasing GA iteration

options=optimoptions('ga')
options=optimoptions(options,'populationsize',500)

tic %Study time count ends
for i=1:num_cases
    [inputs,f_opt(i)]=ga(@get_stalagmite,2,[],[],[],[],[0;0],[0.6;0.6],[],options);
    x_opt(i)=inputs(1);
    y_opt(i)=inputs(2);
    opt_f(i)=-f_opt(i); %ga gives us minima value. Negative sign is introduced for maxima value
end
study3_time = toc %Study time count ends


figure(3)
subplot(2,1,1)
hold on
surfc(xx,yy,f) %Surface plot generation for stalagmite function
shading interp
xlabel('X-axis')
ylabel('Y-axis')
%Plotting the optimum values with a red dot marker along the stalagmite 3D curves
plot3(x_opt,y_opt,f_opt,'marker','o','markersize',4,'markerfacecolor','r')
title('Statistical behaviour with increasing GA iteration')
subplot(2,1,2)
plot(opt_f) %plot of opt_f for every iterations
xlabel('Number of Iterations')
ylabel('Function Max')- The ‘x’ array and ‘y’ array is defined using ‘linspace’ command to create values at 150 equal intervals.
- A 2D mesh of x and y array is created by using ‘meshgrid’ command.
- To evaluate the stalagmite function, ‘for’ loop is used where ‘i’ is initialized and for every value of ‘i’ another ‘for’ loop is used to initialize ‘j’.
- The input vector values of ‘xx’ and ‘yy’ are defined and the stalagmite function for these input vector is defined. This will form a basic stalagmite function and we can plot it separately if needed.
- The number of iterations or cases that the code should perform is defined. This is given by num_cases = 100.
- After preparing the inputs needed for the function, next step is to obtain the results for 3 cases of the genetic algorithm. In first case or study, the maximum value of function is found out with no restrictions, no bounds and no limits.
- This is done using ‘for’ loop where we use ‘ga’ syntax to give values for inputs and optimum max value. The stalagmite function is called in ‘ga’ syntax and number of variables ‘nvars’ are 2.
- To know the time that is taken to solve the loop for 100 iterations, ‘tic’ and ‘toc’ command is used before and after the loop respectively.
- Then the function created in the loop is plotted by using ‘surfc’ command for ‘xx, yy and function output’. To neglect the gridlines on the surface and obtain a smooth and clean plot, ‘shading interp’ command is used. The ‘subplot(2,1,1)’ is used to plot multiple plots on same figure which also divides figure in grid of 2x1 and axes to be placed at 1.
- The ‘plot3’ command plots the 3D points at ‘x_opt, y_opt and optimum value of function(f_opt)’ with ‘o’ shaped and red colour. The labels and title are then provided. Now in the same figure, the values of optimum function ‘opt_f’ are plotted for 50 iterations.
- The results of the above case will be different for each time we run the program.
- To get same value each time, we need to restrict the program within specific bounds namely upper bound and lower bound. The procedure for coding and plotting this procedure is same as Study 1. The only difference is in the ‘ga’ syntax.
- This time the algorithm is provided lower limits and upper limits as [0;0] and [0.6;0.6] respectively.
- After plotting the results for Study 2 or the bounded case, it is observed that the results are not same every time the program terminates. A solution to this problem is to increase the number of cases or iterations.
- In study 3, the number of iterations are increased to 350. So for this study, the syntax, “options = optimoptions(‘SolverName’,’Name’,‘Value’)” is used which returns with named parameter ‘Populations’ with the altered values ‘500’.
- The syntax for ‘ga’ contains ‘option’ term and the rest of the code is same as for Study 1 and 2.
Results:
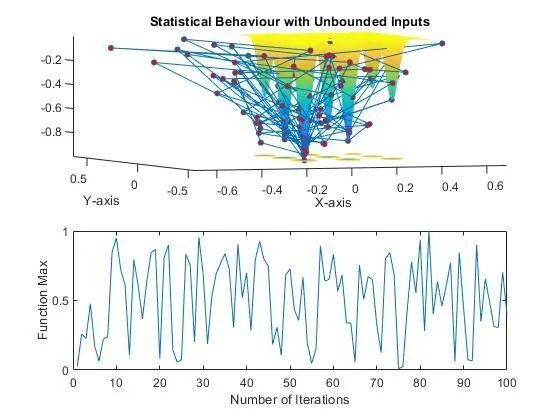
Figure 1B Statistical Behaviour with Unbounded Inputs (num_cases = 100)
In Figure 1B, it can be observed that how the random sampling of the genetic algorithm generates a new optimum value for the function every time the code is run. Although this falls in line with the definition of Genetic Algorithm. Large number of red dots shows values of co-ordinates of x, y varies each time the iteration runs.
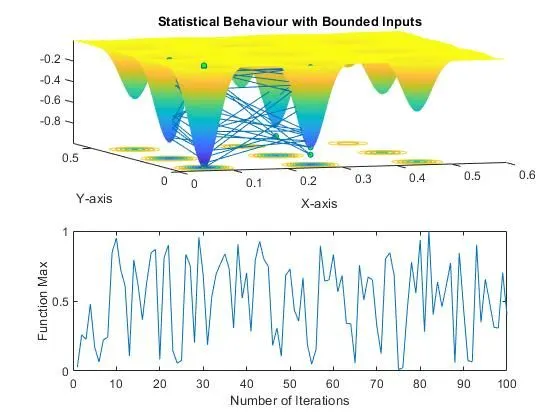
Figure 2B Statistical Behaviour with Bounded Inputs (num_cases = 100)
In Figure 2B, plot shows the convergence of x and y values. The number of green dots are less compared to previous plot(Figure 1B). This is the result of providing upper and lower bounds to the function.
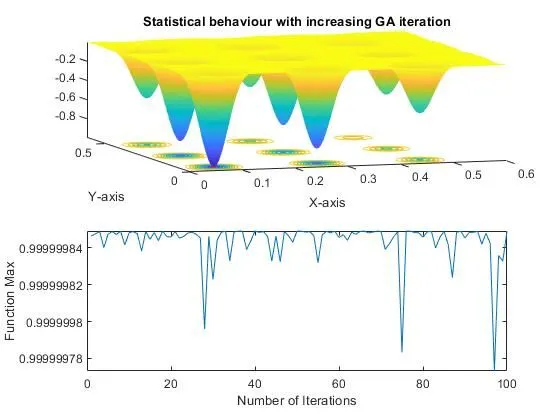
Figure 3B Statistical Behaviour with Increasing GA Iteration (num_cases = 100 , Population size =500)
In figure 3A , the number of iterations is increased to 500 to converge and find the global maxima of the function. Here we can see that there is only one red dot on the stalagmite function and that is the required global maxima point.
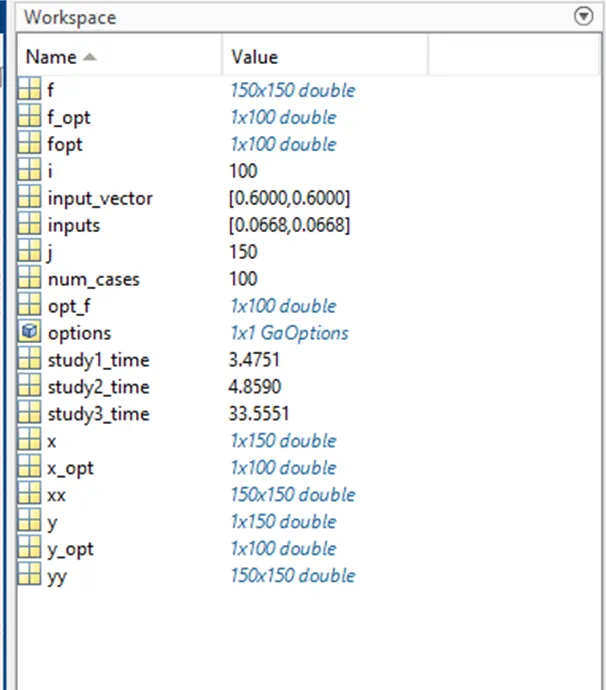
Figure 4B Workspace (num_cases = 100)
References
https://en.wikipedia.org/wiki/Genetic_algorithm
https://in.mathworks.com/help/gads/ga.html
https://in.mathworks.com/discovery/genetic-algorithm.html
https://in.mathworks.com/help/gads/how-the-genetic-algorithm-works.html
https://in.mathworks.com/help/gads/some-genetic-algorithm-terminology.html
https://www.sciencedirect.com/topics/engineering/genetic-algorithm
https://www.tutorialspoint.com/genetic_algorithms/genetic_algorithms_quick_guide.htm