Project 1 - Parsing NASA thermodynamic data
Aim :
To write a program in MATLAB to parse the NASA thermodynamic data file 'THERMO.dat' and then calculate the thermodynamic properties such specific heat, enthlpy and entropy of various gas species.
Objective:
1. Write a function that extracts the 14 co-efficients and calculates the enthalpy, entropy and specific heats for all the species in the data file. You will be reading this file NASA thermodynamic data(Tip: use fopen and fgetl). The formulae are shown below.
Here R is the universal gas constant, T is the temeprature
The FIRST 7 coefficients are HIGH-temperature coefficients and the SECOND 7 coefficients are LOW-temperature coefficients.
Also use the LOCAL TEMPERATURE RANGES which is unique for each individual species, not the GLOBAL TEMPERATURE RANGE.
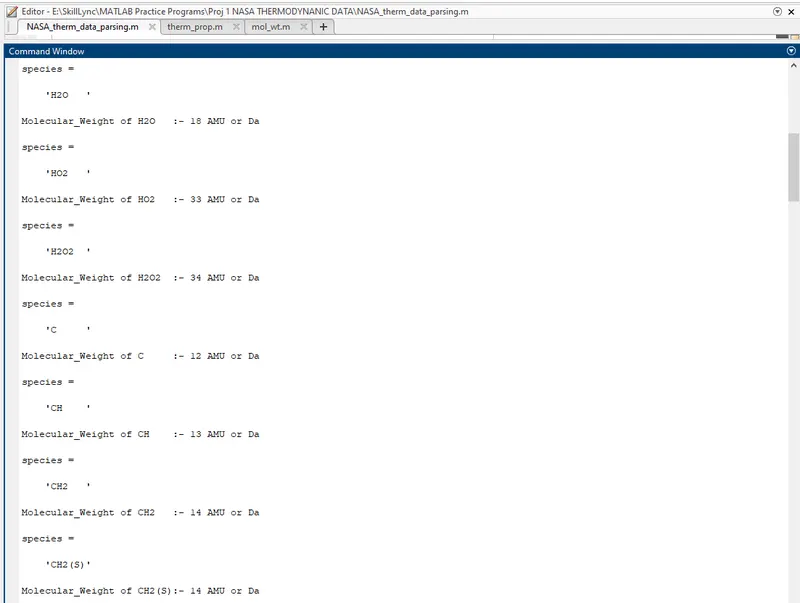
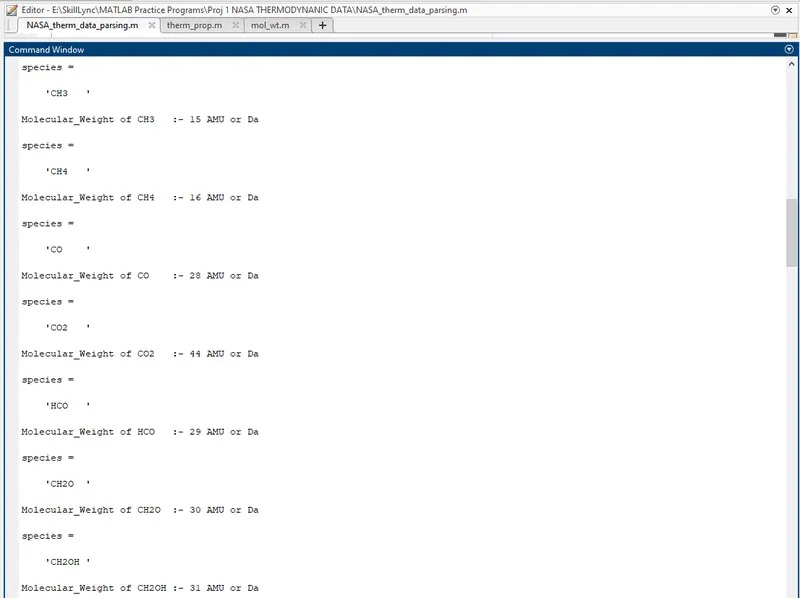
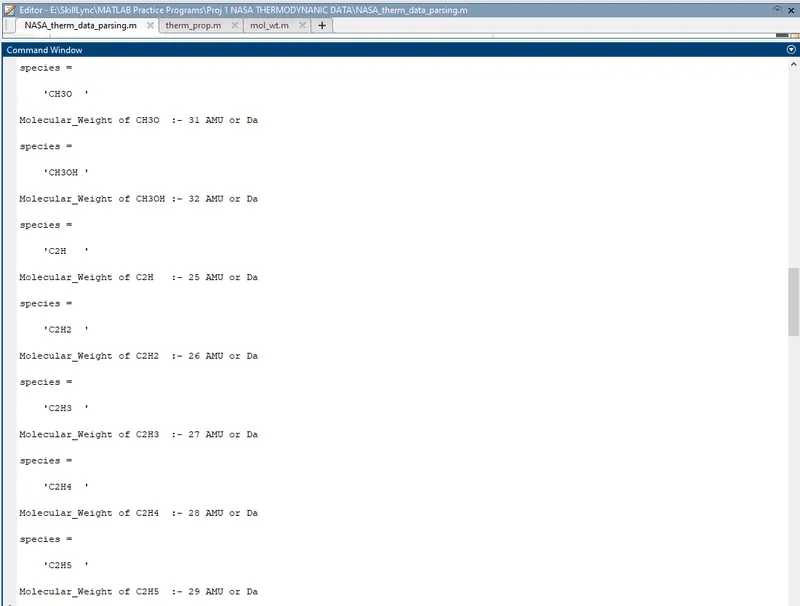
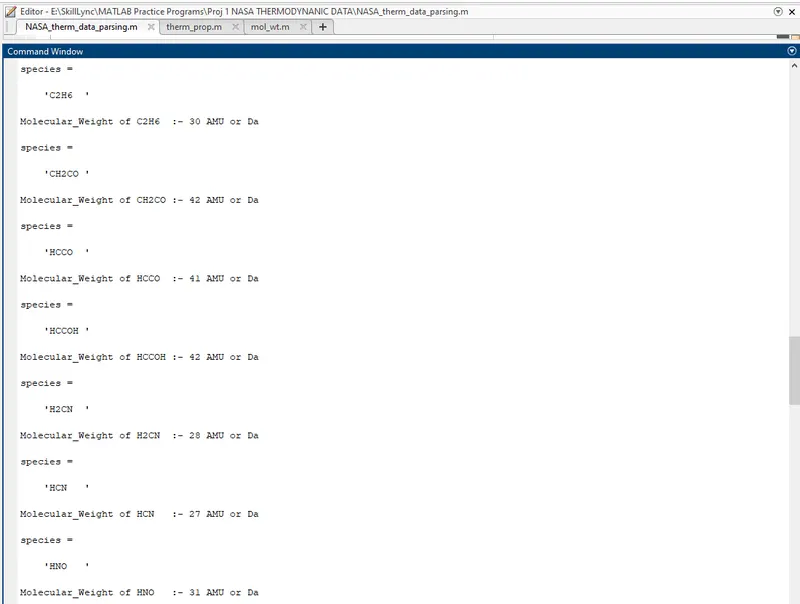
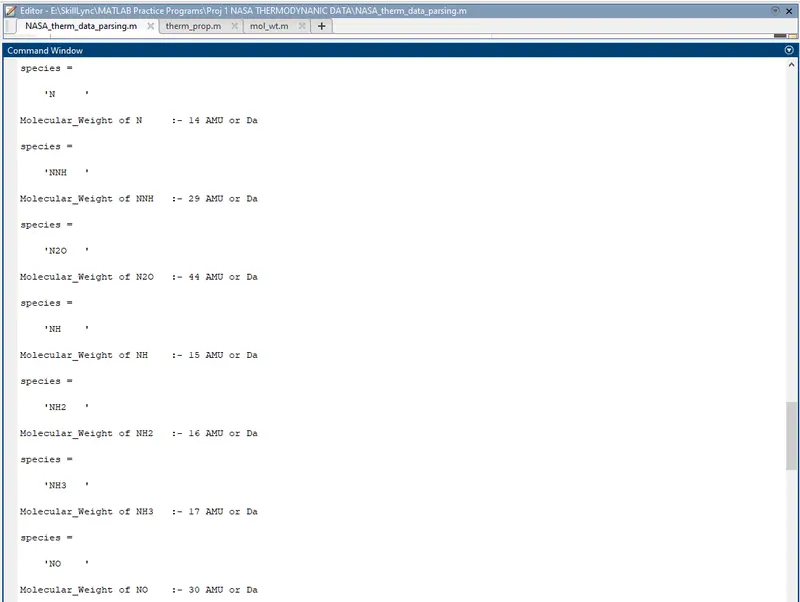
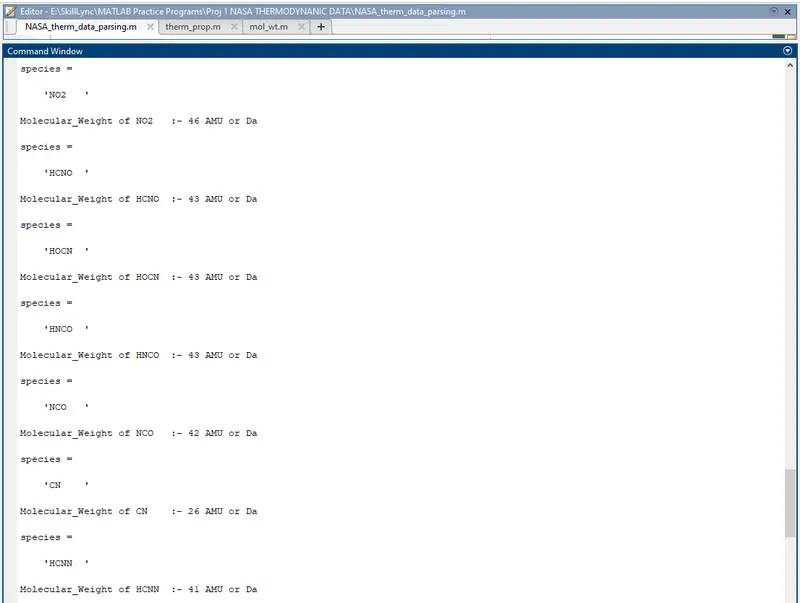
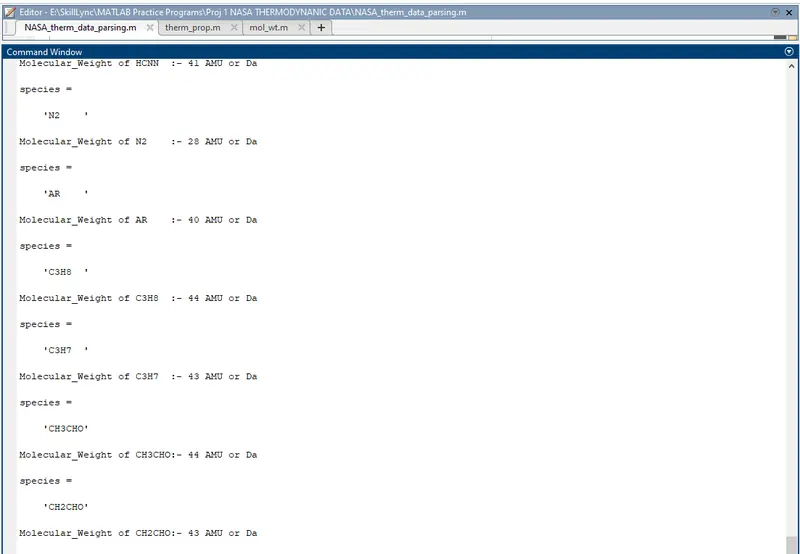
2. Calculate the molecular weight of each species and display it in the command window.
3. Plot the Cp, Enthalpy and Entropy for the local temperature range (low temperature : high temperature) specific for each species.
4. Save the plots as images with appropriate names and dump them in separate folders for each species with suitable name. All these should be generated automatically.
5. The main program that you will submit will just take the "THERMO.dat" file as an input and generate Cp, H and S plots.
6. Please write a detailed report to describe your logic.
Parsing
Parsing, syntax analysis, or syntactic analysis is the process of analyzing a string of symbols, either in natural language, computer languages or data structures, conforming to the rules of a formal grammar.
Data Parsing
Data parsing is converting data from one format to another. Widely used for data structuring, it is generally done to make the existing, often unstructured, unreadable data more comprehensible.
For example, suppose a user views an HTML file that is likely to be challenging to read and comprehend. Data parsing will help convert that into a more readable format, such as plain text, which the viewer can easily understand.
The process is used in various industries ranging from finance to education and sports to retail, to extract relevant information without spending manual hours to get the correct data.
Need For Data Parsing
Similar to natural languages, computers often require translations to communicate effectively. Therefore, to help machines understand a data string that they do not recognize or comprehend in the current format, parsing is used to convert the data to a form that the device can understand and act on. It is similar to providing a translation so an English speaker can understand text in another language.
Data parsing is generally required to change unstructured and illegible data strings to structured and simple sets that a computer can easily understand.
Process of Data Parsing (In Brief)
Data parsing is performed with the help of a parser. A parser acts as an interpreter for the computer and is a tool that is used to break a string of data into smaller pieces. These smaller pieces of data are then separately analyzed and given the desired structure that the user wants.
Logic Used to Parse the Data from 'THERMO.dat'
1) First the data file THERMO.dat is open using fopen command to start reading the data file.
2) After that fgetl command is used to read line from file, removing new line characters
3) The global temperature line is read using fgetl command which is string. Now this string is split to capture the temperature (low, mid & high) which is text form using the strsplit command. Successively the captured text is converted into double precision value using str2double command.
4) The comments in the data file are extracted using fgetl command.
5) Now for loop is used to extract the species and it's coefficient from the data file.
Inside the for loop the following takes place:
- Coefficients are extracted.
- A folder named SPECIES is created using mkdir command to store the plots of individual species.
- A linearly spaced vector T is generated using linspace command.
- therm_prop function is called which passes the coefficients and temperature values and returns the specific heat, enthalpy and entropy values in array form.
- Plot for Temperature vs Specific Heat, Temperature vs Enthalpy, Temperature vs Entropy, Enthalpy vs Entropy are generated using plot command and their respected labels and title are inserted in the plot.
- The directory is changed to save the plots in the respective species name folder. Using saveas command plots are saved in png format.
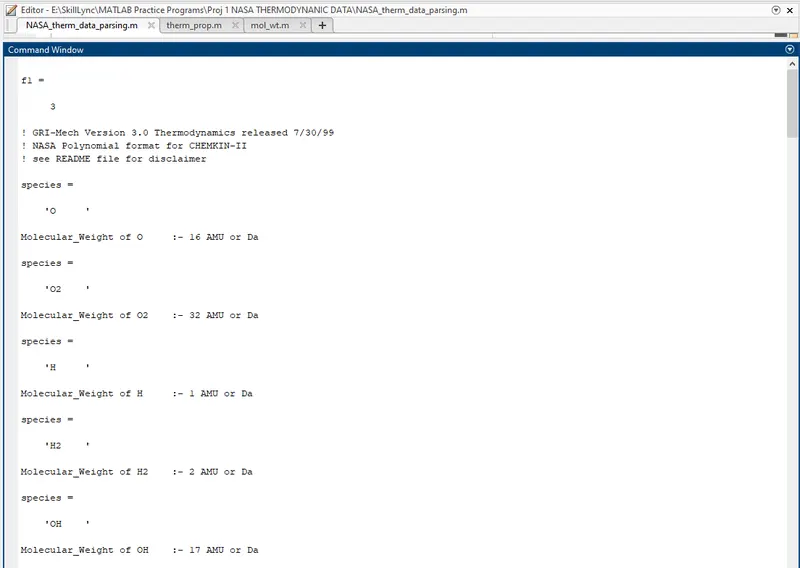
- The directory is changed to run the mol_wt function where molecular weight of the species is calculated and displayedin the command window.
Main Code To Parse The Data from 'THERMO.dat'
clear variables
close all
clc

% Reading the thermodynamic data file
f1 = fopen('THERMO.dat','r') %Opens Thermo.dat data file to start reading the data
file_name = fgetl(f1); %Read line from file (i.e file_name = THERMO), removing newline characters
t_line = fgetl(f1); %Read the global temperature line in the data file
glob_temp = strsplit(t_line,' ');

% Defining the temperatures extracted from data file
global_low_temp = str2double(glob_temp{2});
global_mid_temp = str2double(glob_temp{3});
global_high_temp = str2double(glob_temp{4});

%Extracting the comments in the line 3, 4 & 5 from data file
for i = (1:3)
    comments = fgetl(f1);
    fprintf('%s \n',comments)
end

for i = 1:53

    % Extracting species name
    species = fgetl(f1);
    species_name = species(1:6);

    % Extracting coefficients from second line of the respected species
    line_2 = fgetl(f1);
    l1 = strfind(line_2,'E');
    a1 = str2double(line_2(1:(l1(1)+3)));
    a2 = str2double(line_2((l1(1)+4):(l1(2)+3)));
    a3 = str2double(line_2((l1(2)+4):(l1(3)+3)));
    a4 = str2double(line_2((l1(3)+4):(l1(4)+3)));
    a5 = str2double(line_2((l1(4)+4):(l1(5)+3)));

    % Extracting coefficients from third line
    line_3 = fgetl(f1);
    l2 = strfind(line_3,'E');
    a6 = str2double(line_3(1:(l2(1)+3)));
    a7 = str2double(line_3((l2(1)+4):(l2(2)+3)));
    a8 = str2double(line_3((l2(2)+4):(l2(3)+3)));
    a9 = str2double(line_3((l2(3)+4):(l2(4)+3)));
    a10 = str2double(line_3((l2(4)+4):(l2(5)+3)));

    % Extracting coefficients from fourth line
    line_4 = fgetl(f1);
    l3 = strfind(line_4,'E');
    a11 = str2double(line_4(1:(l3(1)+3)));
    a12 = str2double(line_4((l3(1)+4):(l3(2)+3)));
    a13 = str2double(line_4((l3(2)+4):(l3(3)+3)));
    a14 = str2double(line_4((l3(3)+4):(l3(4)+3)));

    % Creating a folder 'SPECIES' to save thermodynamic plots of species
    mkdir(['E:\SkillLync\MATLAB Practice Programs\Proj 1 NASA THERMODYNANIC DATA\SPECIES\', species_name]);

    T = linspace(global_low_temp, global_high_temp, 500);
% calling the thermodynamic equations function
    [Cp, H, S] = therm_prop(a1,a2,a3,a4,a5,a6,a7,a8,a9,a10,a11,a12,a13,a14,T);

    % Plotting
    % Plot between Temperature and Specific Heat
    figure(1)
    plot(T,Cp,'linewidth',3,'color','c')
    title (species_name)
    xlabel('TEMPERATURE(T) in K')
    ylabel('SPECIFIC HEAT(Cp) in J.kg^-1.K^-1')
    grid on

    % Plot between Temperature and Enthalpy
    figure(2)
    plot(T,H,'linewidth',3,'color','r')
    title(species_name)
    xlabel('TEMPERATURE(T) in K')
    ylabel('ENTHALPY(H) in J')
    grid on

    % Plot between Temperature and Entropy
    figure(3)
    plot(T,S,'linewidth',3,'color','g')
    title(species_name)
    xlabel('TEMPERATURE(T) in K')
    ylabel('ENTROPY(S) in J.K^-1')
    grid on

    % Plot between Enthalpy and Entropy
    figure(4)
    plot(H,S,'linewidth',3,'color','b')
    title(species_name)
    xlabel('ENTHALPY(H) in J')
    ylabel('ENTROPY(S) in J.K^-1')
    grid on

    %Changing directory for saving the plots of the respected species
    directory = (['E:\SkillLync\MATLAB Practice Programs\Proj 1 NASA THERMODYNANIC DATA\SPECIES\',species_name]);
    cd(directory)

    % Saving plots
    saveas(1,'specific_heat.png')
    saveas(2,'enthalpy.png')
    saveas(3,'entropy.png')
    saveas(4,'enthalpy vs entropy.png')

    % Changing directory for calculating molecular weight
    cd('E:\SkillLync\MATLAB Practice Programs\Proj 1 NASA THERMODYNANIC DATA\')
    Molecular_Weight = mol_wt(species_name);

end
fclose(f1)
Function created to calculate the Thermodynamic Properties such as Specific Heat(Cp), Enthalpy(H) & Entropy(S)
% Function to calculate the Thermodynamic Properties
% Specific Heat (Cp) , Enthalpy (H) , Entropy (S)

function[Cp,H,S] = therm_prop(a1,a2,a3,a4,a5,a6,a7,a8,a9,a10,a11,a12,a13,a14,T)

R = 8.314; % Universal Gas Constant [ J.K^-1.mol^-1 / m^3.Pa.K^-1.mol^-1 / kg.m^2.s^-2.K^-1.mol^-1]
for i = 1:length(T)
if T(i)<300

   Cp = (a1 + a2.*T + a3.*T.^2 + a4.*T.^3 + a5.*T.^4).*R;
   H = (a1 + (a2.*T)./2 + (a3.*T.^2)./3 + (a4.*T.^3)./4 + (a5.*T.^4)./5 + (a6./T)).*R.*T;
   S = (a1.*log(T) + a2.*T + (a3.*T.^2)./2 + (a4.*T.^3)./3 + (a5.*T.^4)./4 + a7).*R;

else

    Cp = (a8 + a9.*T + a10.*T.^2 + a11.*T.^3 + a12.*T.^4).*R;
    H = (a8 + (a9.*T)./2 + (a10.*T.^2)./3 + (a11.*T.^3)./4 + (a12.*T.^4)./5 + (a13./T)).*R.*T;
    S = (a8.*log(T) + a9.*T + (a10.*T.^2)./2 + (a11.*T.^3)./3 + (a12.*T.^4)./4 + a14).*R;

end
end
end
Function Created to calculate the Molecular weight of species encountered in data file 'THERMO.dat'
% Function to calculate the Molecular Weight of Species encountered in data
% file THERMO.dat


function[Molecular_Weight] = mol_wt(species_name)

species = upper(species_name)
constituents = {'H','C','N','O','A'};
Atomic_Weight = [1 12 14 16 40];

Molecular_Weight = 0;
for j = 1:length(species)
    for k = 1:length(constituents)
        if strcmp(species(j),constituents(k))
            Molecular_Weight = Molecular_Weight + Atomic_Weight(k);
            m = k;
        end
    end

    n = str2double(species(j));
    if n > 1
        Molecular_Weight = Molecular_Weight + Atomic_Weight(m)*(n-1);
    end
end
fprintf('Molecular_Weight of %s:- ',species_name)
fprintf('%d',Molecular_Weight)
fprintf(' ')
fprintf('AMU or Da')
fprintf('\n')
end
Below screeshot is before executing / running the main code file 'NASA_therm_data_parsing.m'
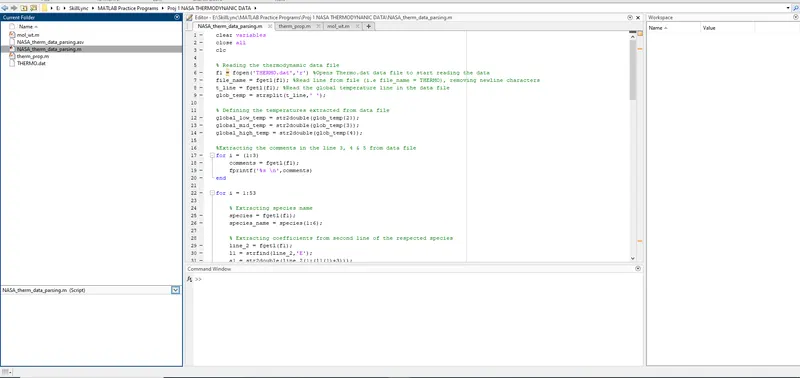
In the below image we can see that the folder named species for saving the various plots is automaticaaly created using the code.
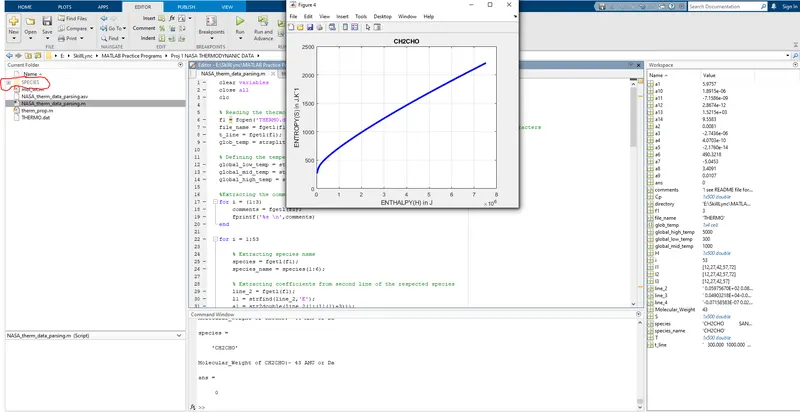
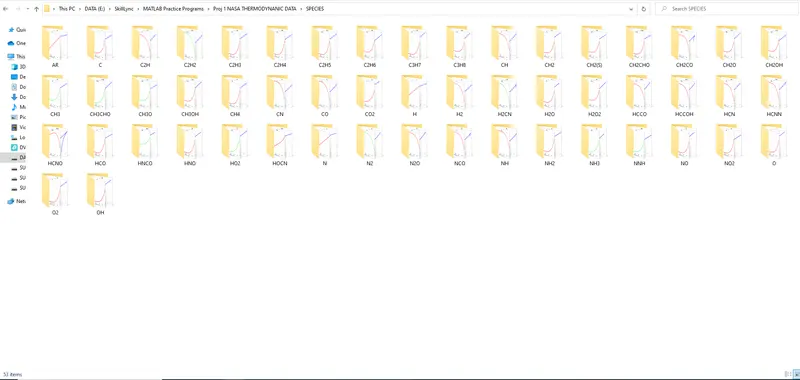
In the below image we can see that diifferent species name folder is also generated and respective plots are saved in it.
Following are the plots for 'O' species
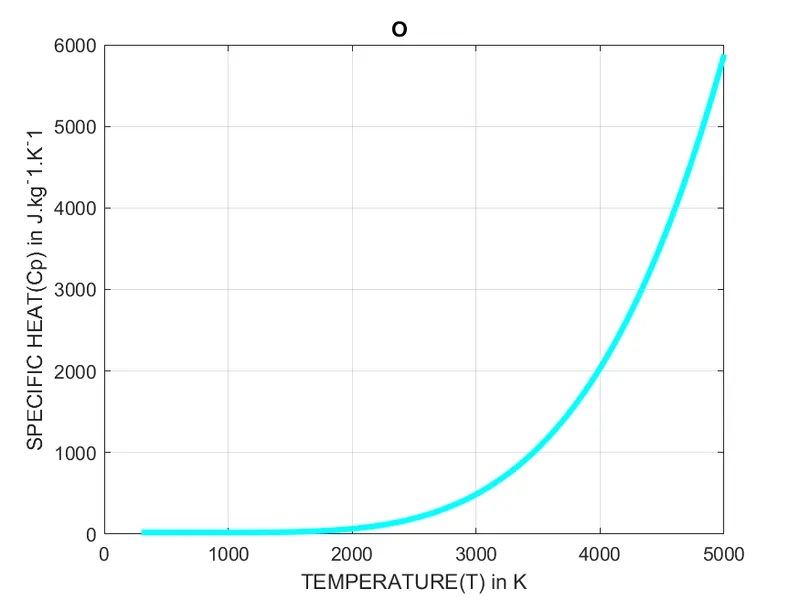
Temperature vs Specific Heat Plot
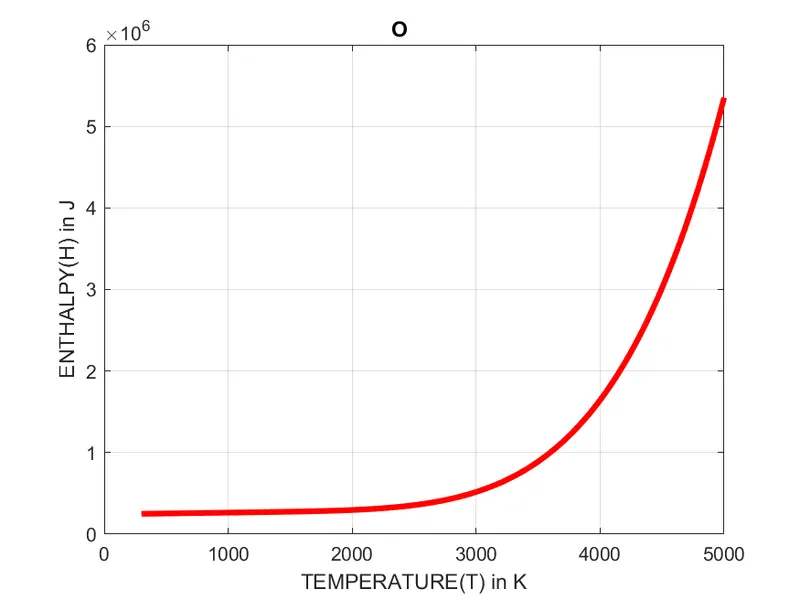
Temperature vs Enthalpy Plot
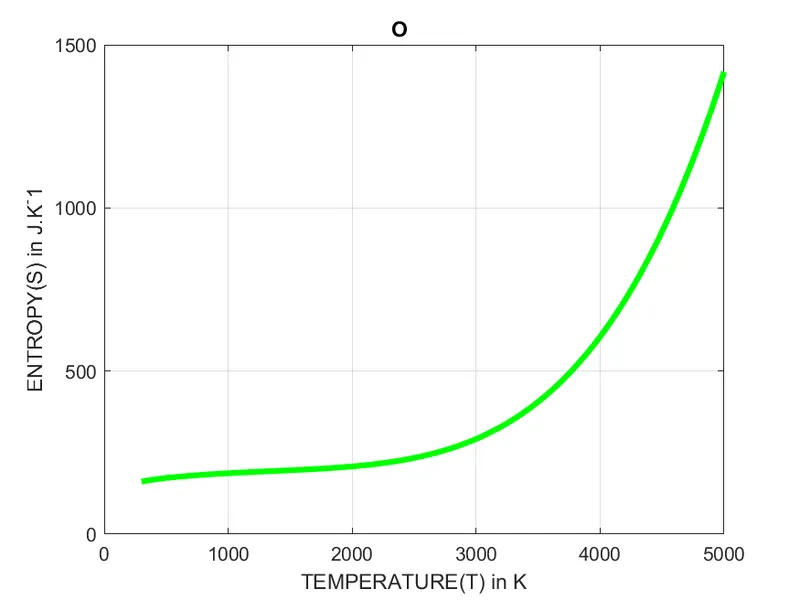
Temeprature vs Entropy Plot
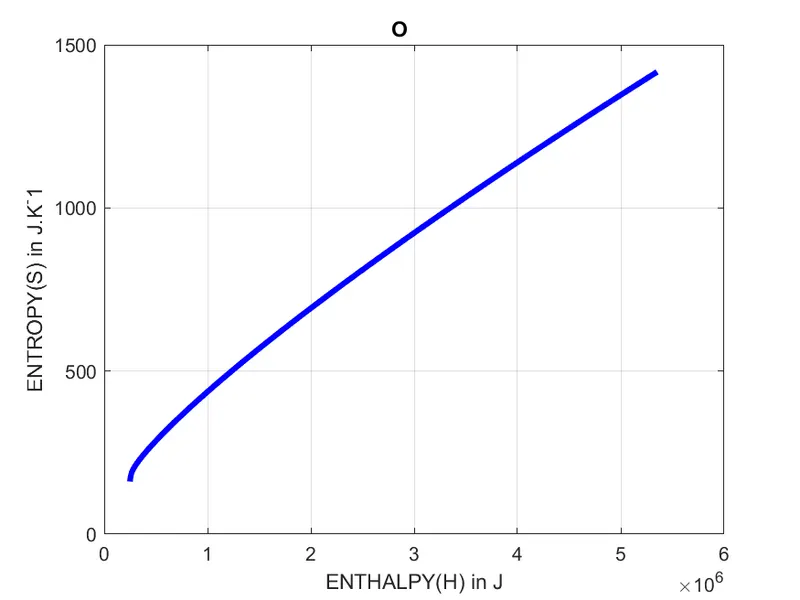
Enthalpy vs Entropy Plot
Following are the plots for 'O2' species
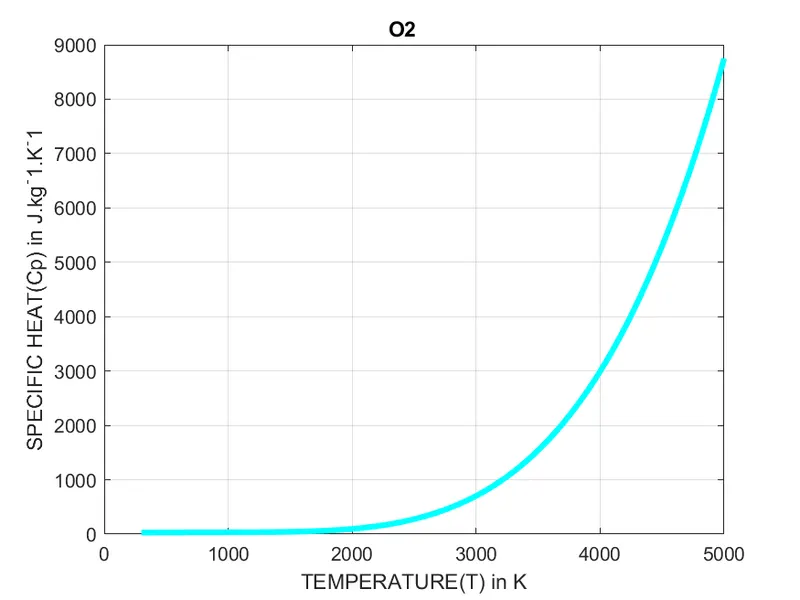
Temperature vs Specific Heat Plot
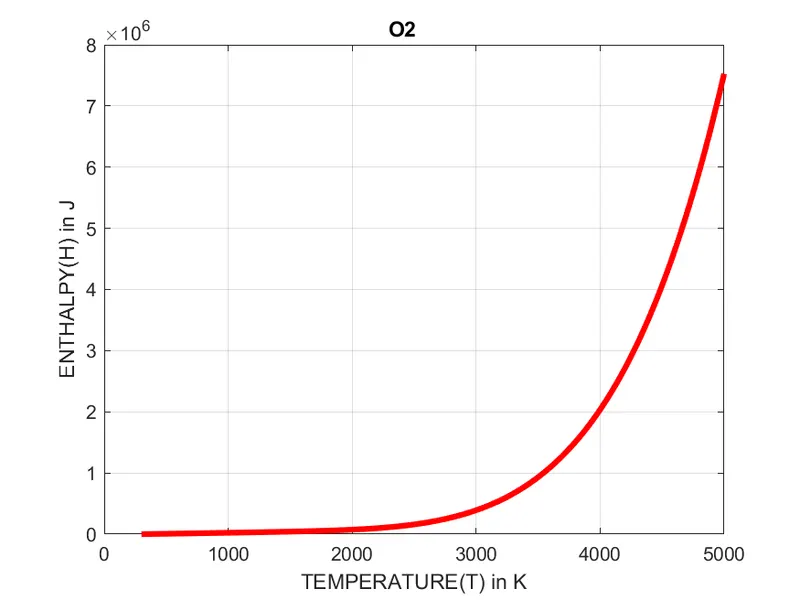
Temperature vs Enthalpy Plot
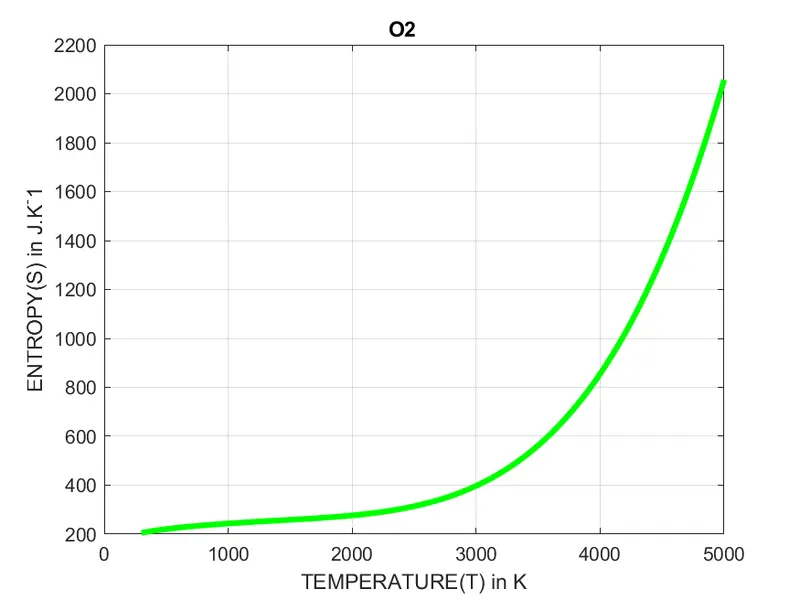
Temeprature vs Entropy Plot
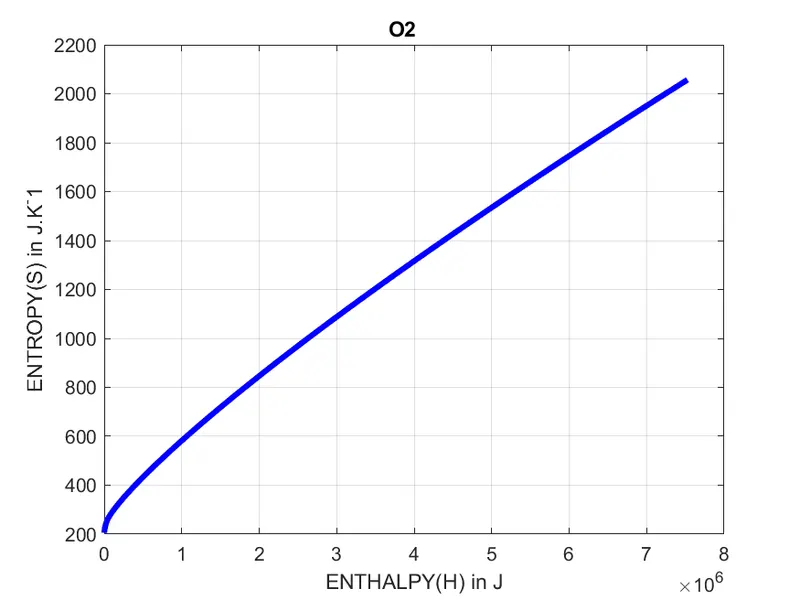
Enthalpy vs Entropy Plot
Following are the plots for 'H' species
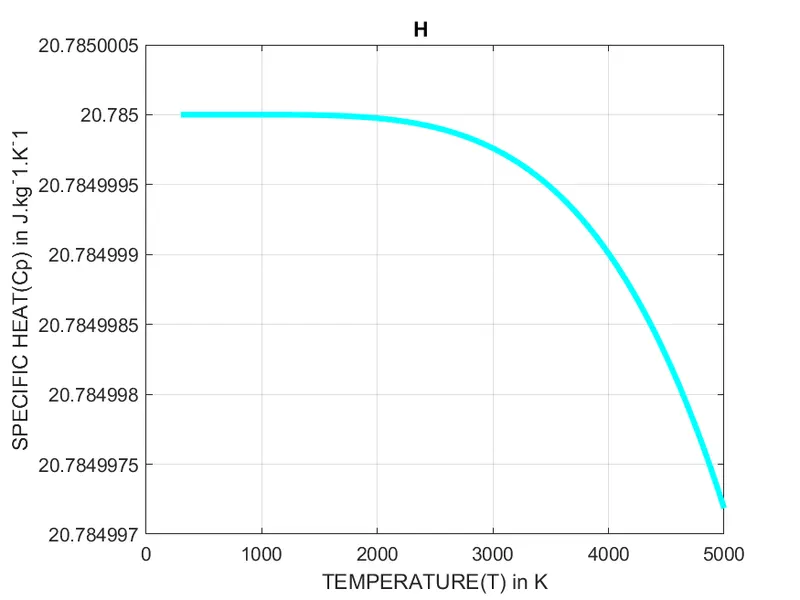
Temperature vs Specific Heat Plot
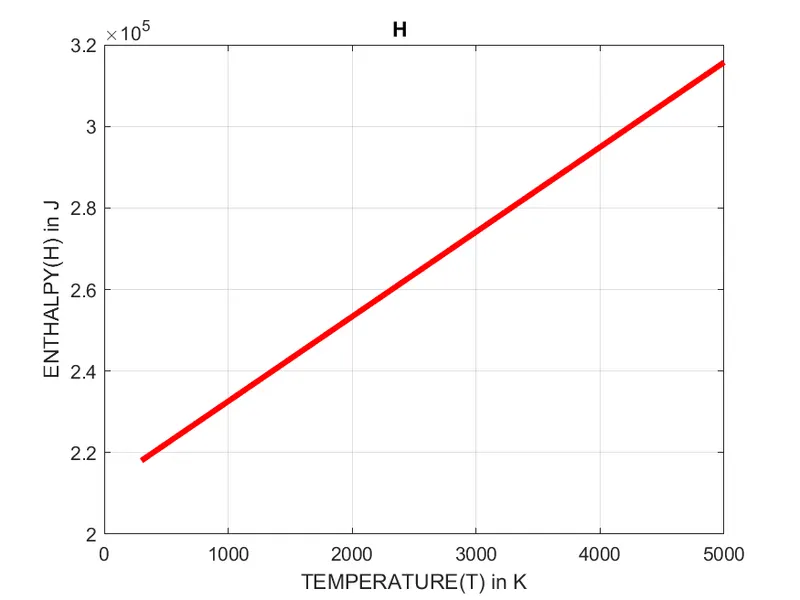
Temperature vs Enthalpy Plot
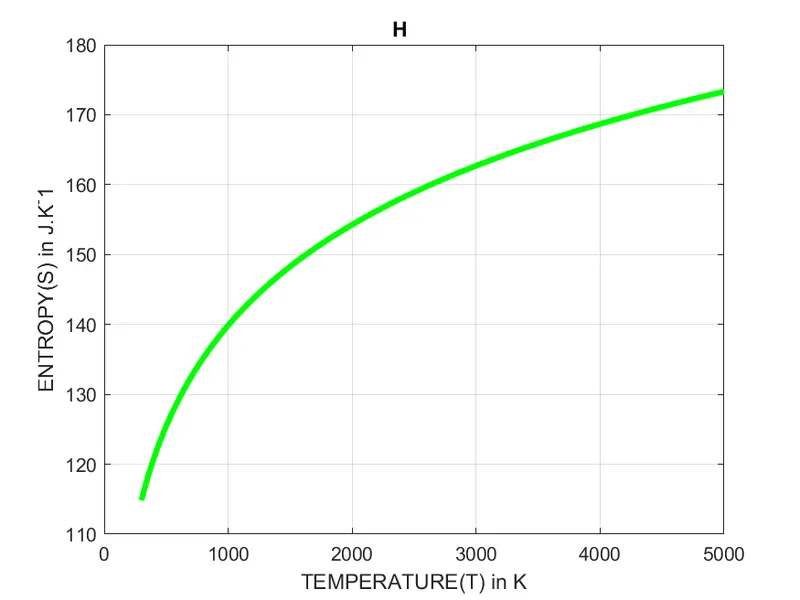
Temeprature vs Entropy Plot
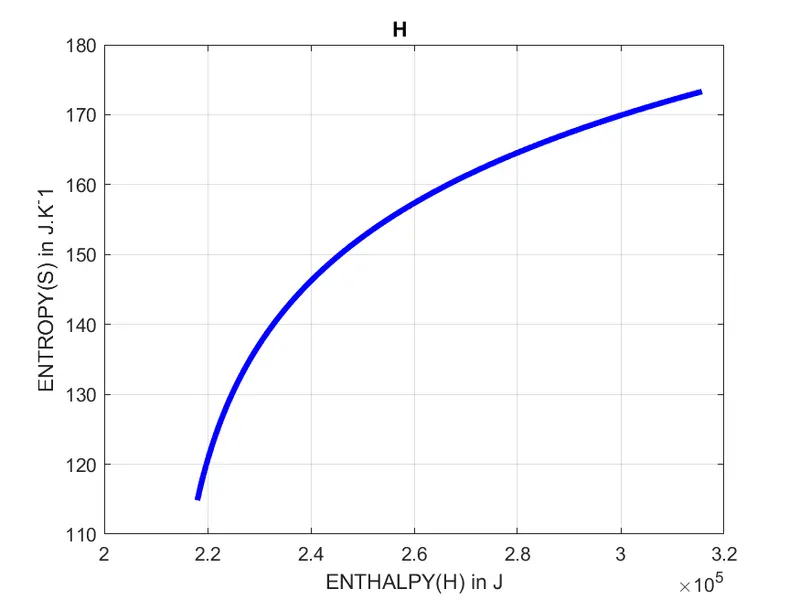
Enthalpy vs Entropy Plot
Following are the plots for 'H2' species
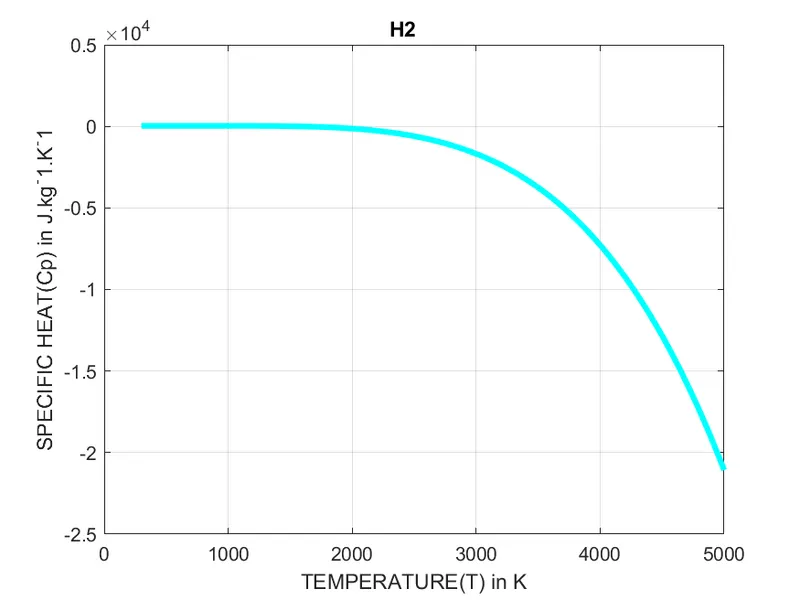
Temperature vs Specific Heat Plot
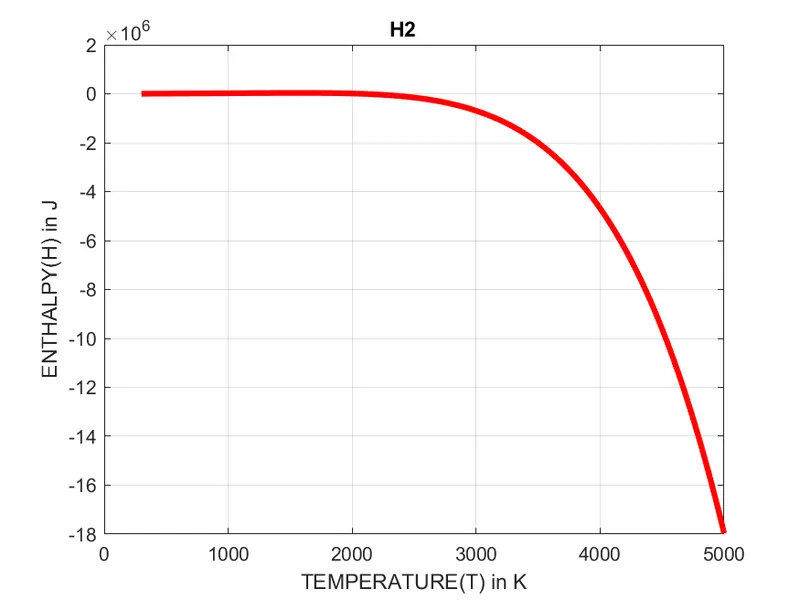
Temperature vs Enthalpy Plot
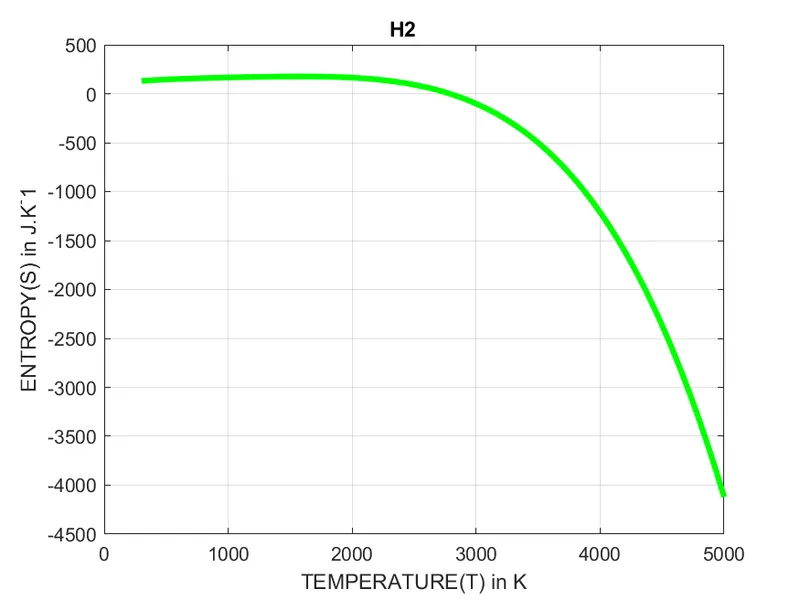
Temeprature vs Entropy Plot
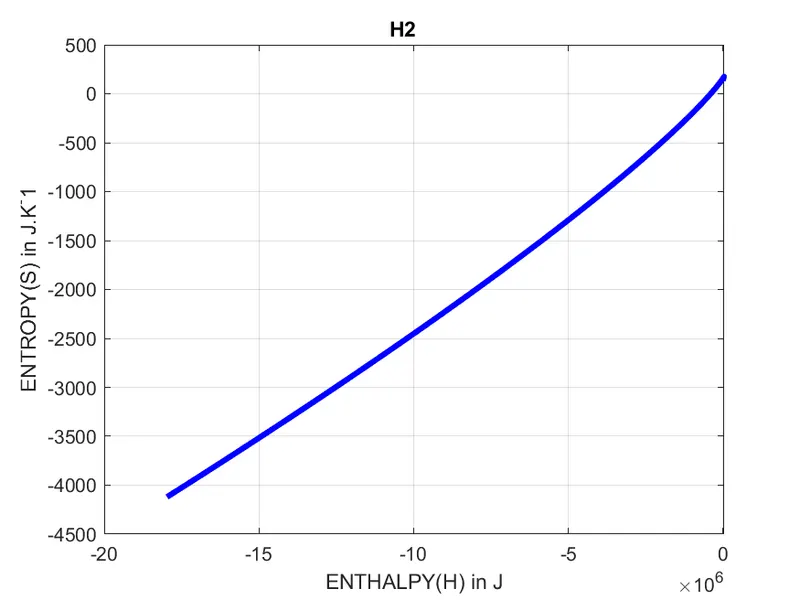
Enthalpy vs Entropy Plot
Following are the plots for 'OH' species
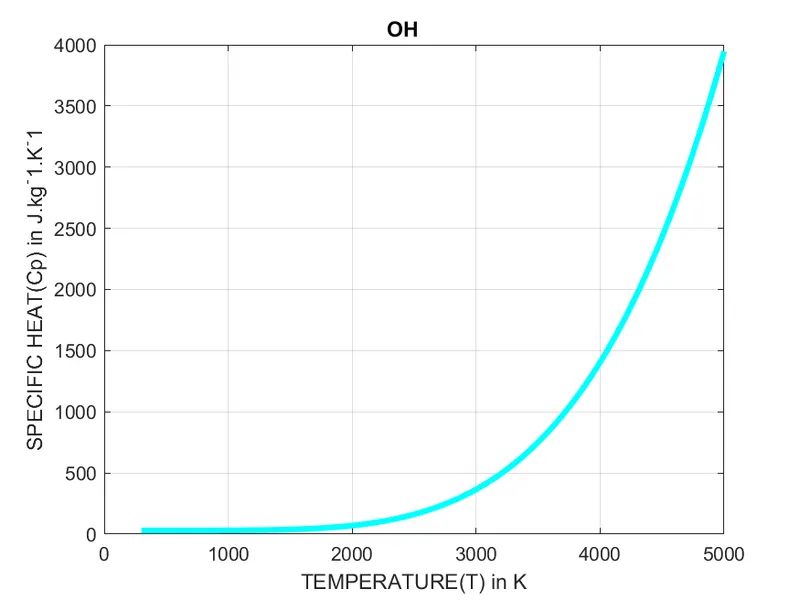 Temperature vs Specific Heat Plot
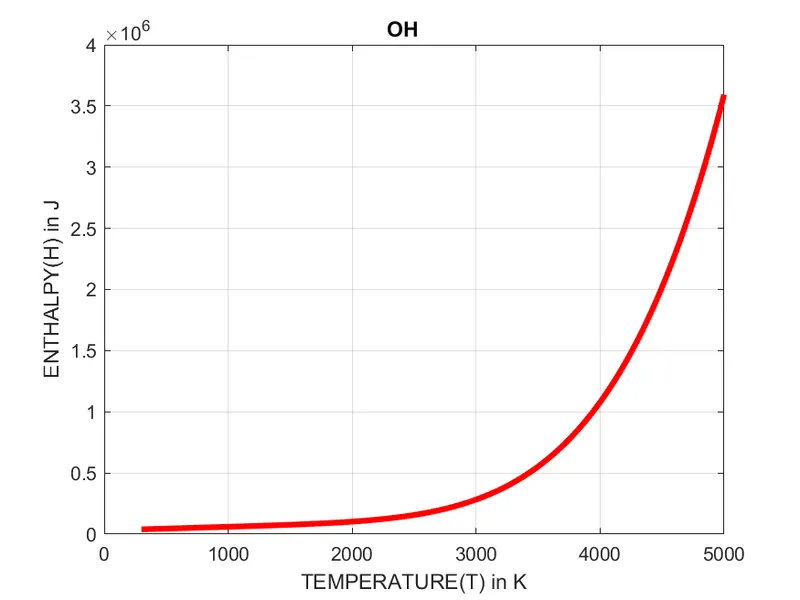
Temperature vs Enthalpy Plot
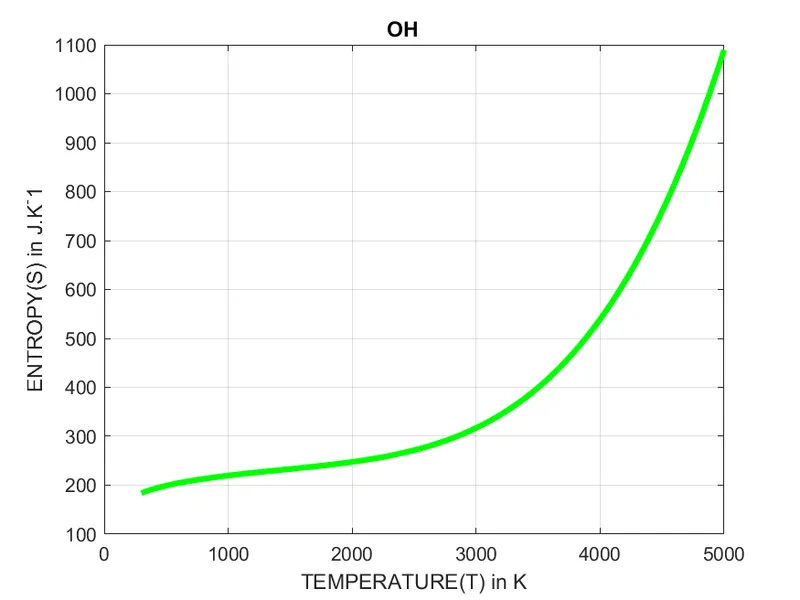
Temeprature vs Entropy Plot
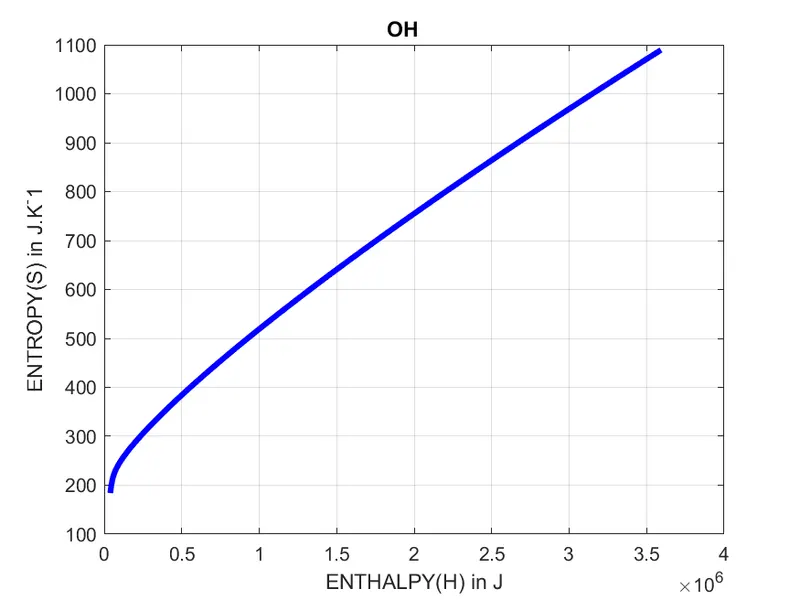
Enthalpy vs Entropy Plot
Following are the plots for 'H2O' species
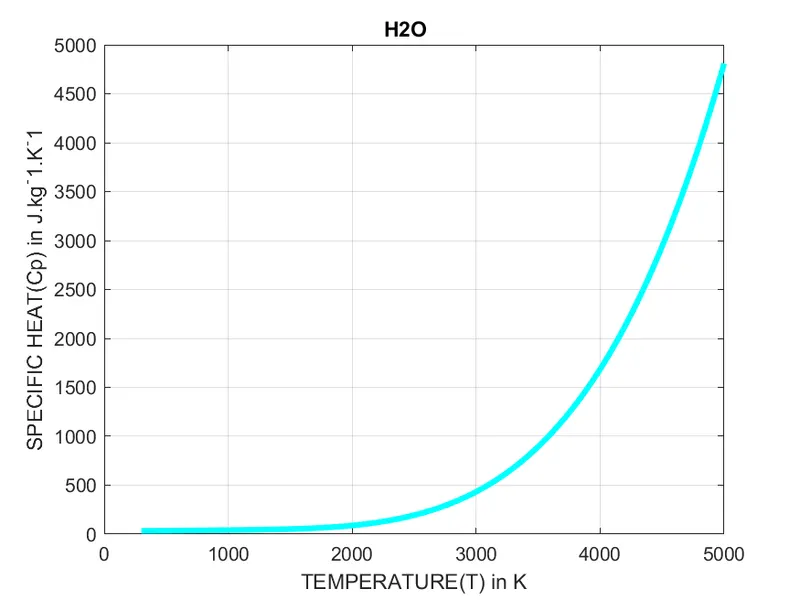
Temperature vs Specific Heat Plot
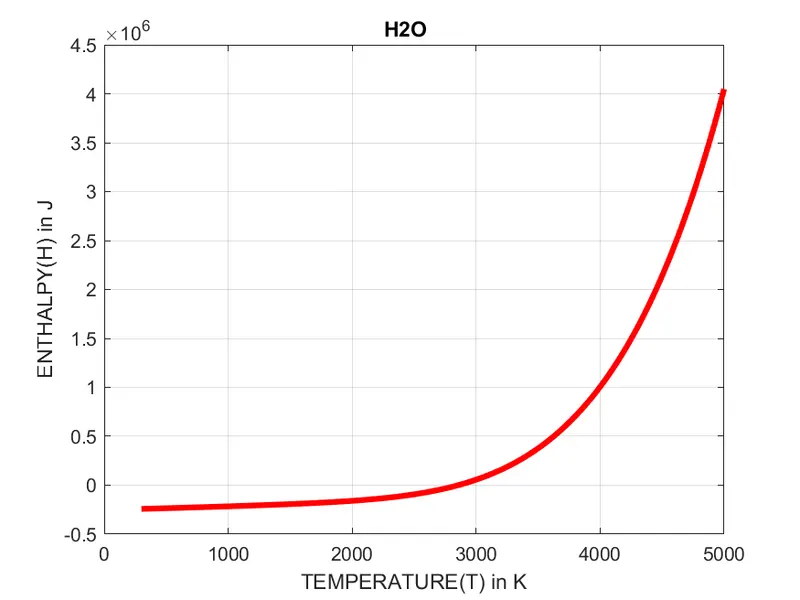
Temperature vs Enthalpy Plot
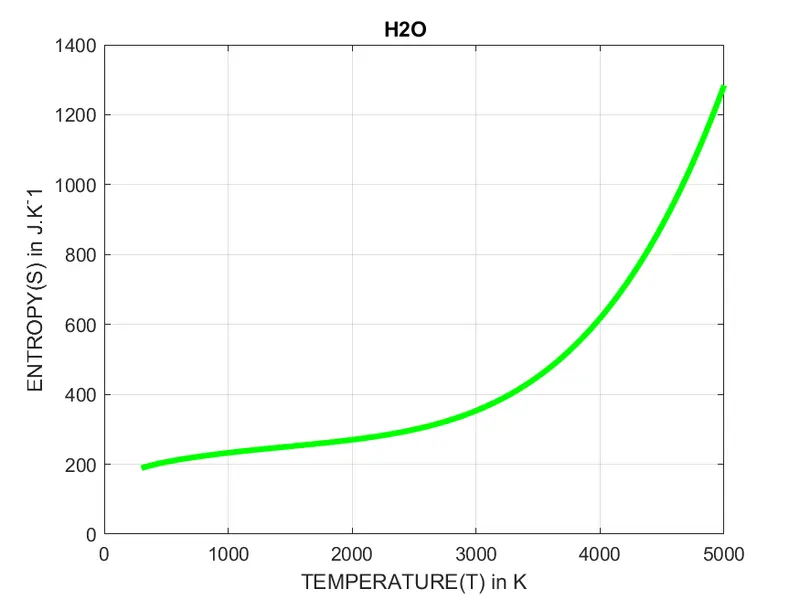
Temeprature vs Entropy Plot
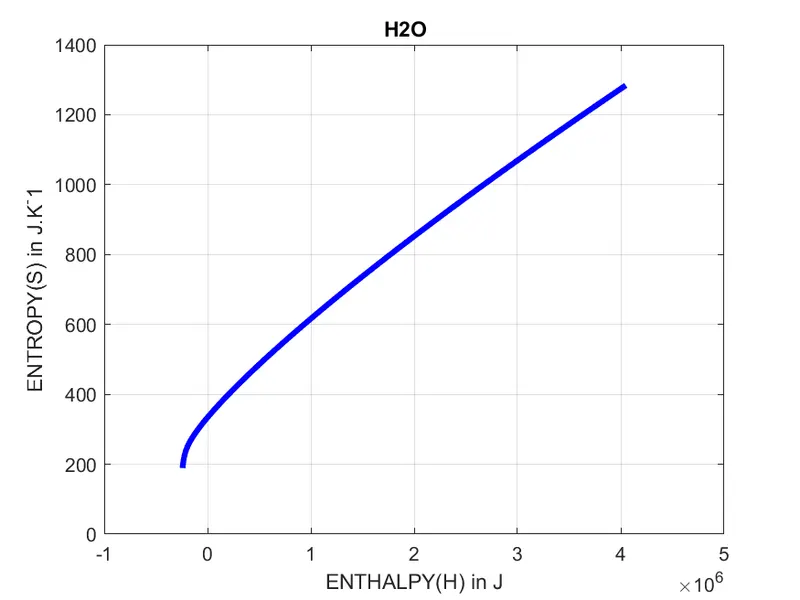
Enthalpy vs Entropy Plot
Following are the plots for 'HO2' species
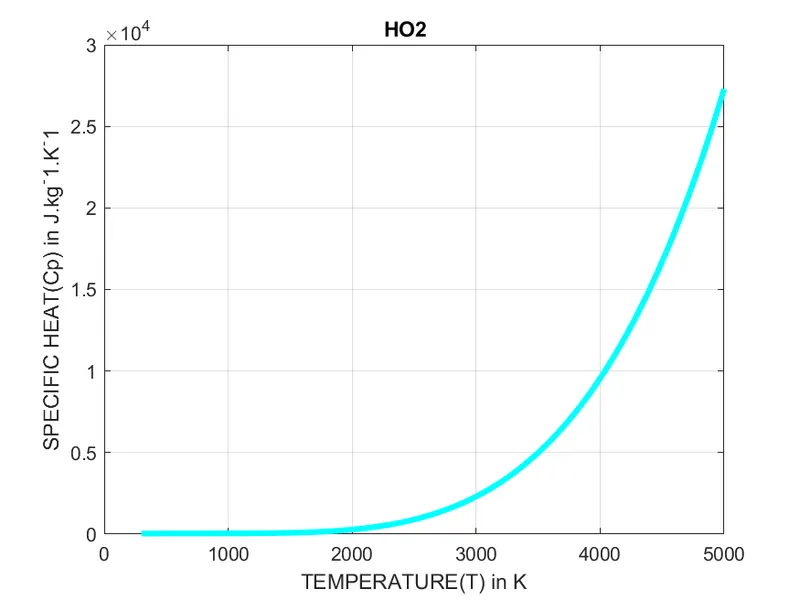
Temperature vs Specific Heat Plot
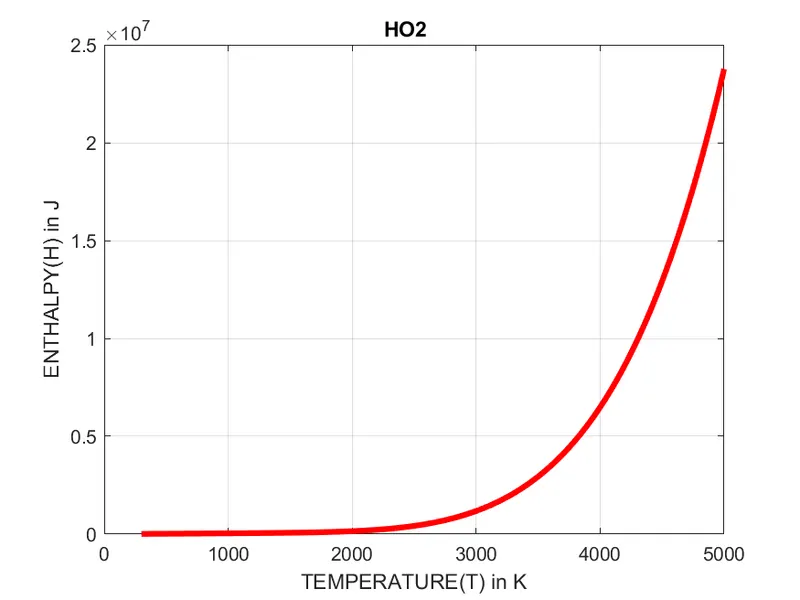
Temperature vs Enthalpy Plot
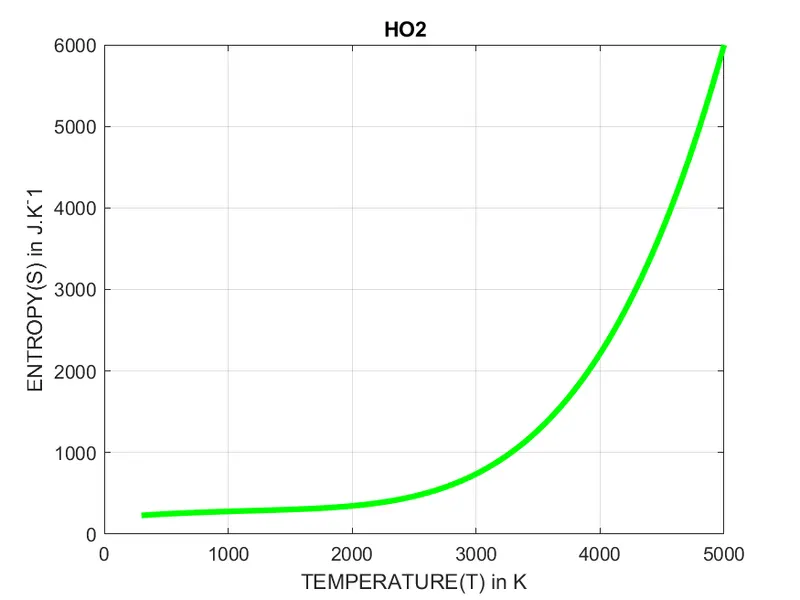
Temeprature vs Entropy Plot
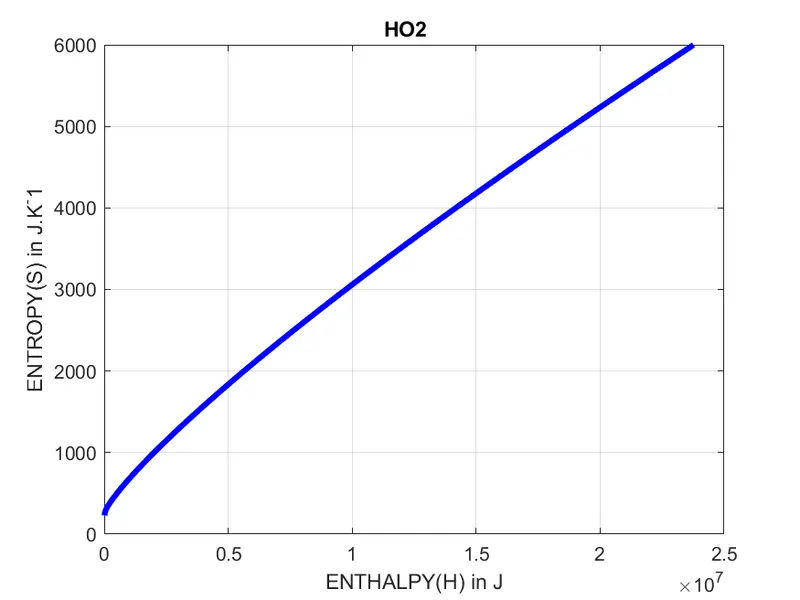
Enthalpy vs Entropy Plot
Following are the plots for 'H2O2' species
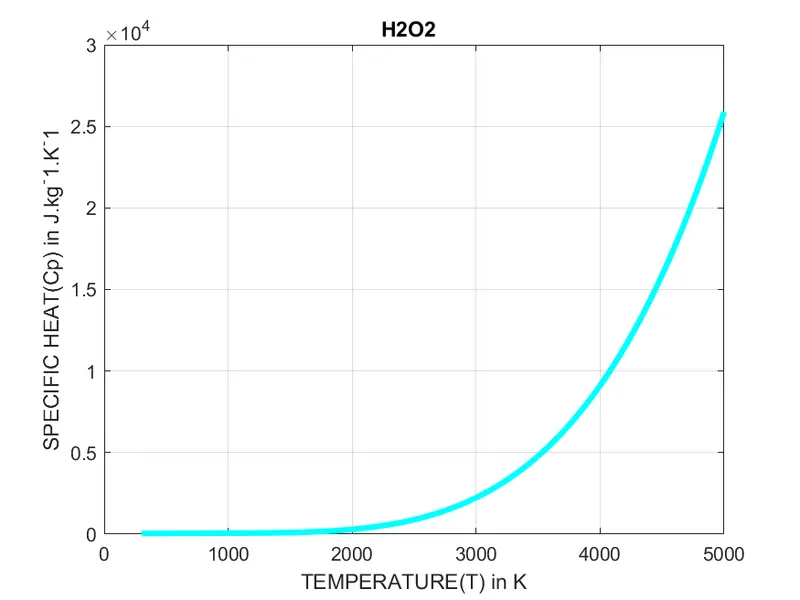
Temperature vs Specific Heat Plot
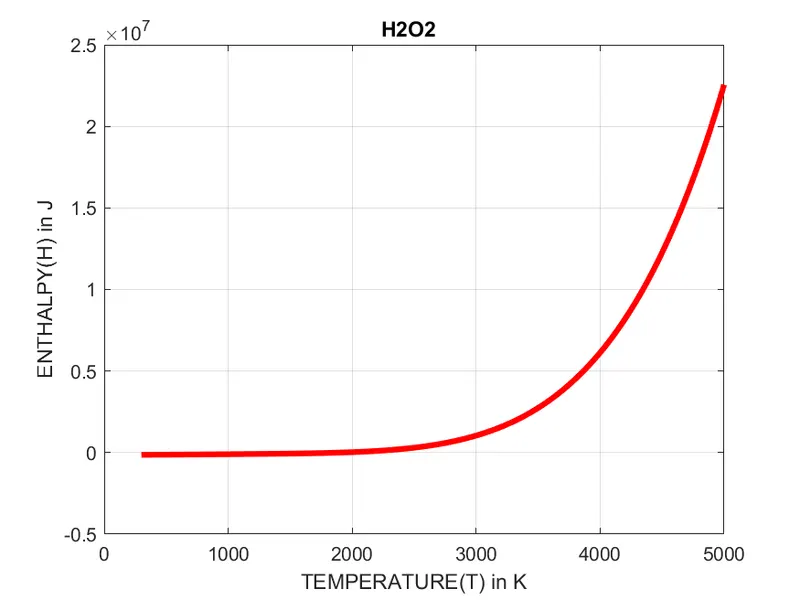
Temperature vs Enthalpy Plot
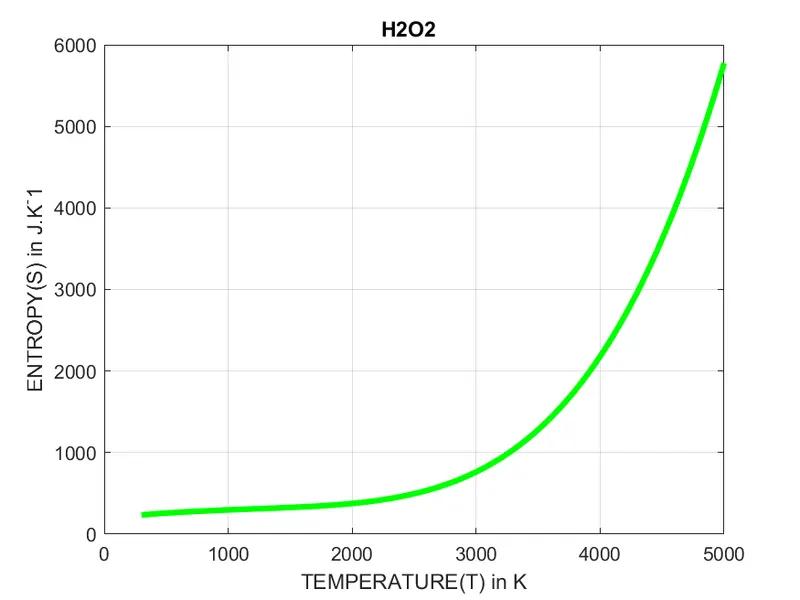
Temeprature vs Entropy Plot
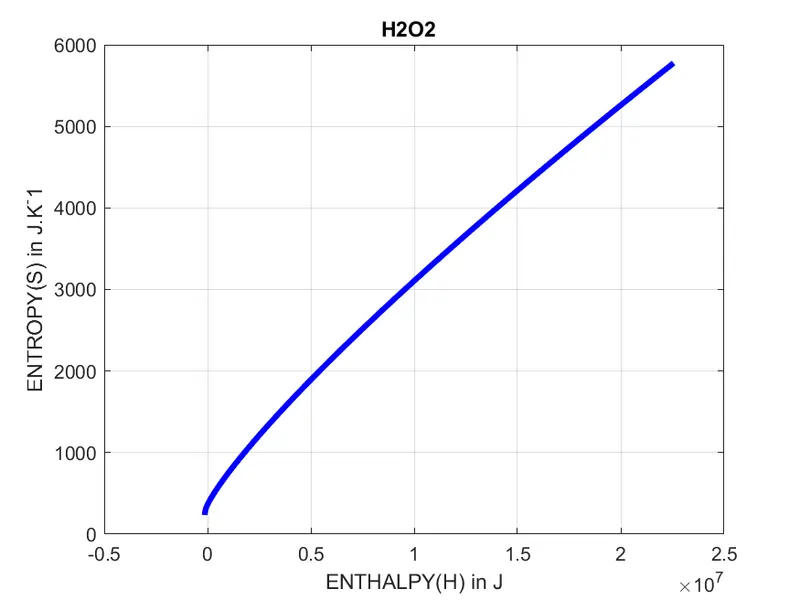
Enthalpy vs Entropy Plot
Following are the plots for 'C' species
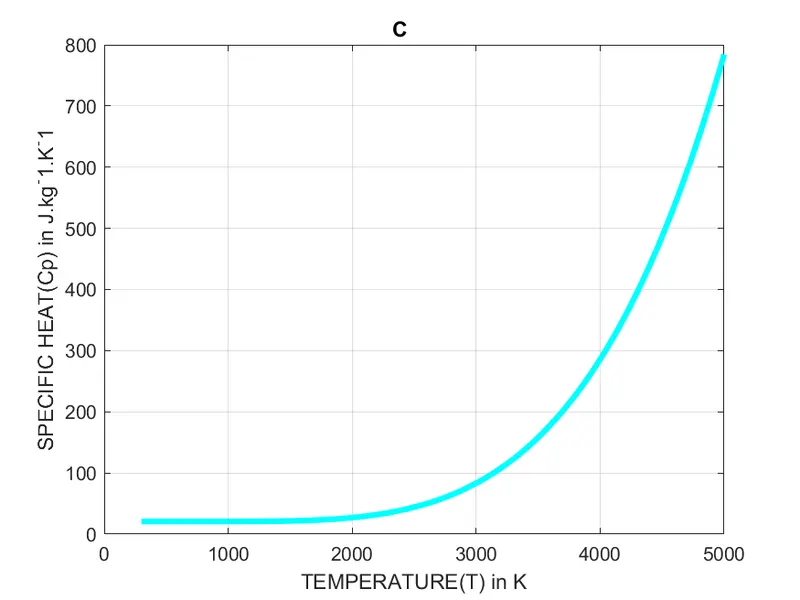
Temperature vs Specific Heat Plot
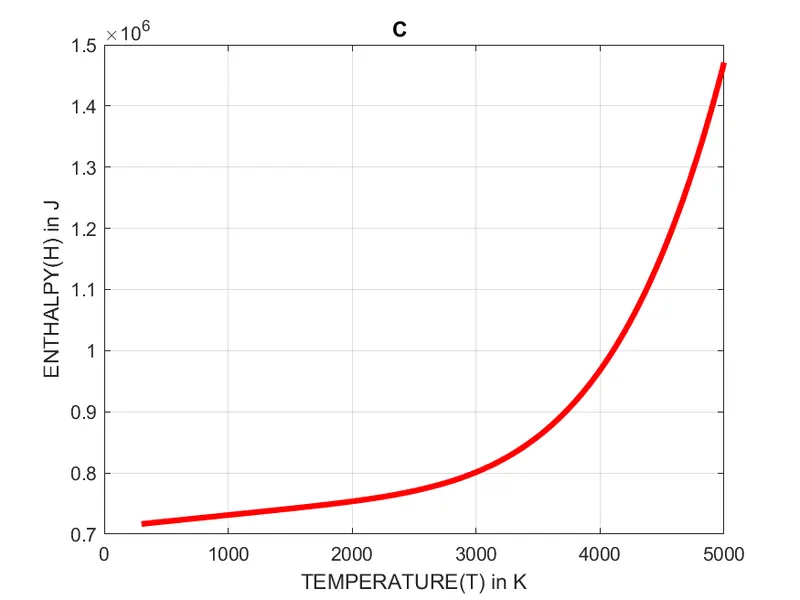
Temperature vs Enthalpy Plot
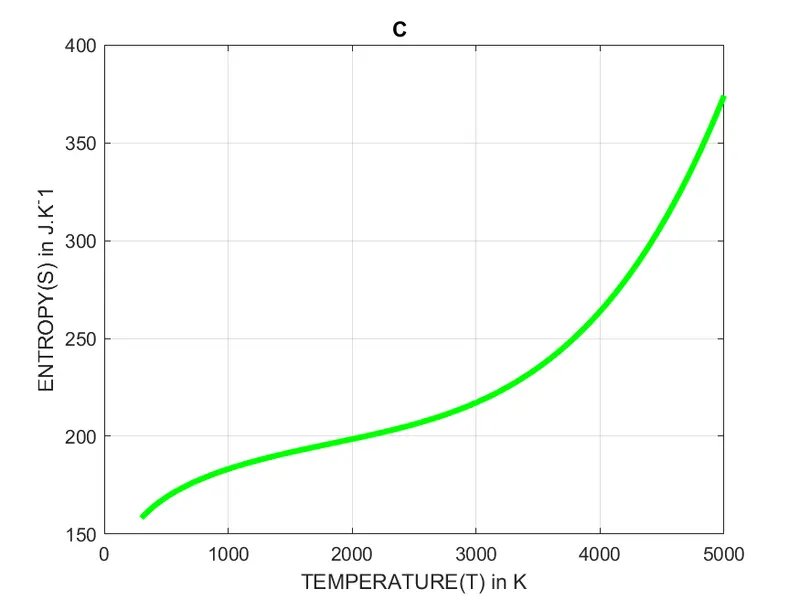
Temeprature vs Entropy Plot
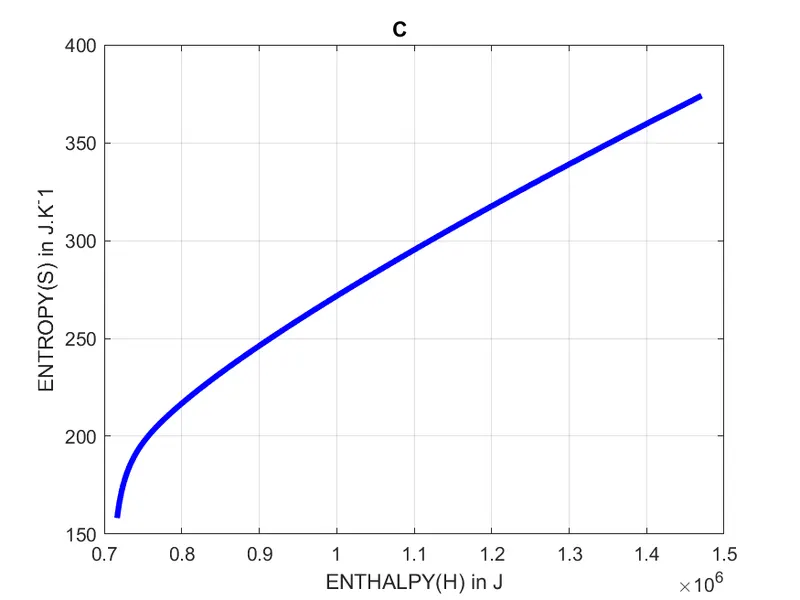
Enthalpy vs Entropy Plot
Following are the plots for 'CH' species
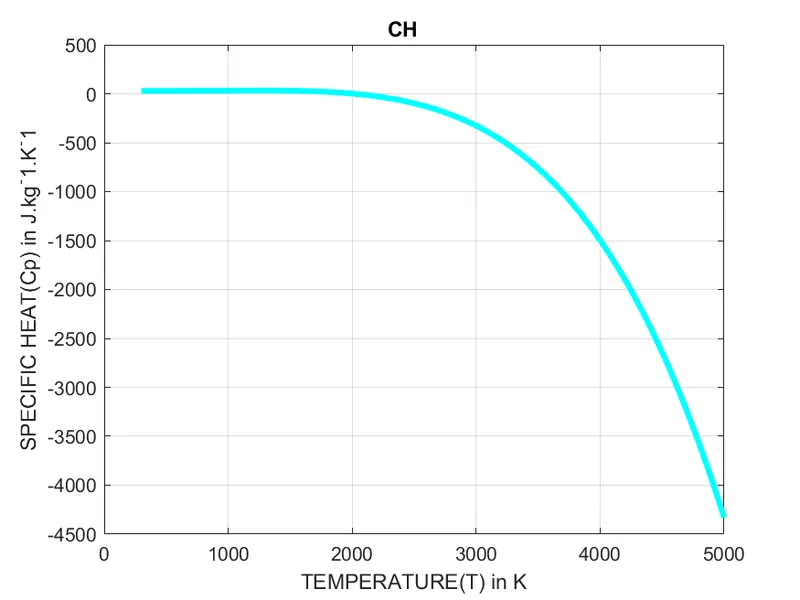
Temperature vs Specific Heat Plot
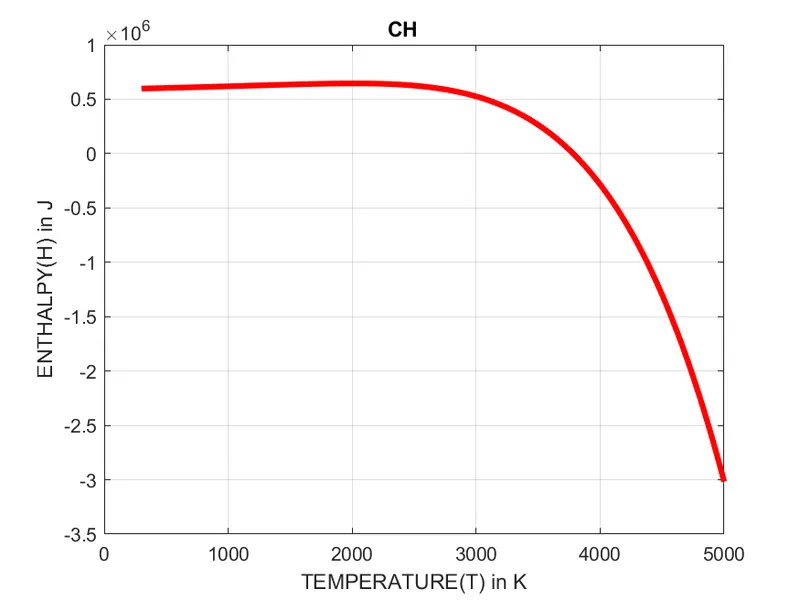
Temperature vs Enthalpy Plot
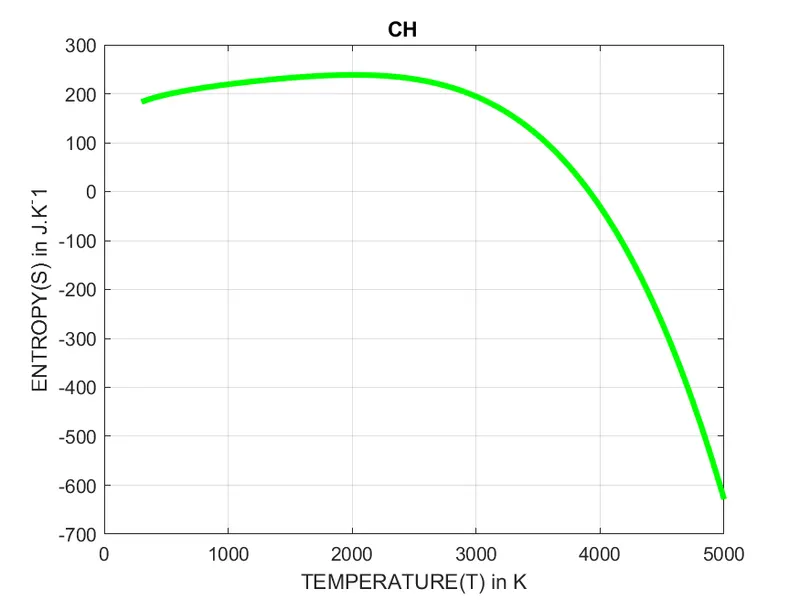
Temeprature vs Entropy Plot
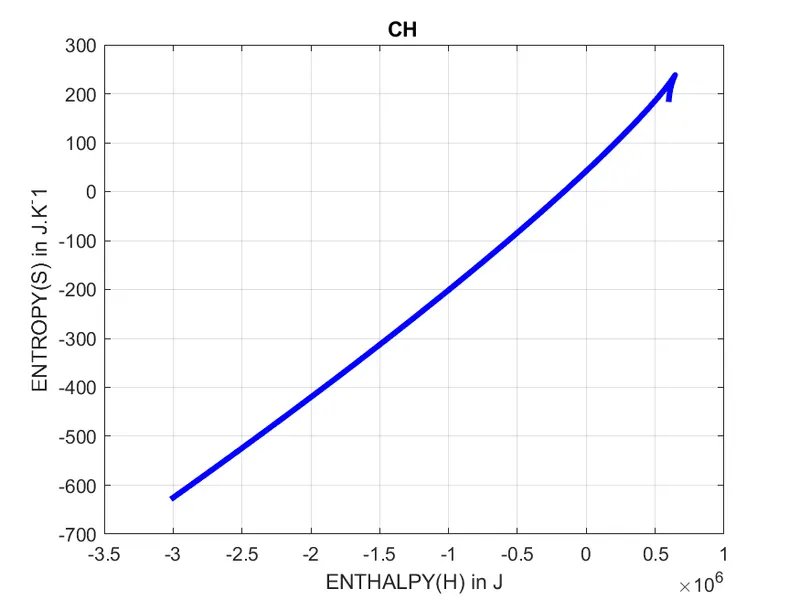
Enthalpy vs Entropy Plot
Following are the plots for 'CH2' species
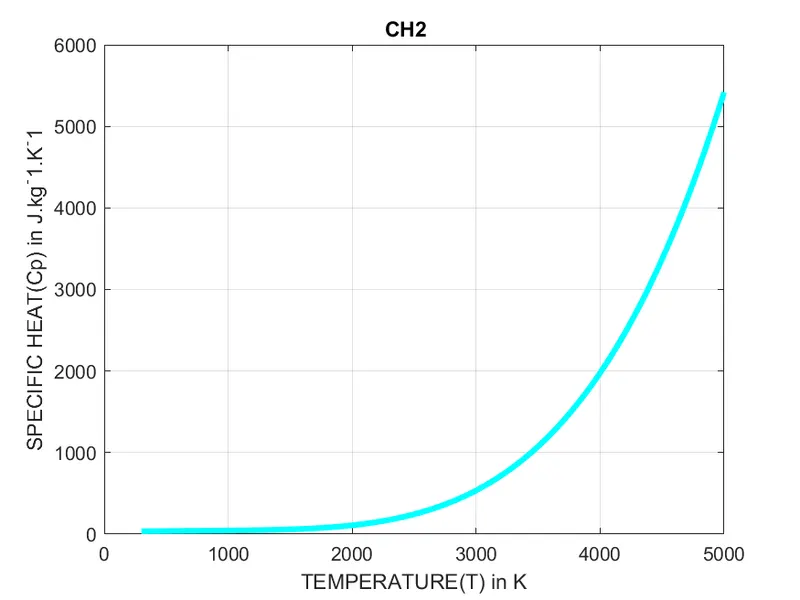
Temperature vs Specific Heat Plot
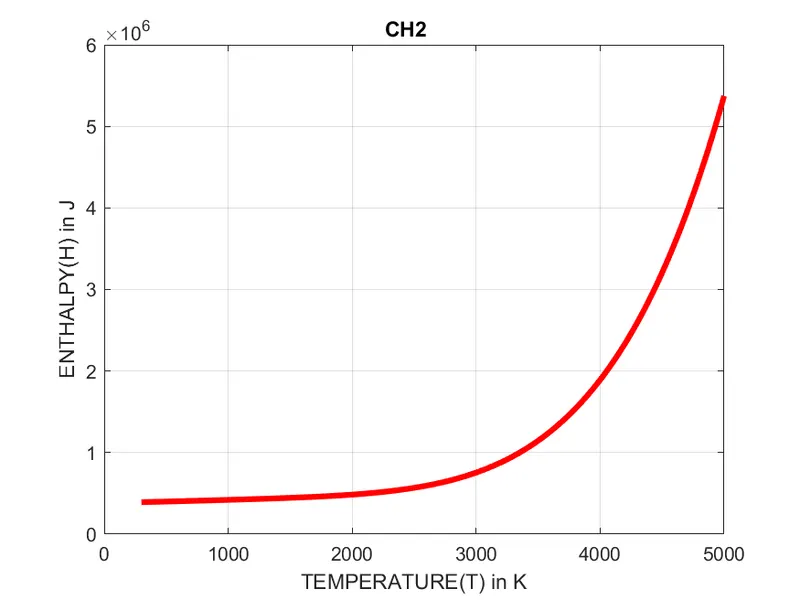
Temperature vs Enthalpy Plot
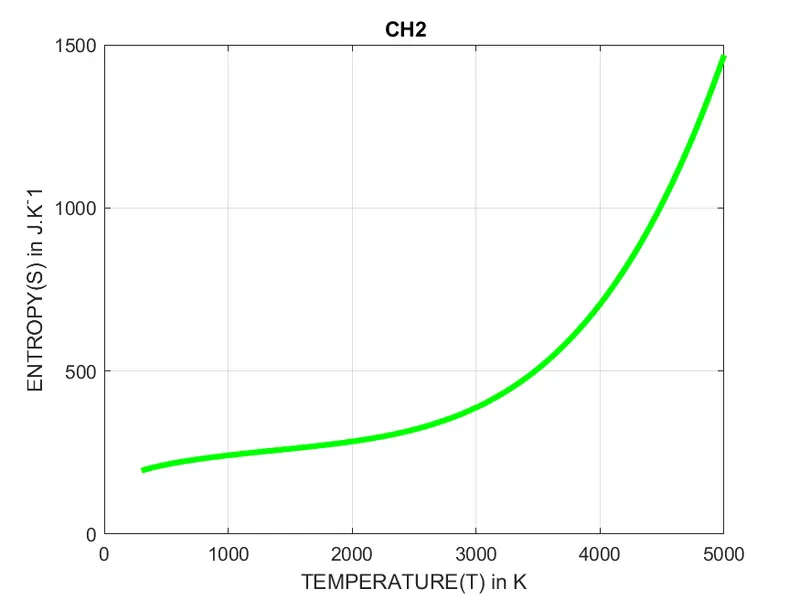
Temeprature vs Entropy Plot
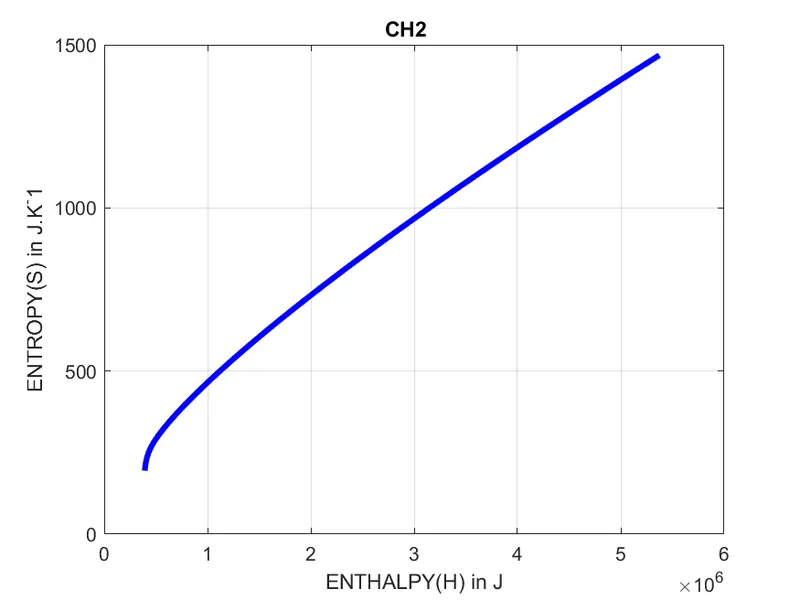
Enthalpy vs Entropy Plot
Following are the plots for 'CH2(S)' species
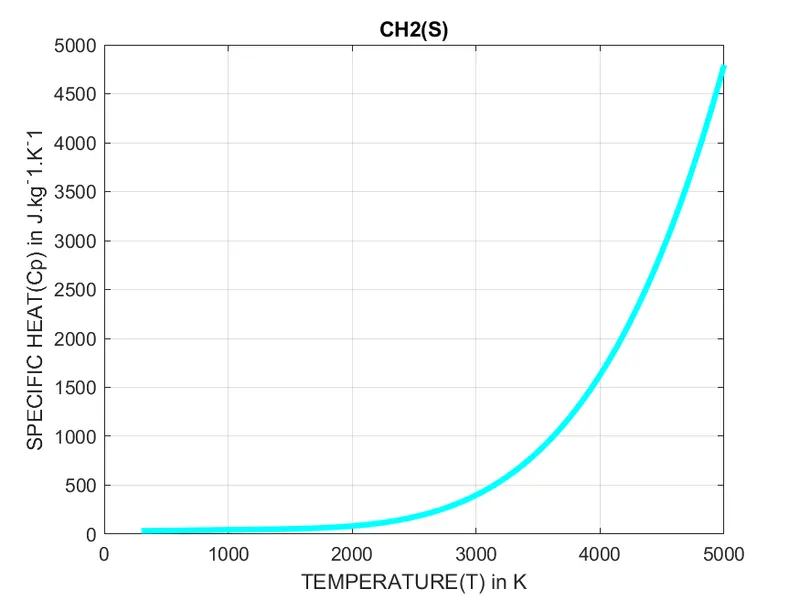
Temperature vs Specific Heat Plot
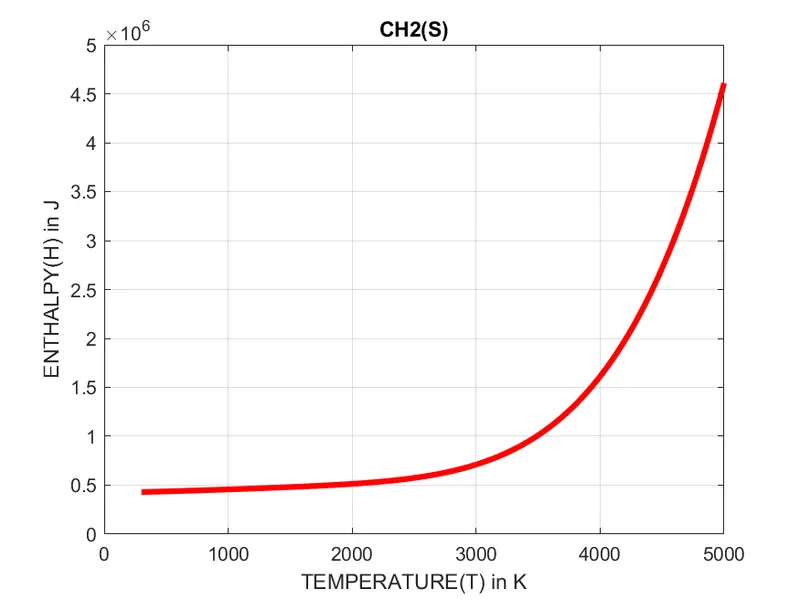
Temperature vs Enthalpy Plot
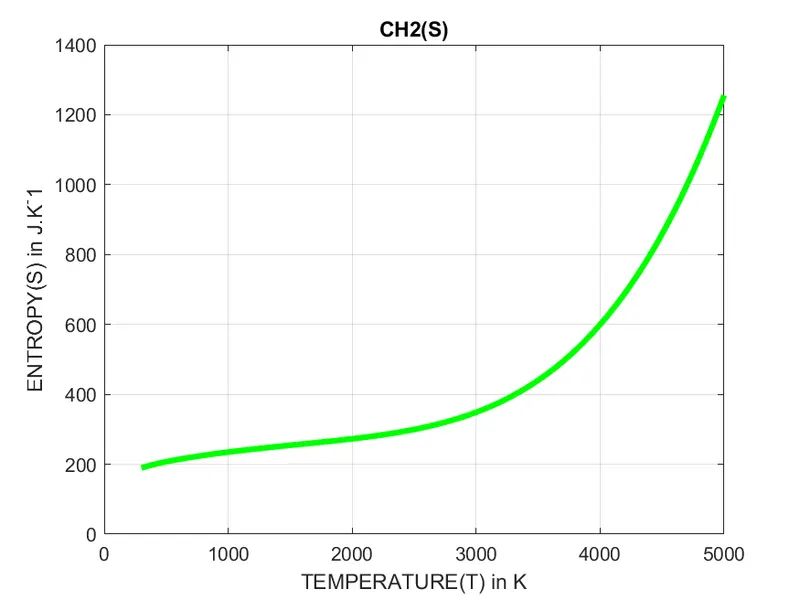
Temeprature vs Entropy Plot
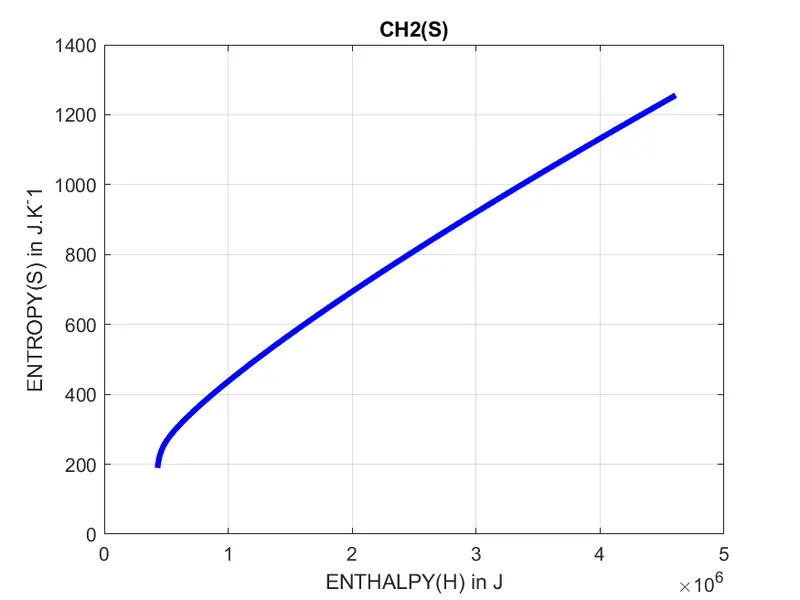
Enthalpy vs Entropy Plot
Following are the plots for 'CH3' species
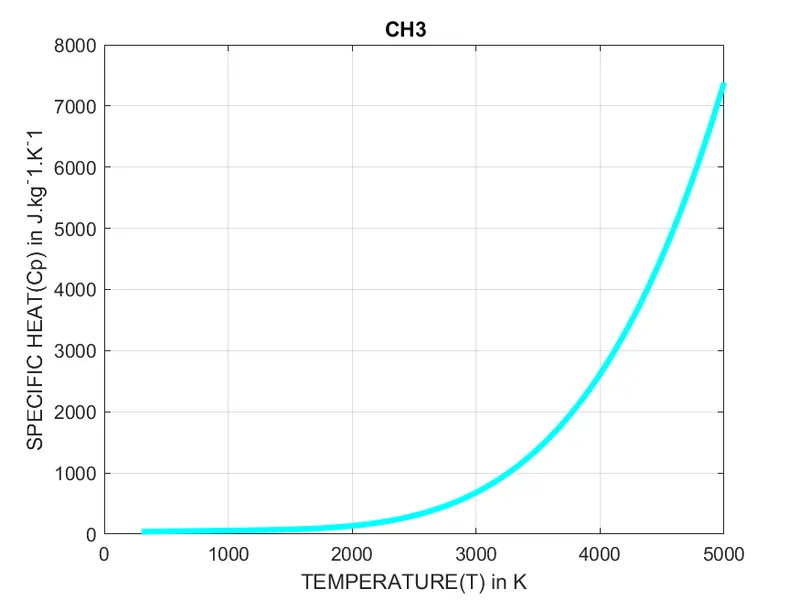
Temperature vs Specific Heat Plot
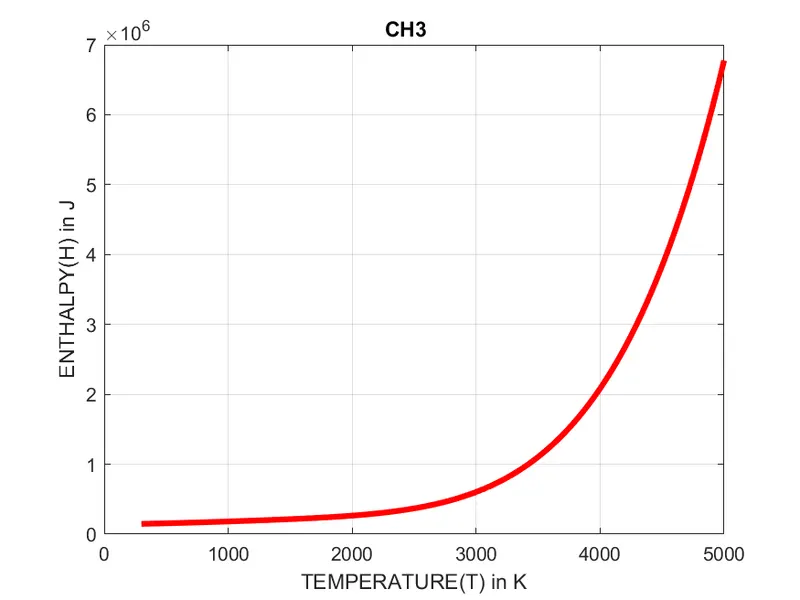
Temperature vs Enthalpy Plot
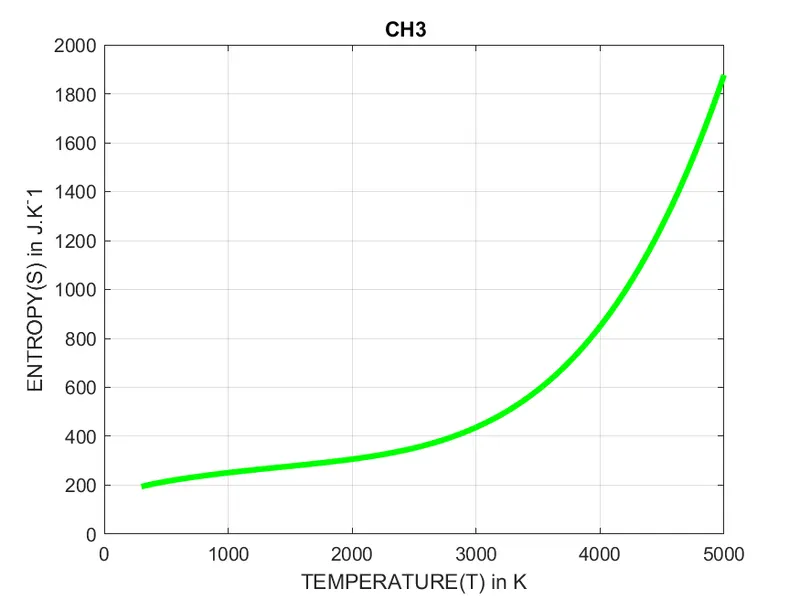
Temeprature vs Entropy Plot
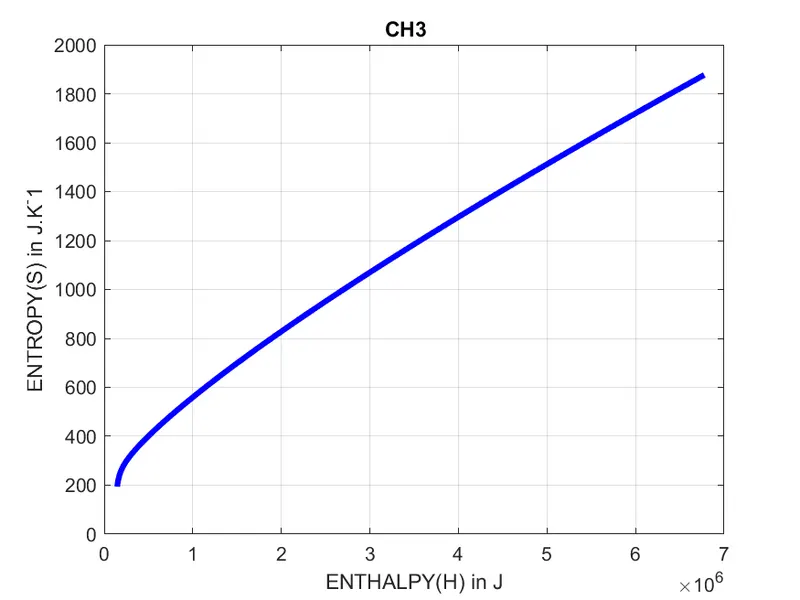
Enthalpy vs Entropy Plot
Following are the plots for 'CH4' species
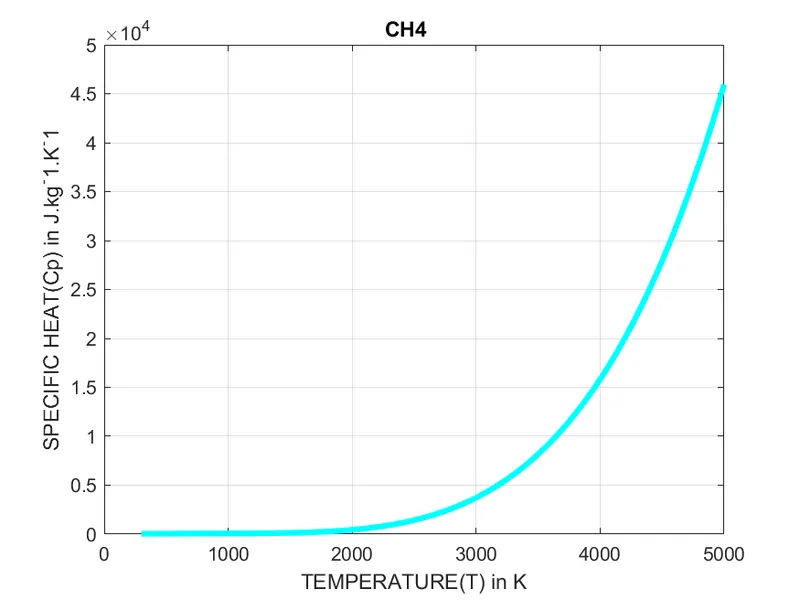
Temperature vs Specific Heat Plot
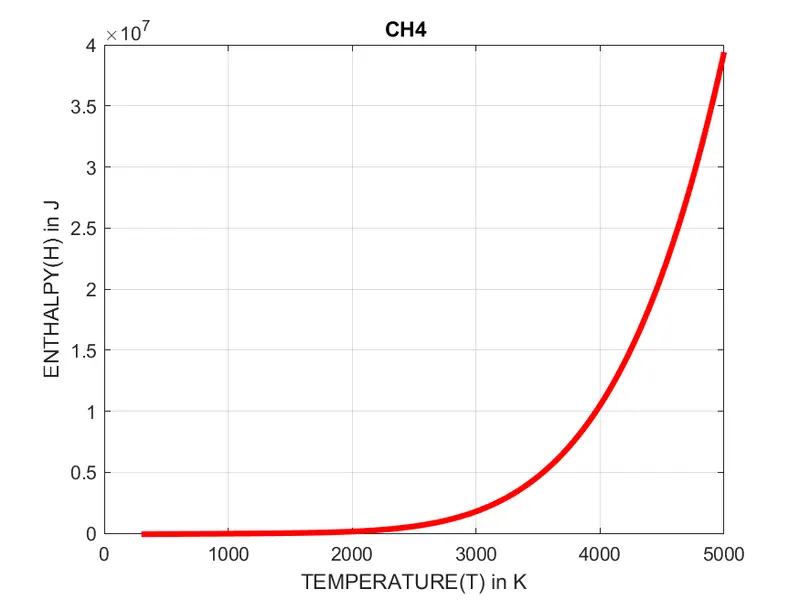
Temperature vs Enthalpy Plot
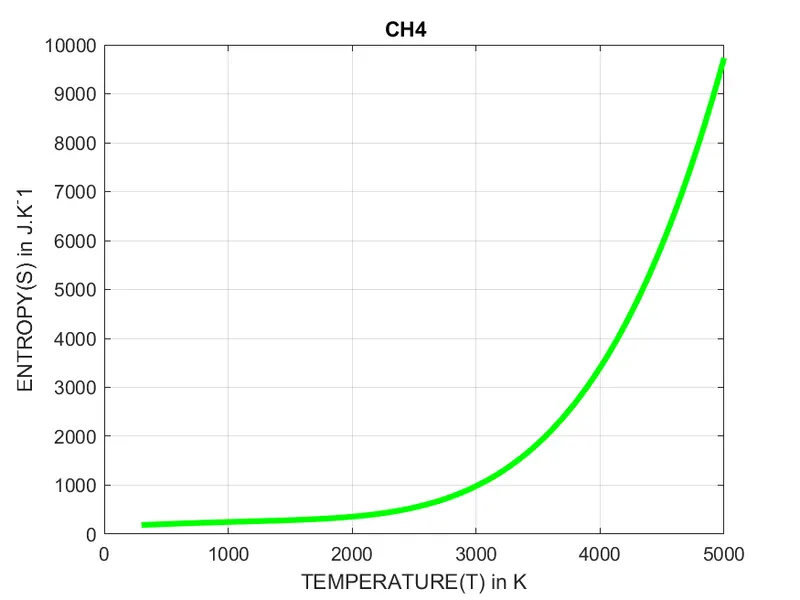
Temeprature vs Entropy Plot
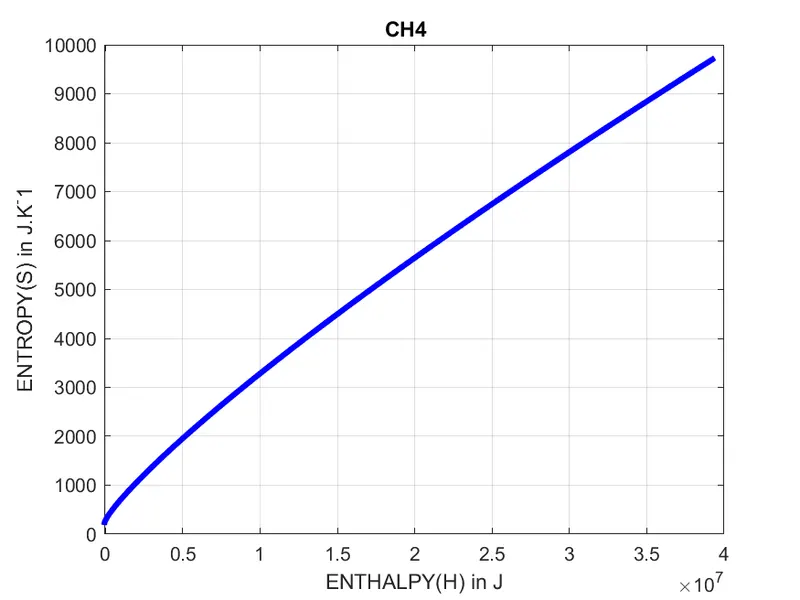
Enthalpy vs Entropy Plot
Following are the plots for 'CO' species
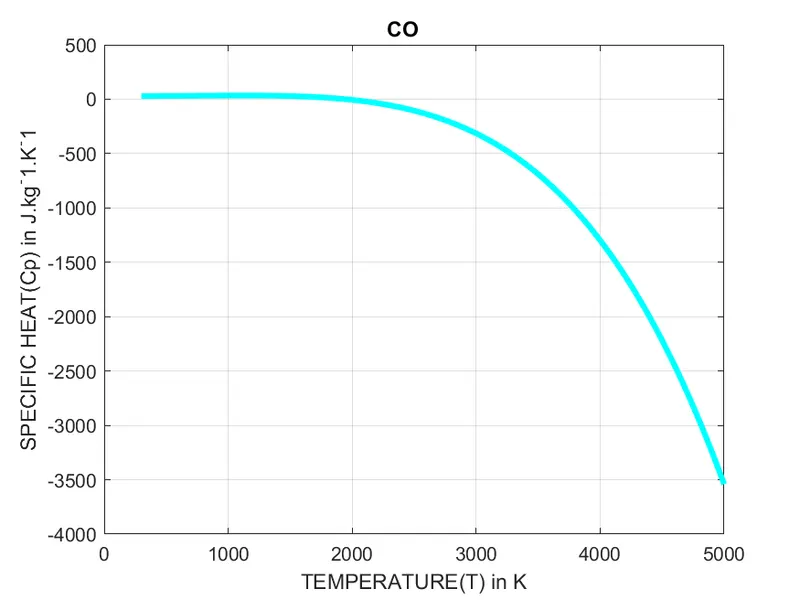
Temperature vs Specific Heat Plot
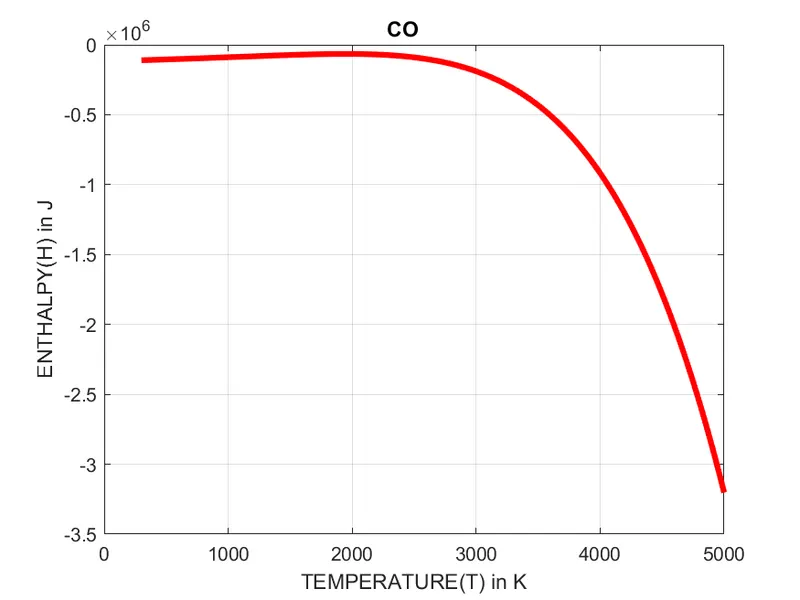
Temperature vs Enthalpy Plot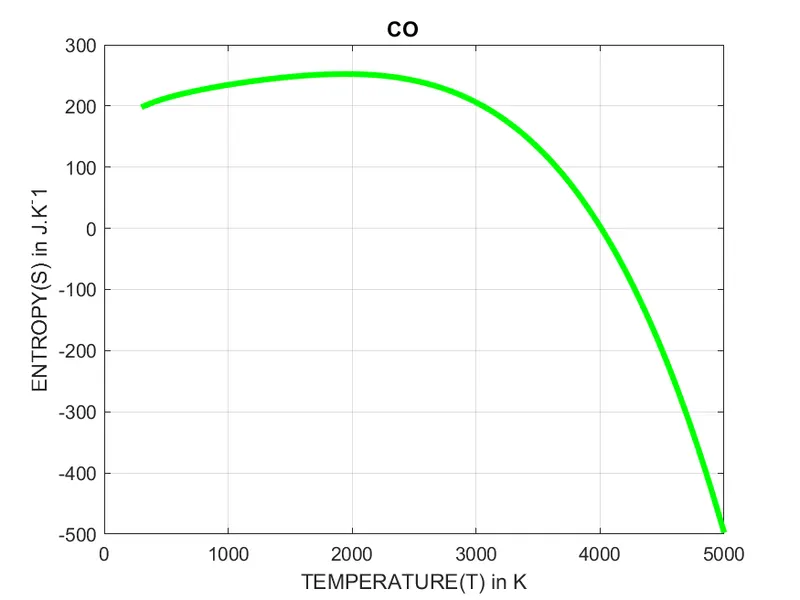
Temeprature vs Entropy Plot
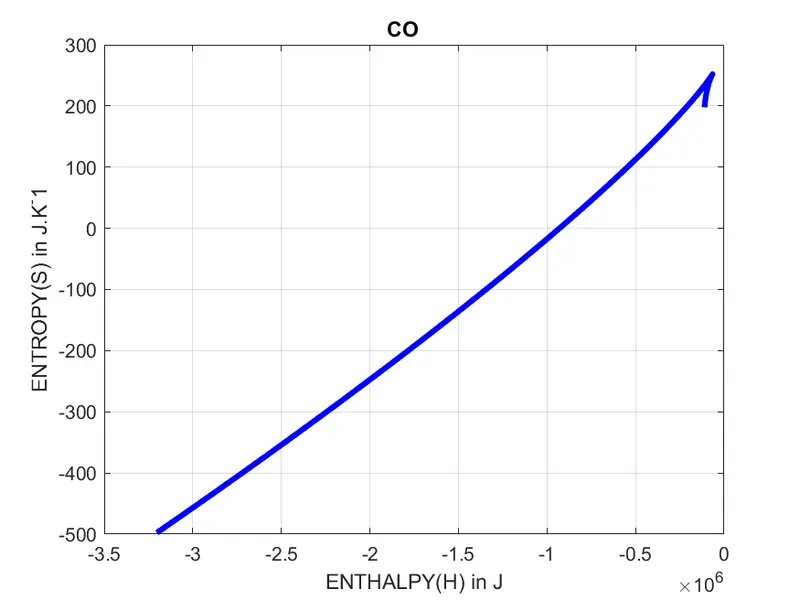
Enthalpy vs Entropy Plot
Following are the plots for 'CO2' species
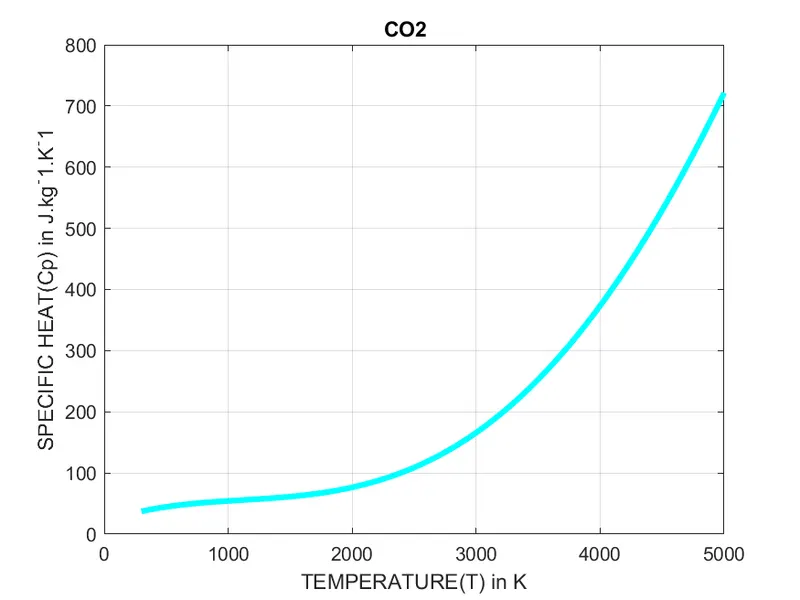
Temperature vs Specific Heat Plot
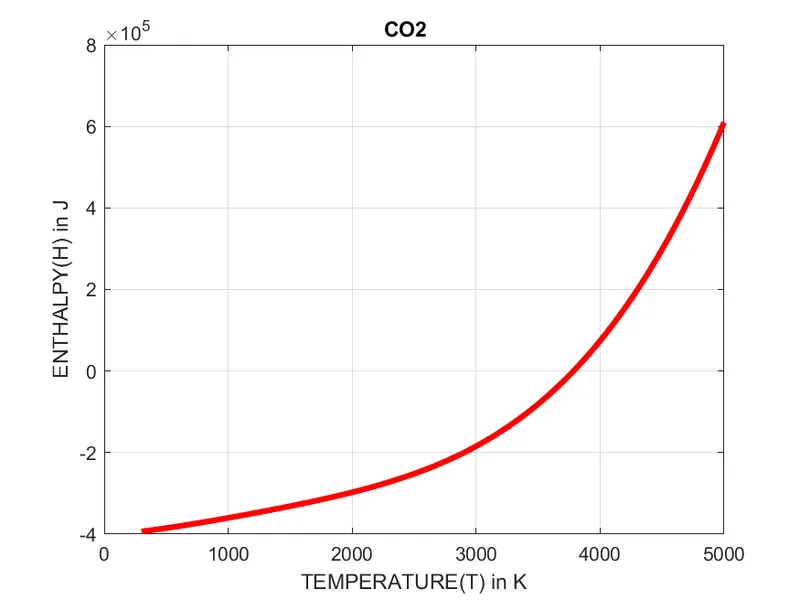
Temperature vs Enthalpy Plot
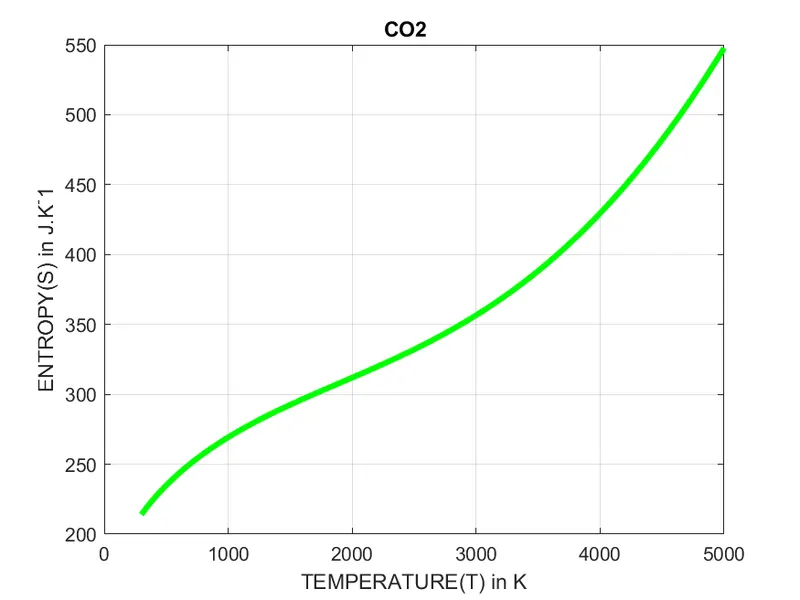
Temeprature vs Entropy Plot
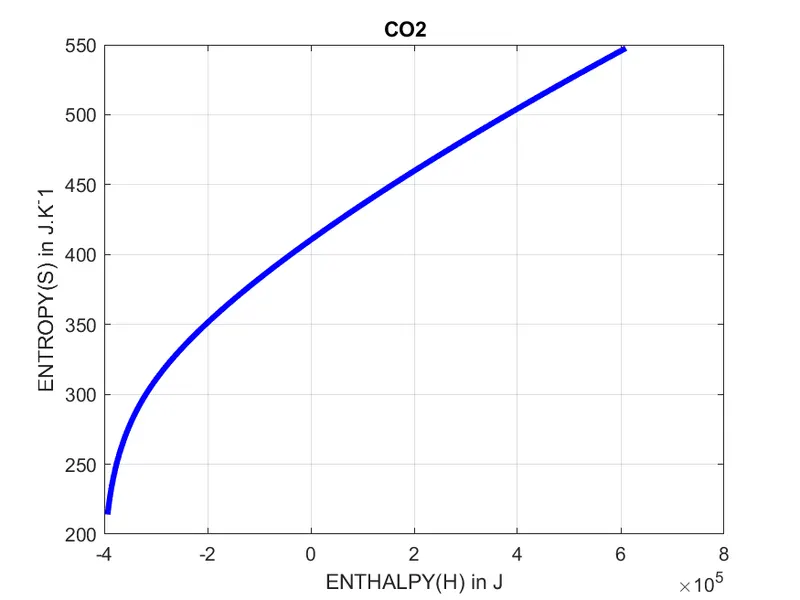
Enthalpy vs Entropy Plot
Following are the plots for 'HCO' species
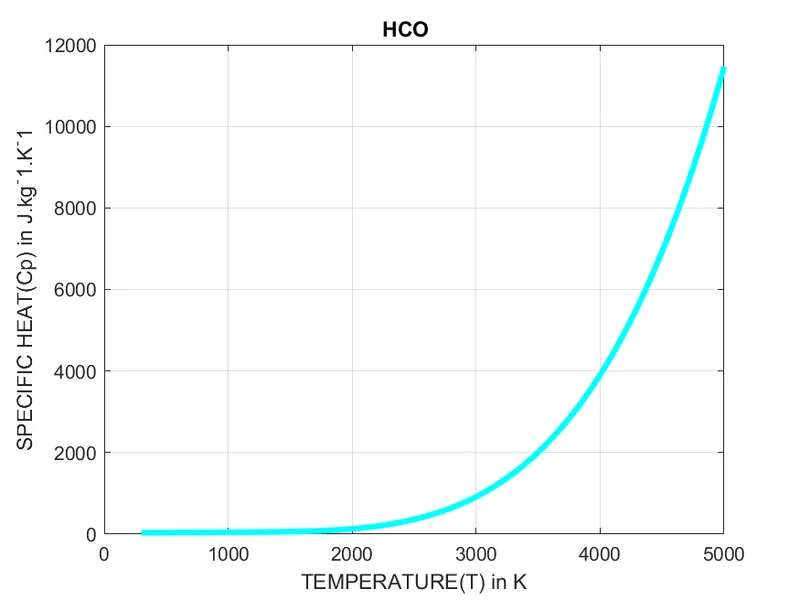
Temperature vs Specific Heat Plot
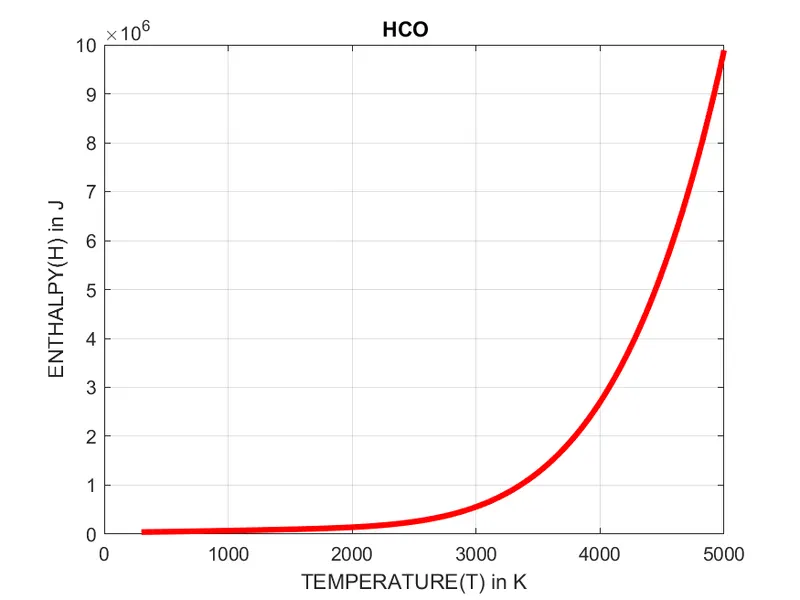
Temperature vs Enthalpy Plot
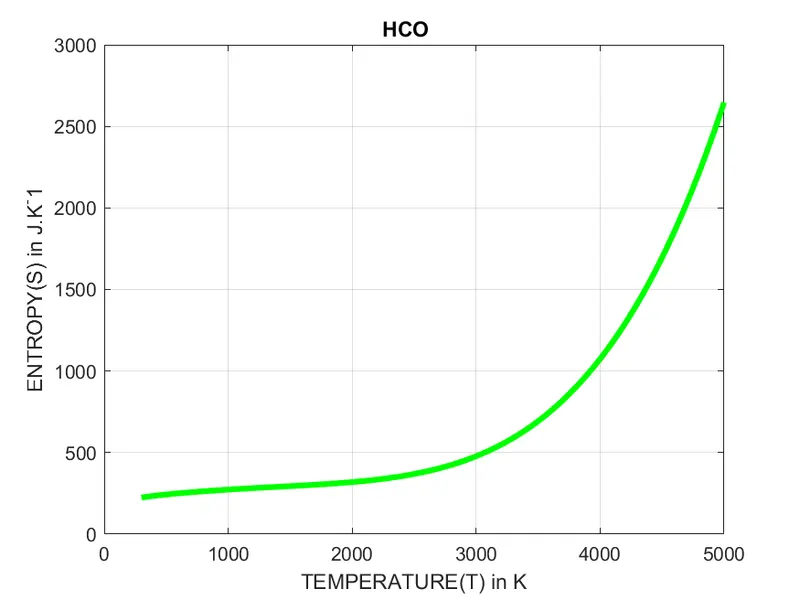
Temeprature vs Entropy Plot
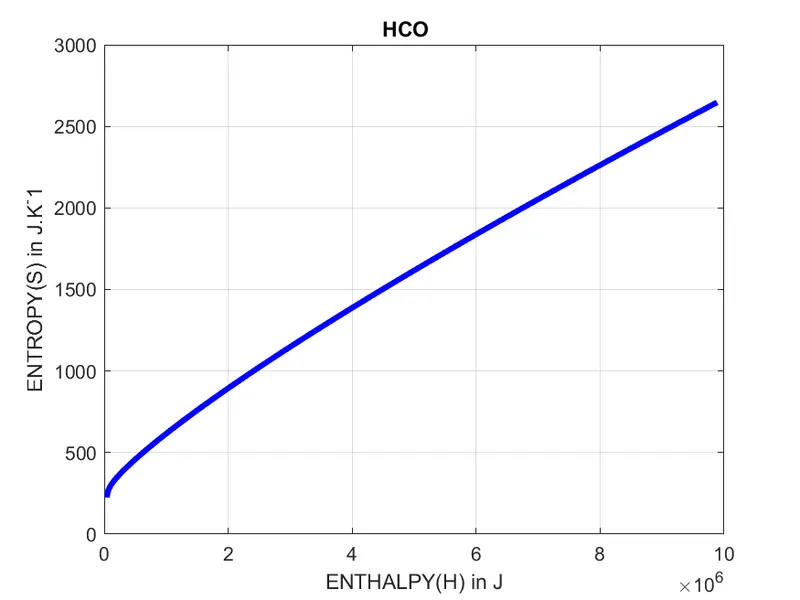
Enthalpy vs Entropy Plot
Following are the plots for 'CH2O' species
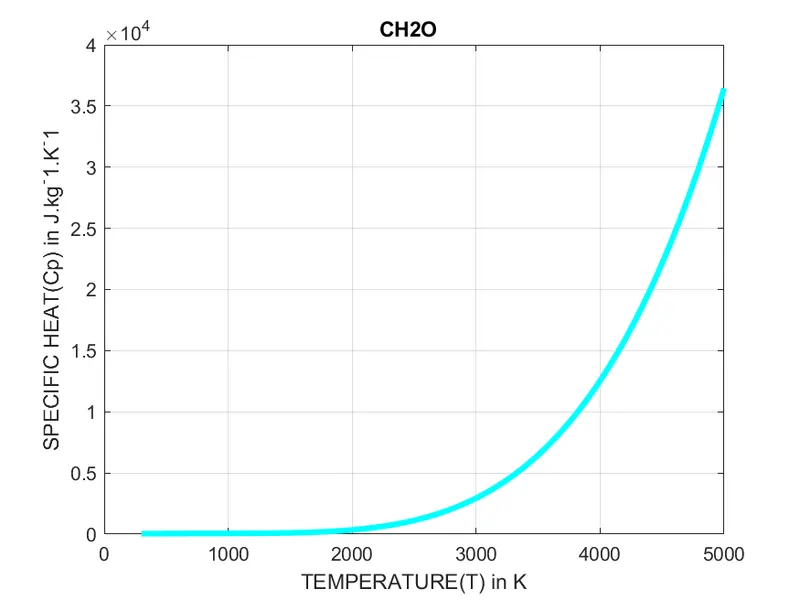
Temperature vs Specific Heat Plot
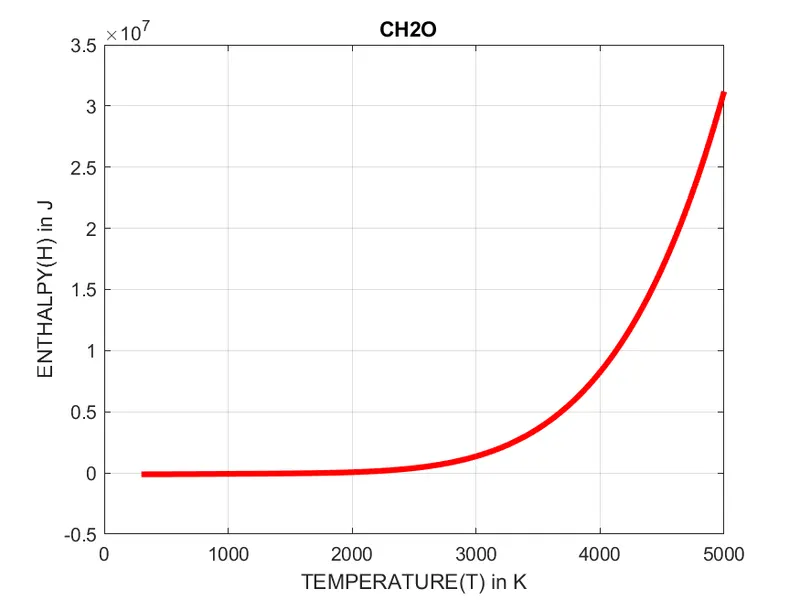
Temperature vs Enthalpy Plot
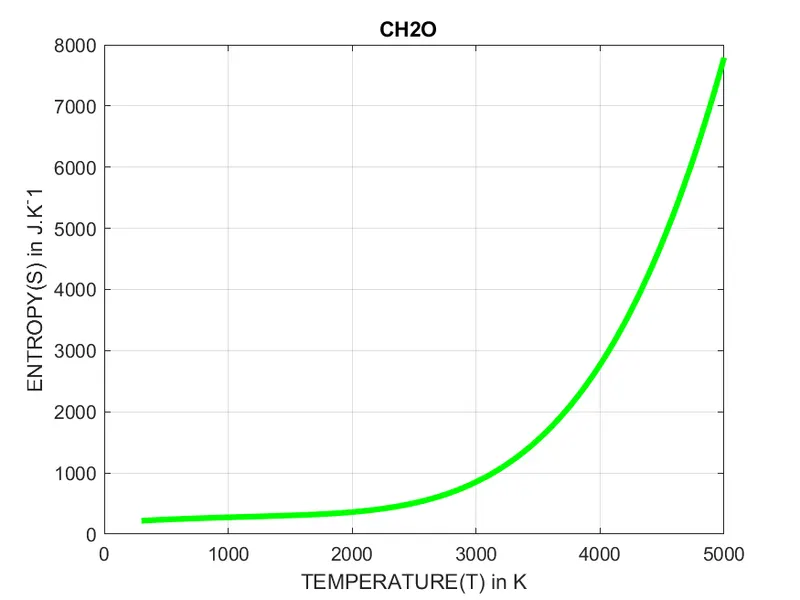
Temeprature vs Entropy Plot
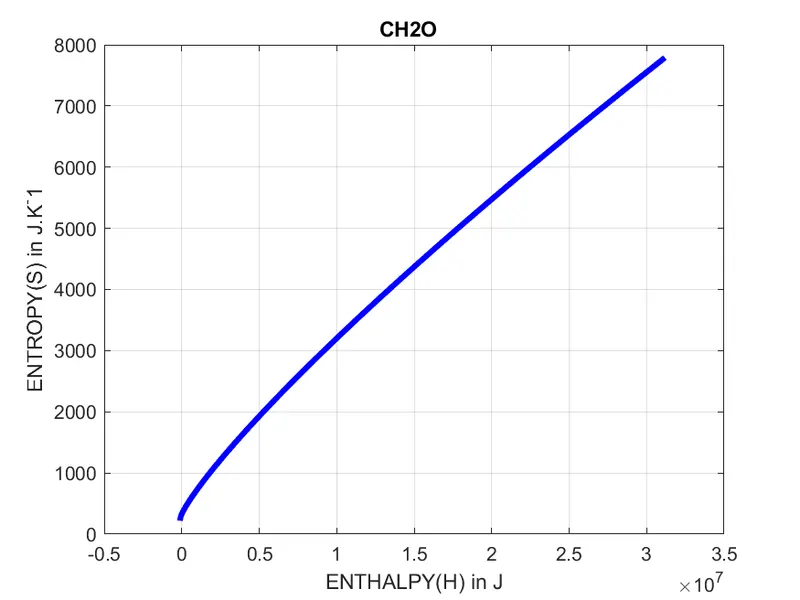
Enthalpy vs Entropy Plot
Following are the plots for 'CH2OH' species
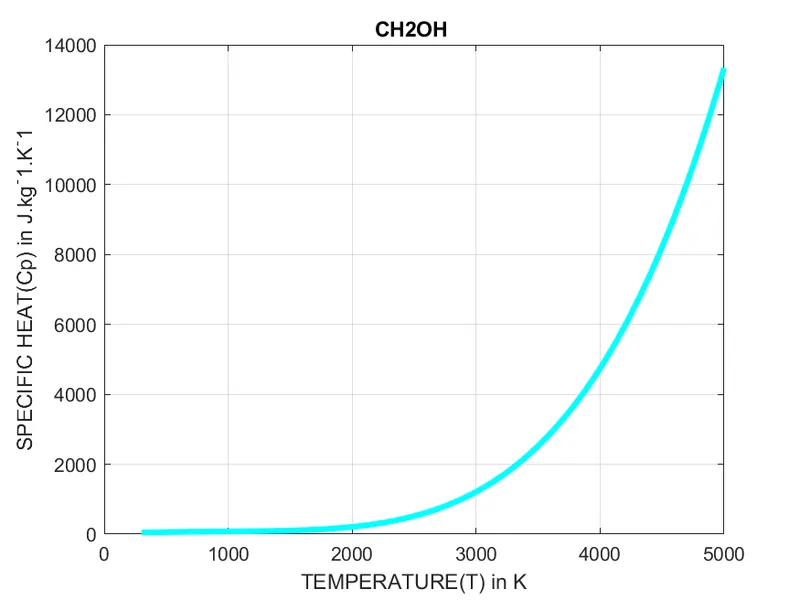
Temperature vs Specific Heat Plot
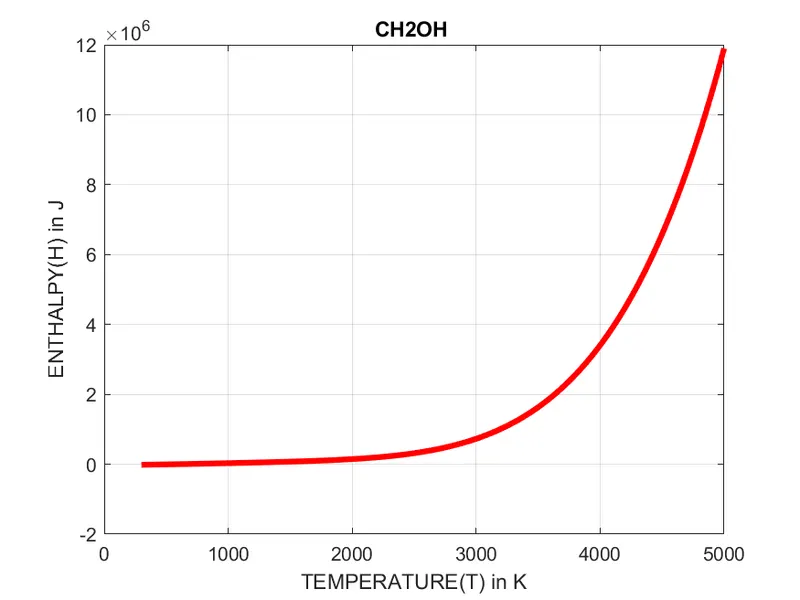
Temperature vs Enthalpy Plot
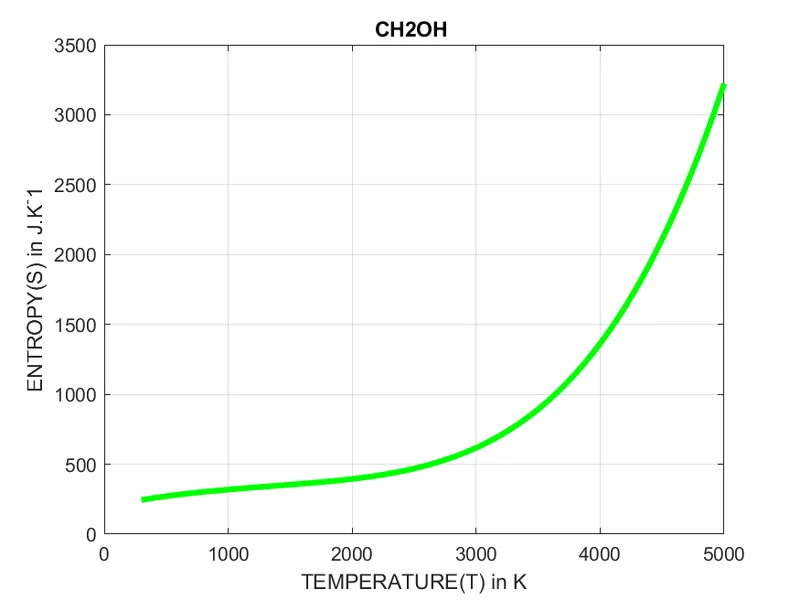
Temeprature vs Entropy Plot
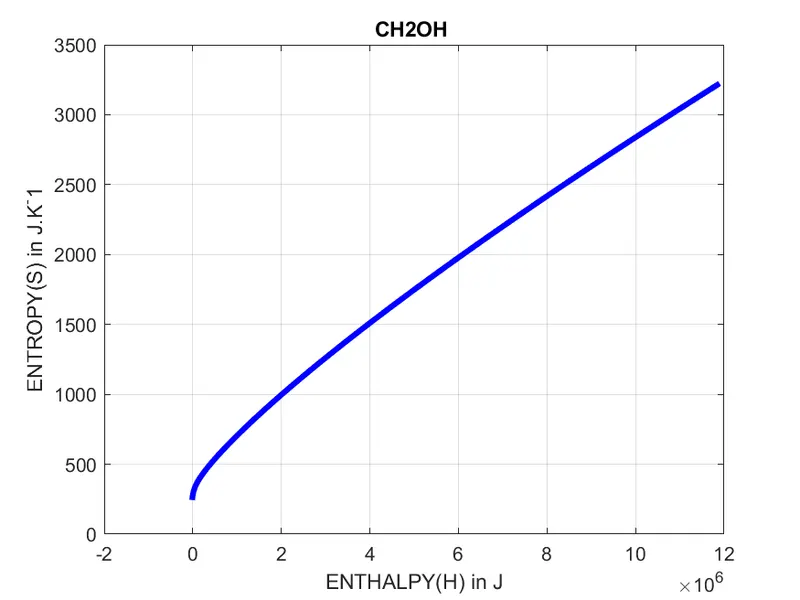
Enthalpy vs Entropy Plot
Following are the plots for 'CH3O' species
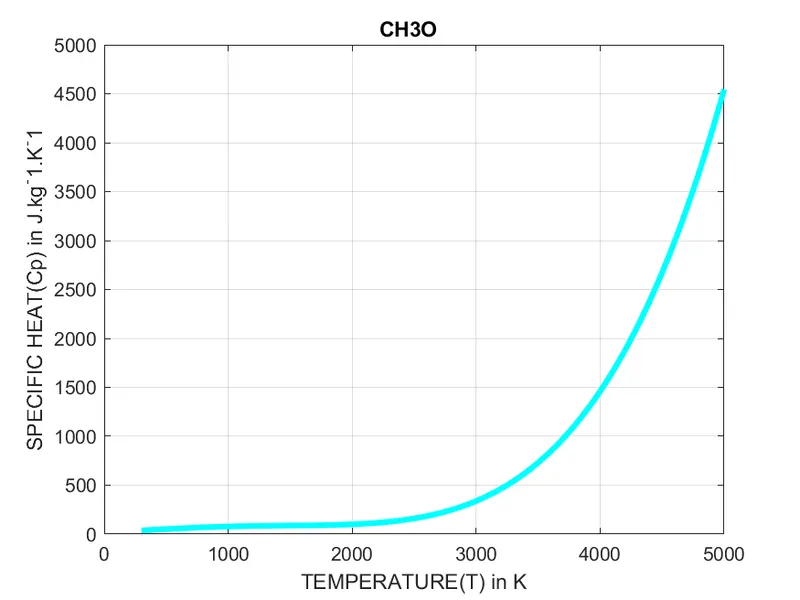
Temperature vs Specific Heat Plot
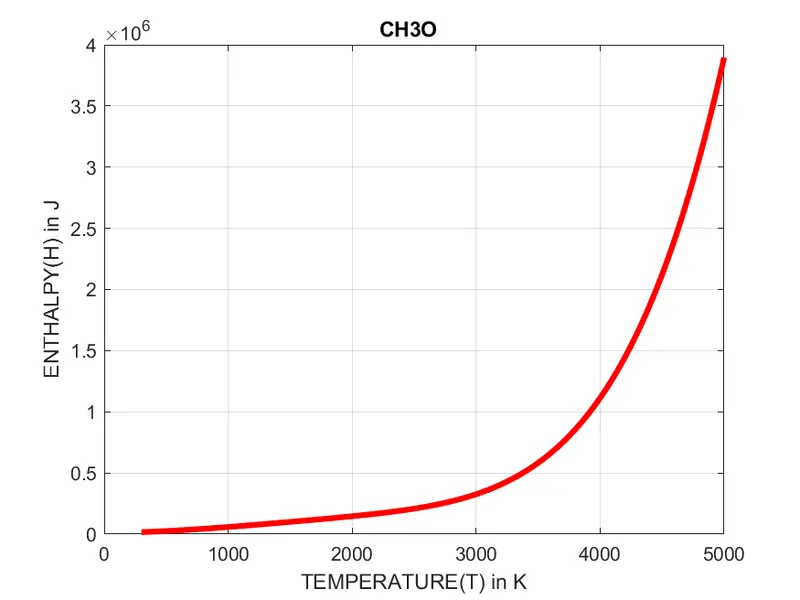
Temperature vs Enthalpy Plot
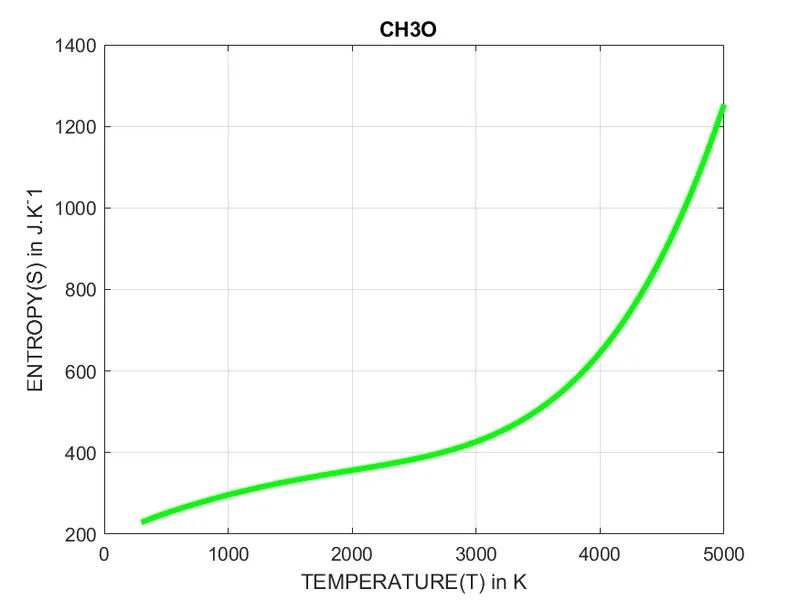
Temeprature vs Entropy Plot
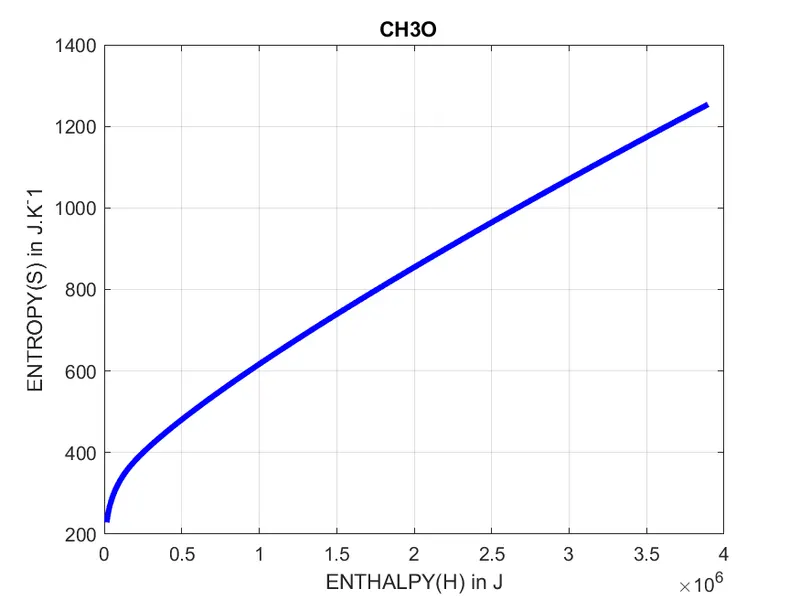
Enthalpy vs Entropy Plot
Following are the plots for 'CH3OH' species
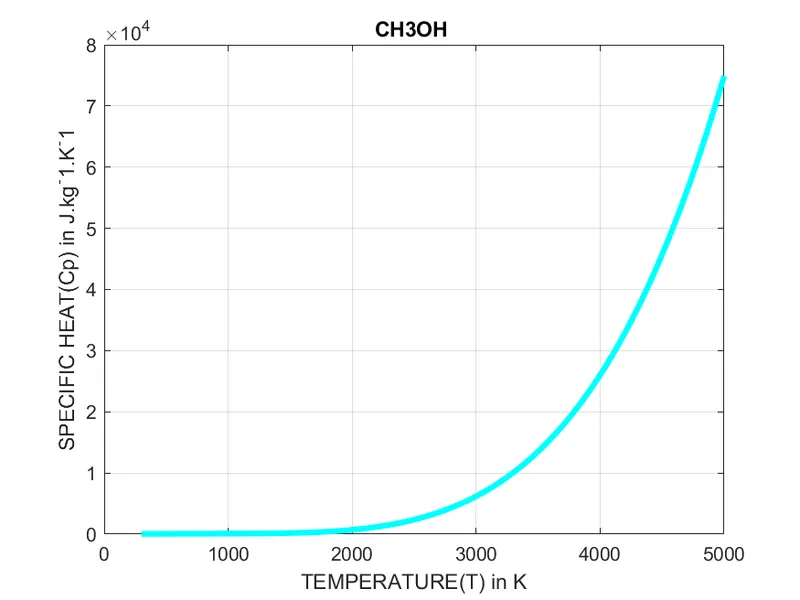
Temperature vs Specific Heat Plot
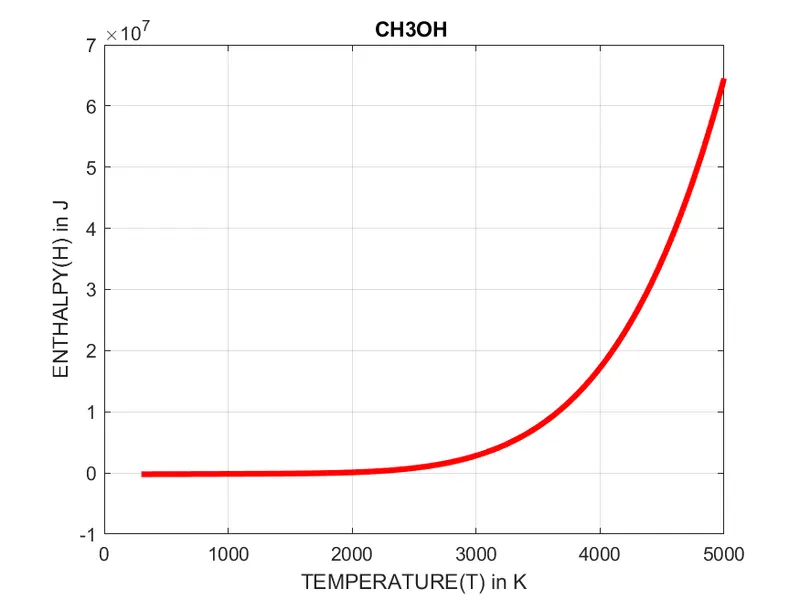
Temperature vs Enthalpy Plot
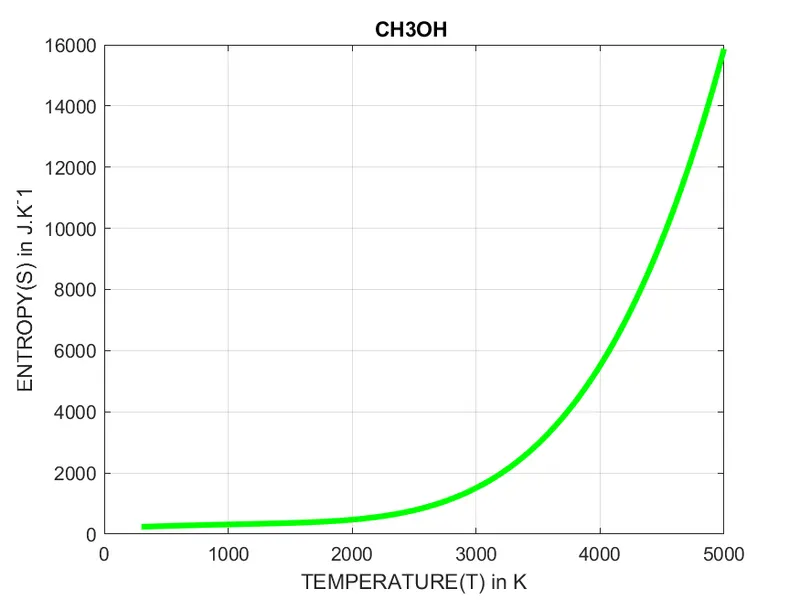
Temeprature vs Entropy Plot
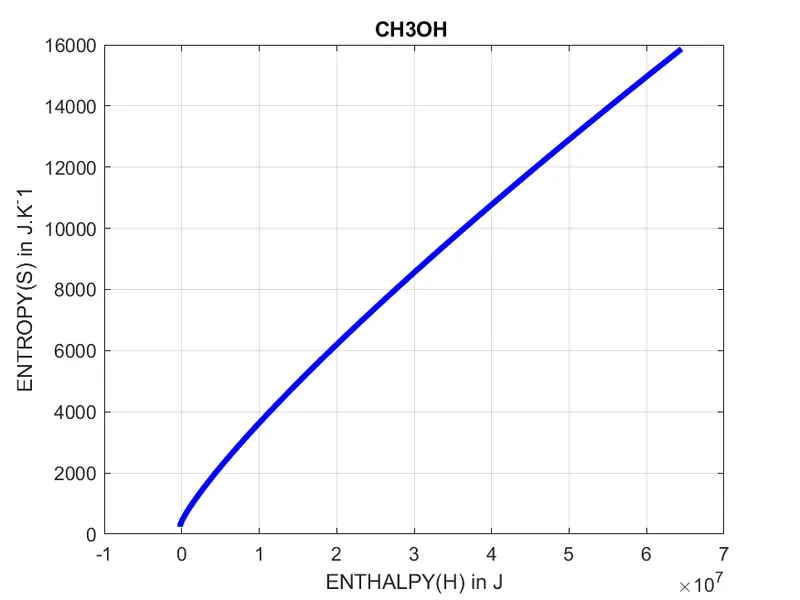
Enthalpy vs Entropy Plot
Following are the plots for 'C2H' species
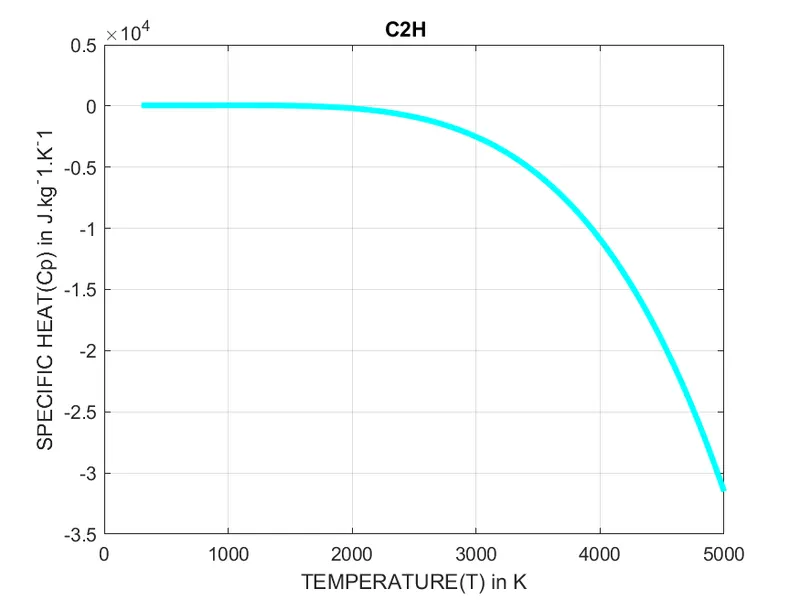
Temperature vs Specific Heat Plot
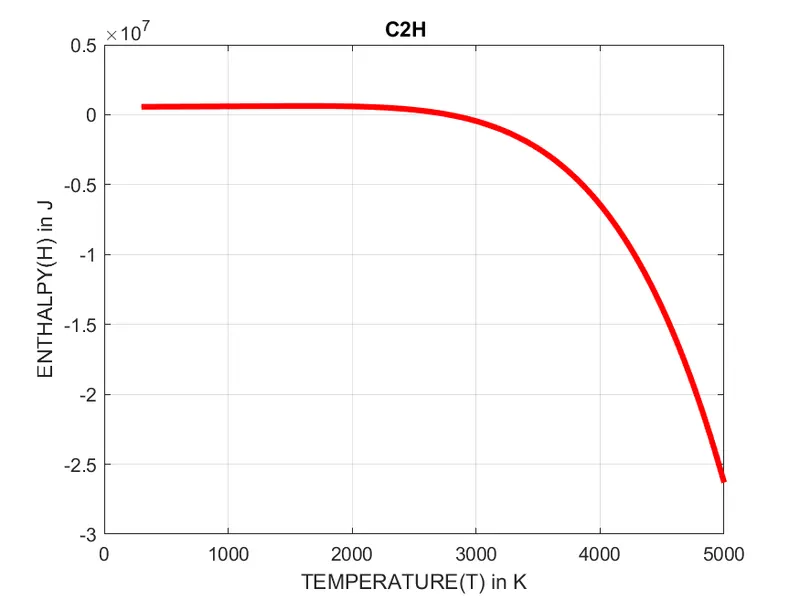
Temperature vs Enthalpy Plot
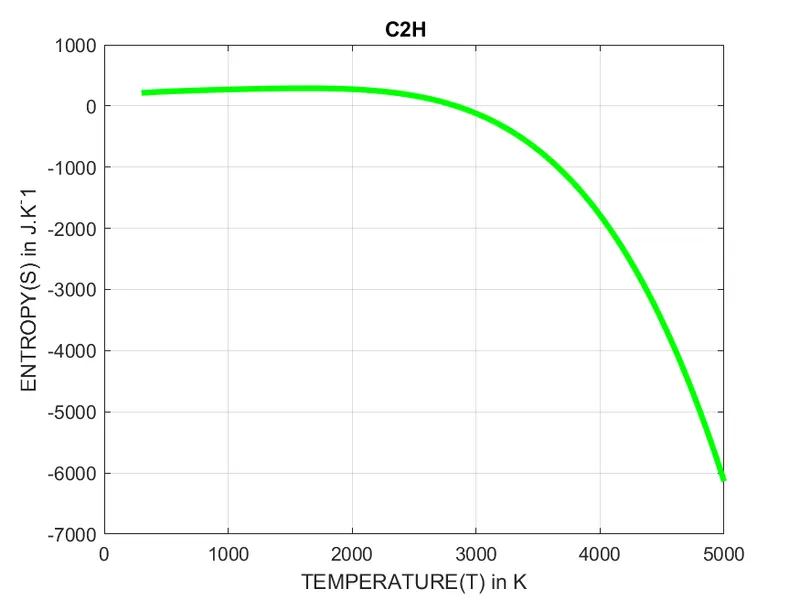
Temeprature vs Entropy Plot
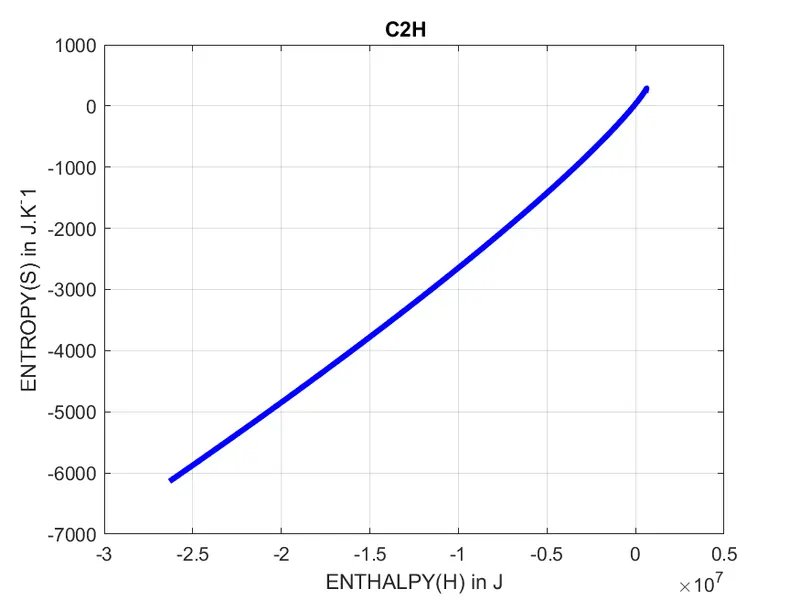
Enthalpy vs Entropy Plot
Following are the plots for 'C2H2' species
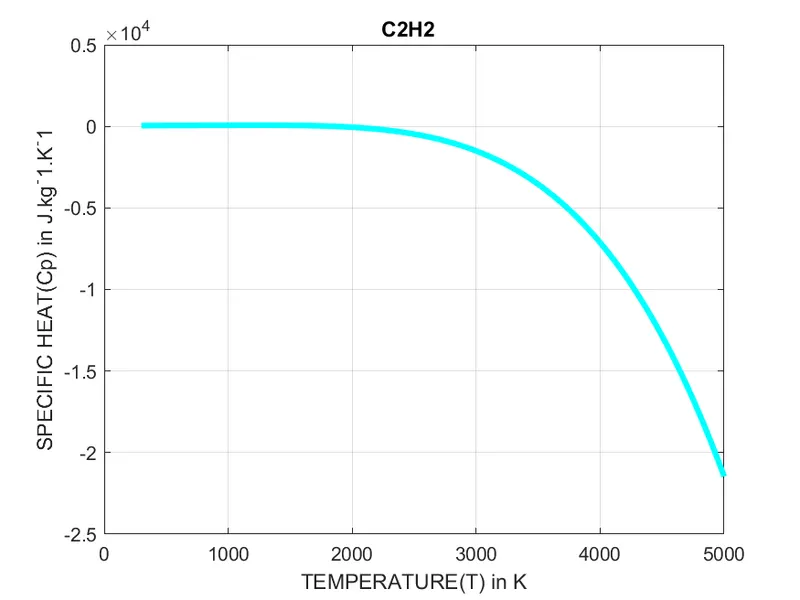
Temperature vs Specific Heat Plot
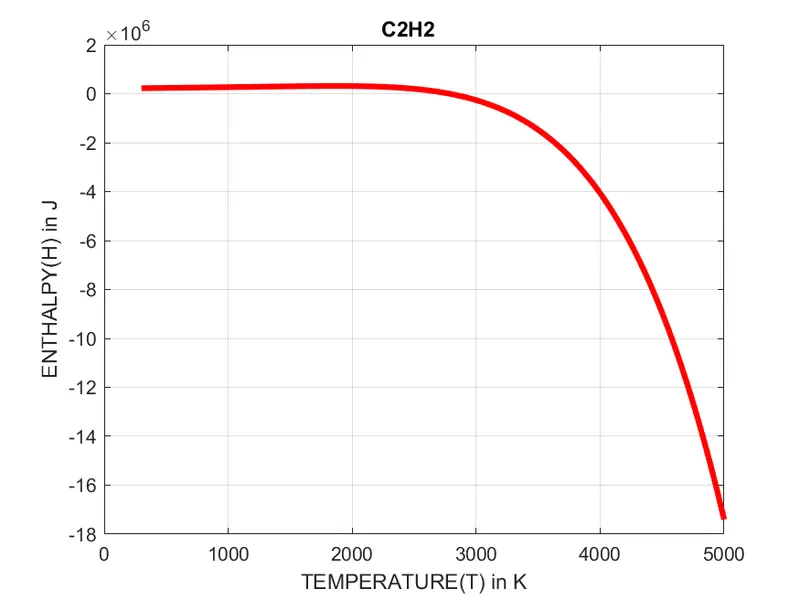
Temperature vs Enthalpy Plot
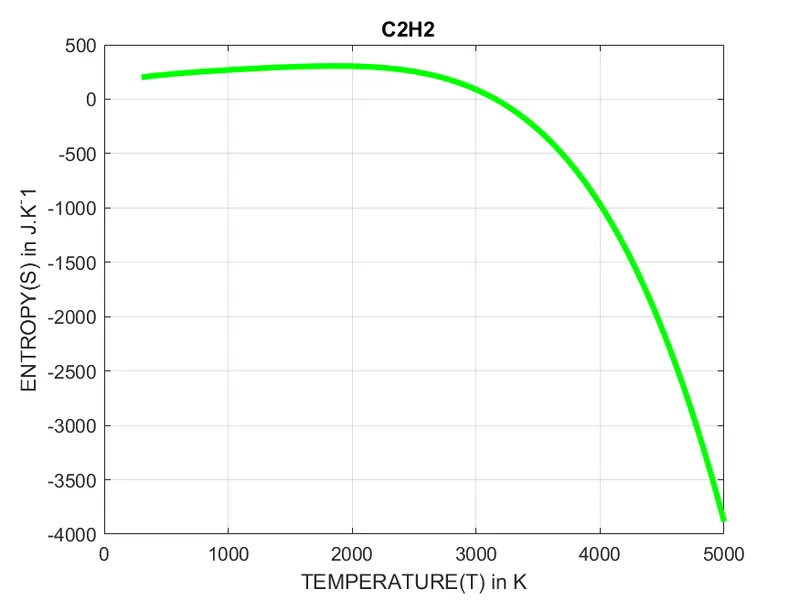
Temeprature vs Entropy Plot
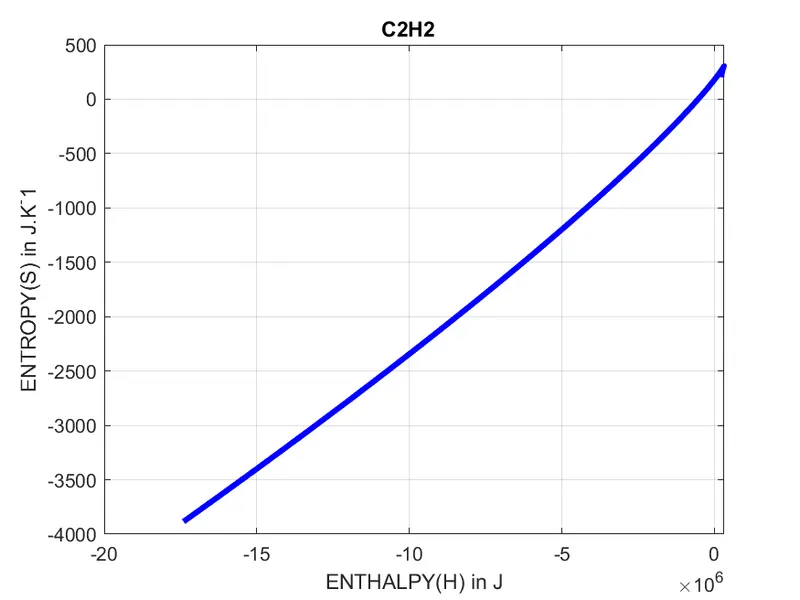
Enthalpy vs Entropy Plot
Following are the plots for 'C2H3' species
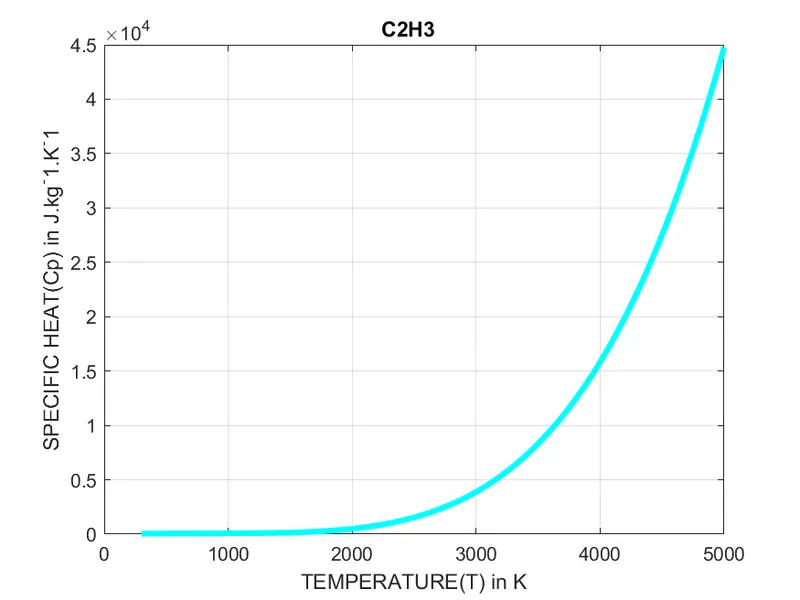
Temperature vs Specific Heat Plot
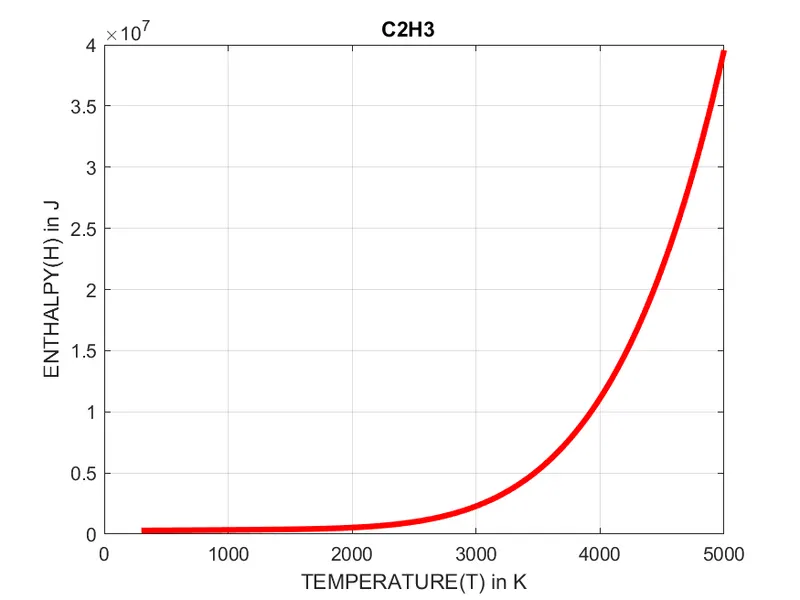
Temperature vs Enthalpy Plot
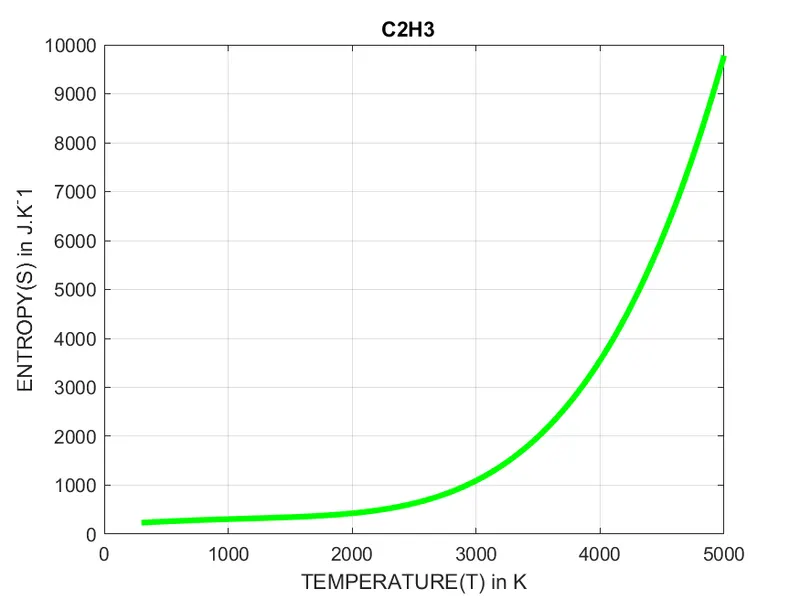
Temeprature vs Entropy Plot
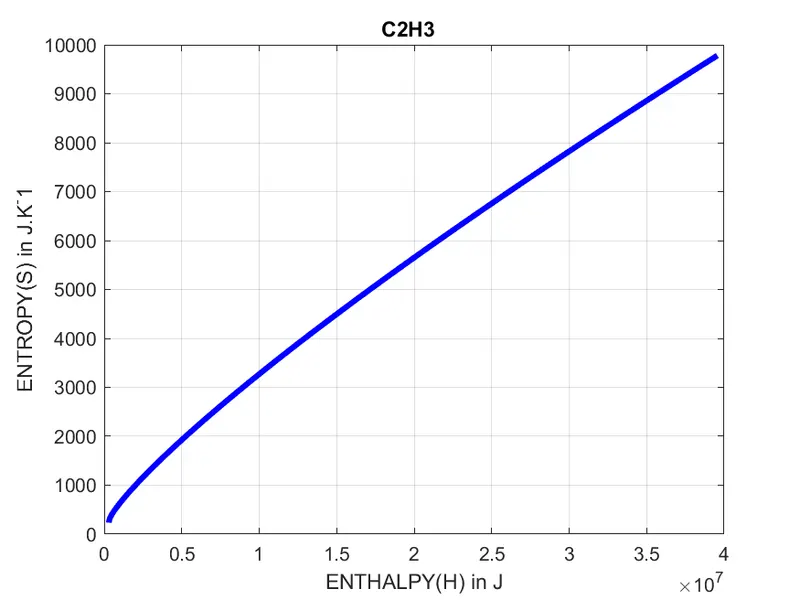
Enthalpy vs Entropy Plot
Following are the plots for 'C2H4' species
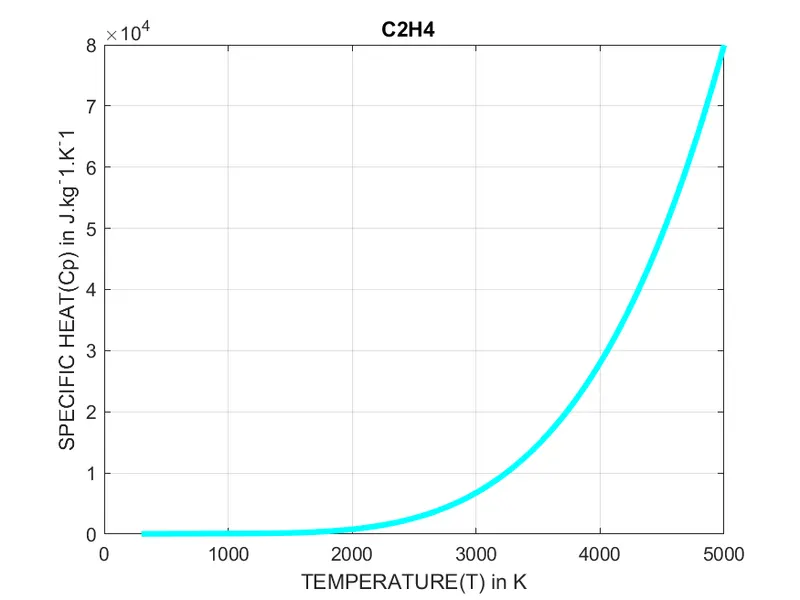
Temperature vs Specific Heat Plot
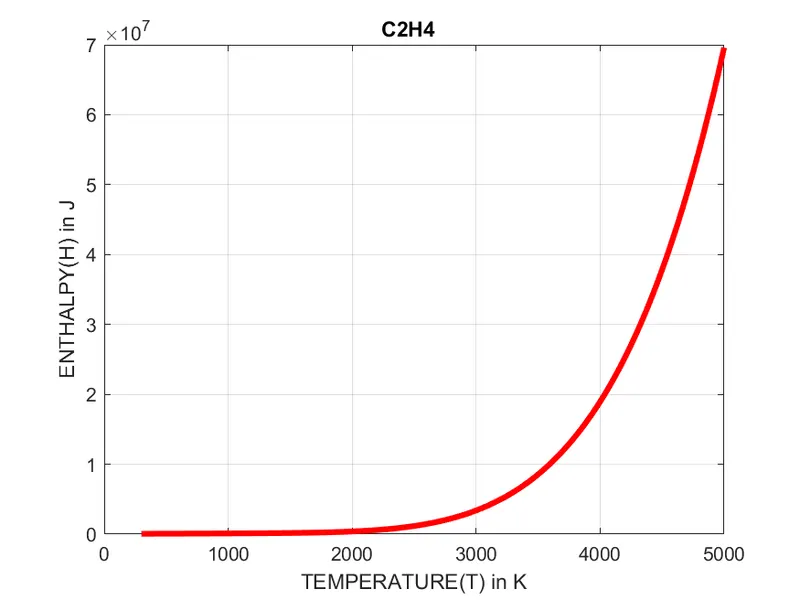
Temperature vs Enthalpy Plot
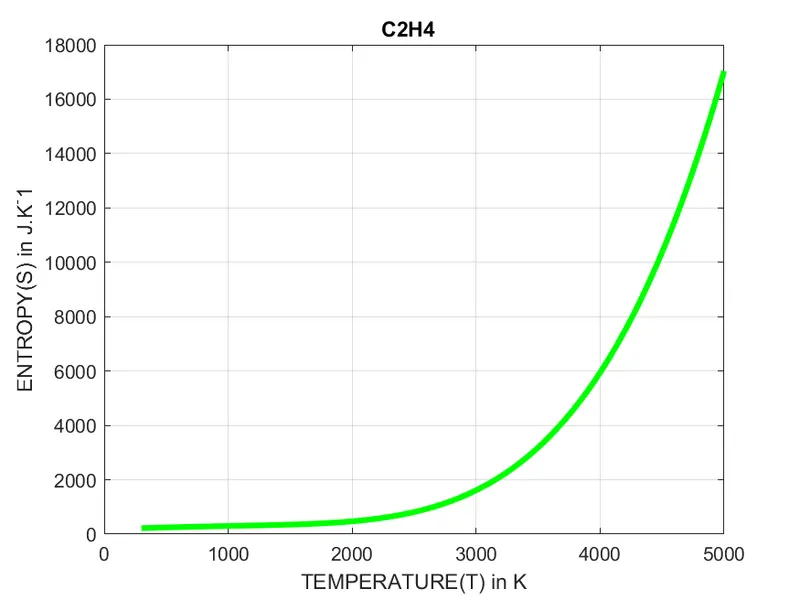
Temeprature vs Entropy Plot
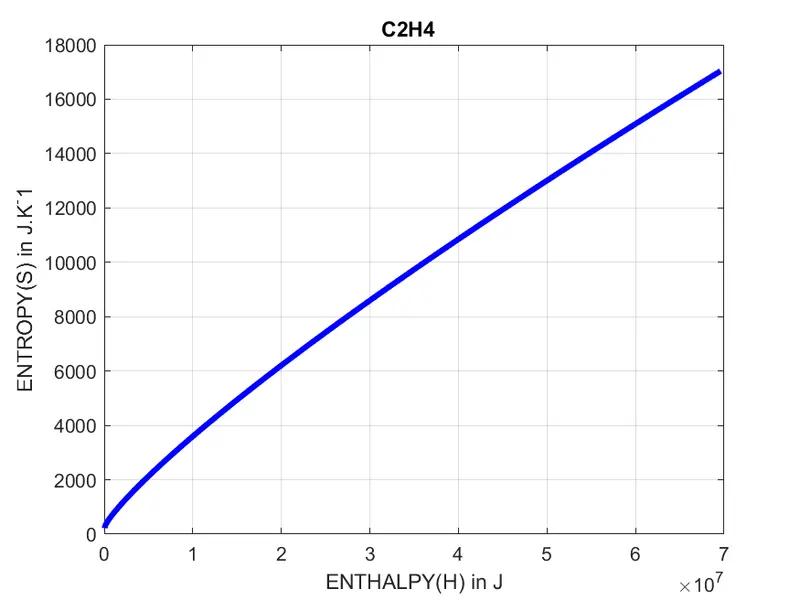
Enthalpy vs Entropy Plot
Following are the plots for 'C2H5' species
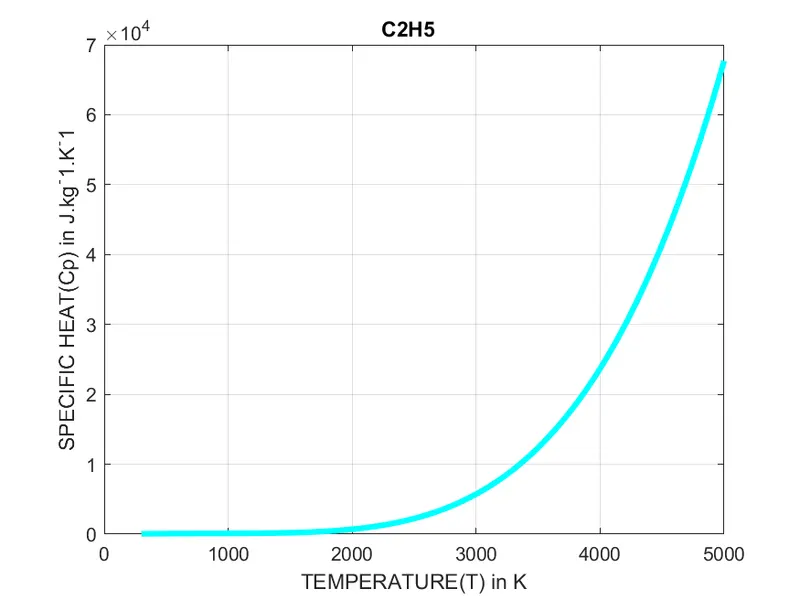
Temperature vs Specific Heat Plot
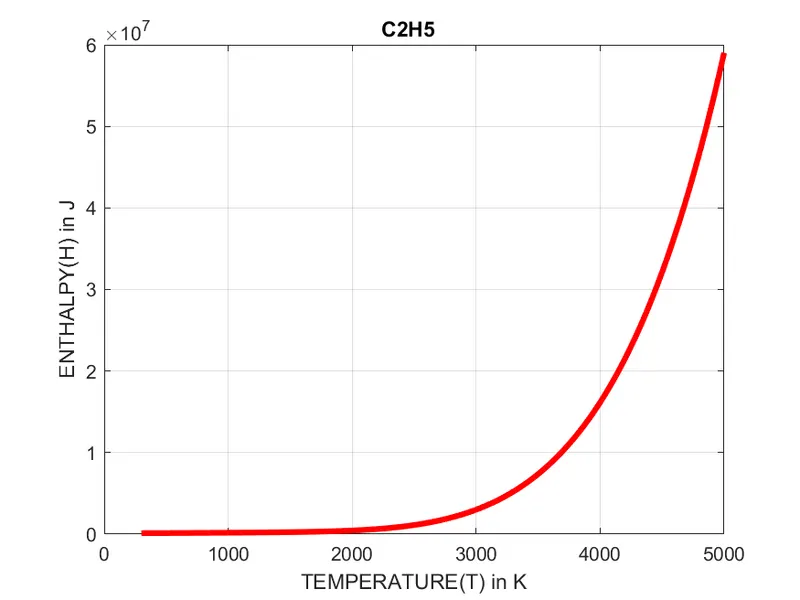
Temperature vs Enthalpy Plot
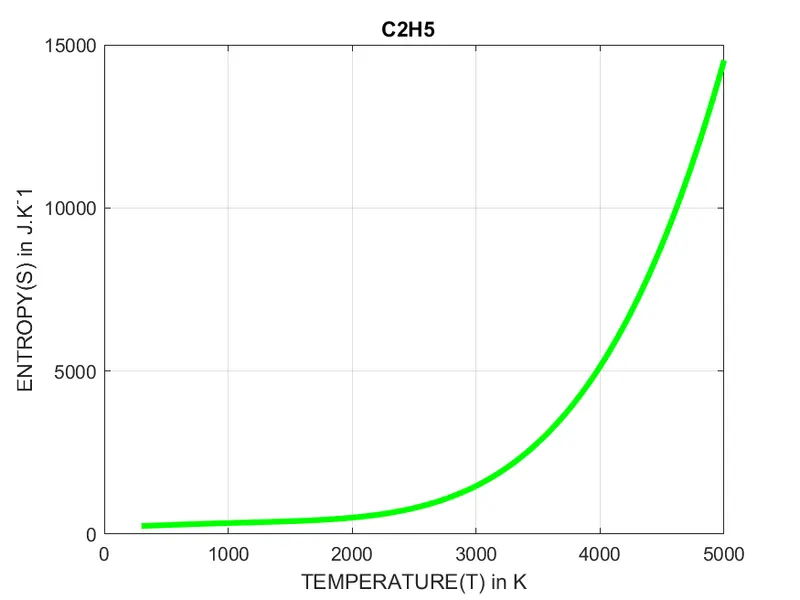
Temeprature vs Entropy Plot
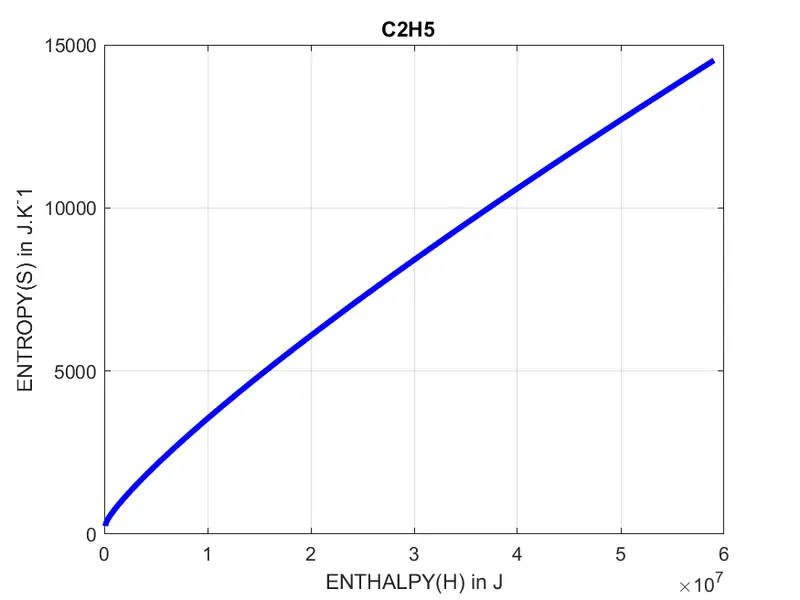
Enthalpy vs Entropy Plot
Following are the plots for 'C2H6' species
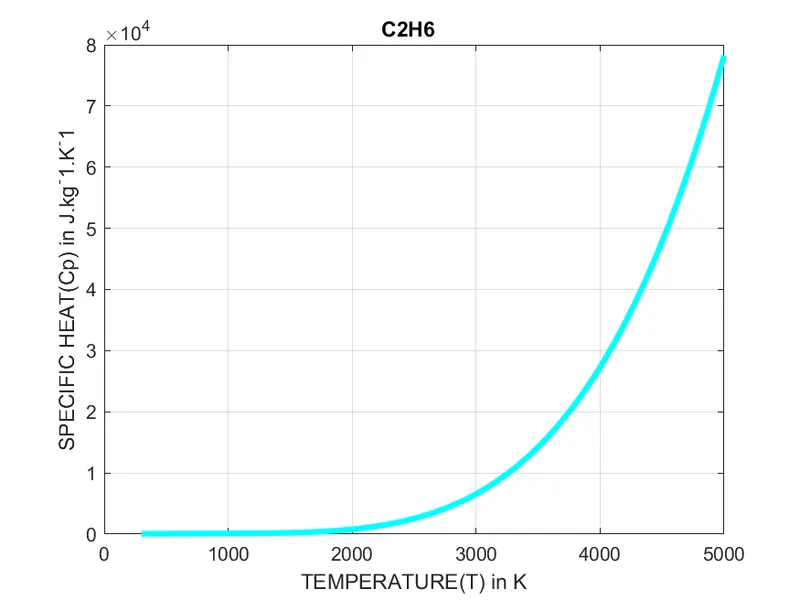
Temperature vs Specific Heat Plot
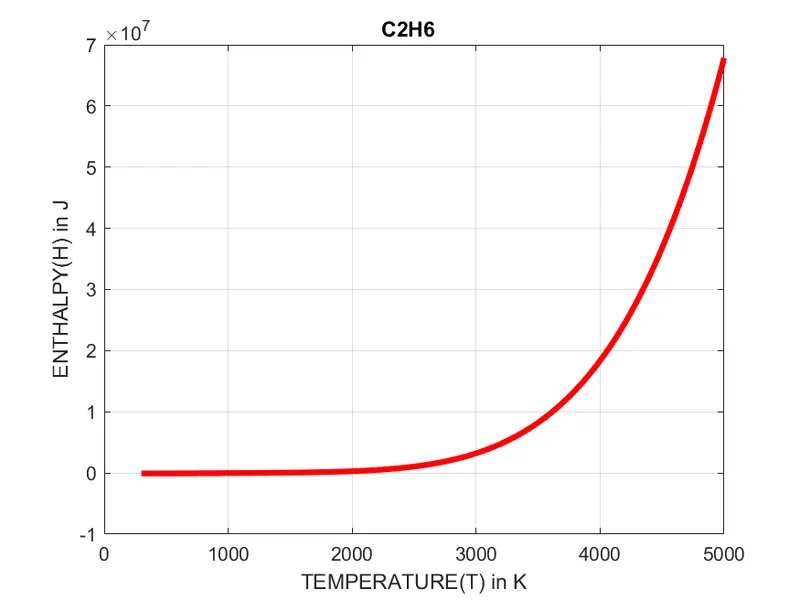
Temperature vs Enthalpy Plot
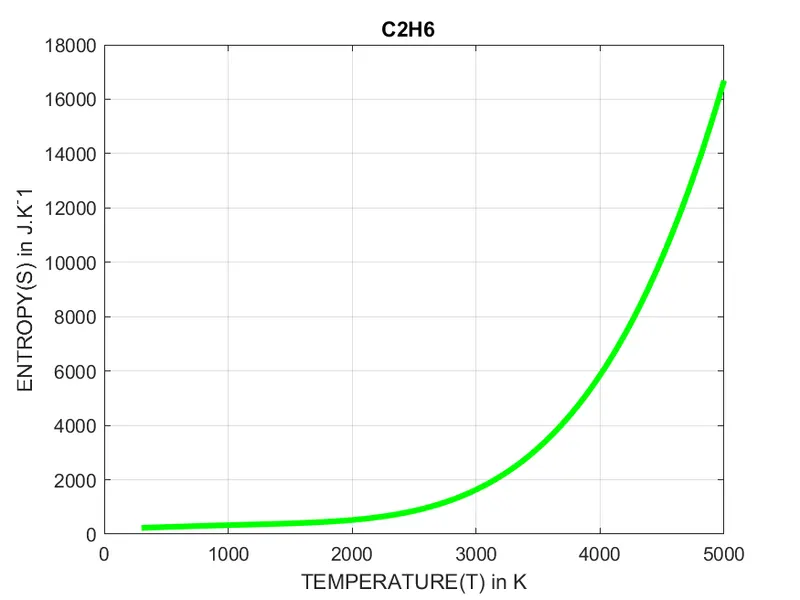
Temeprature vs Entropy Plot
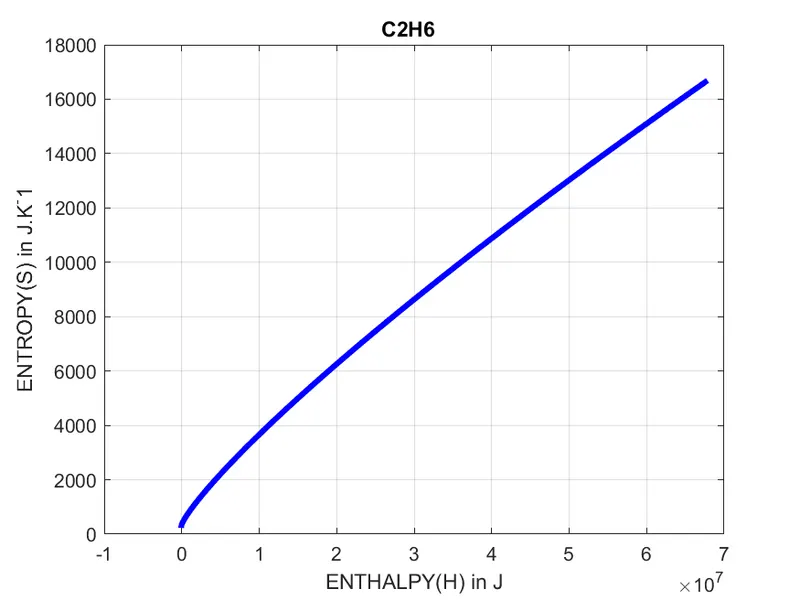
Enthalpy vs Entropy Plot
Following are the plots for 'CH2CO' species
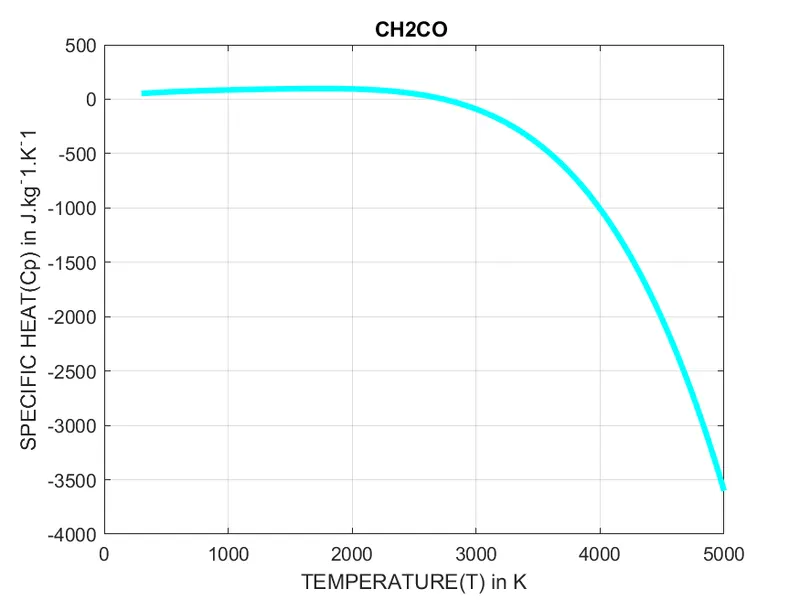
Temperature vs Specific Heat Plot
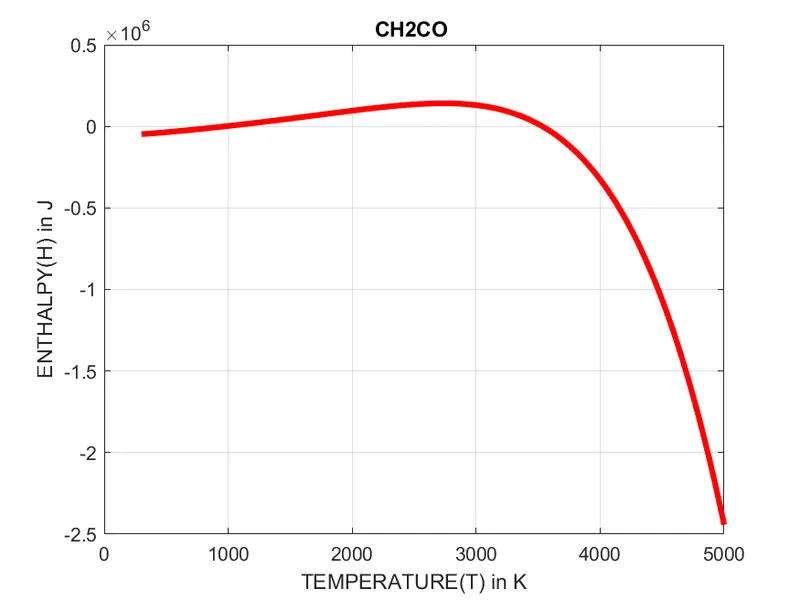
Temperature vs Enthalpy Plot
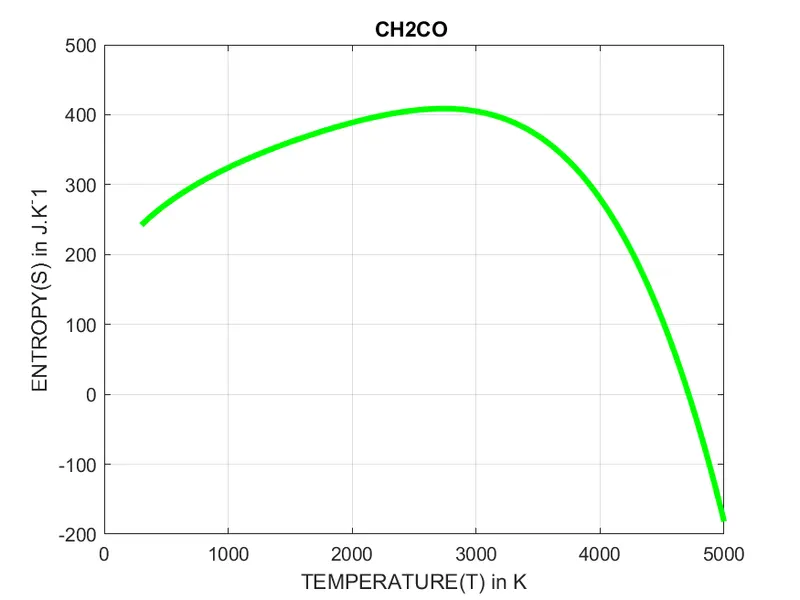
Temeprature vs Entropy Plot
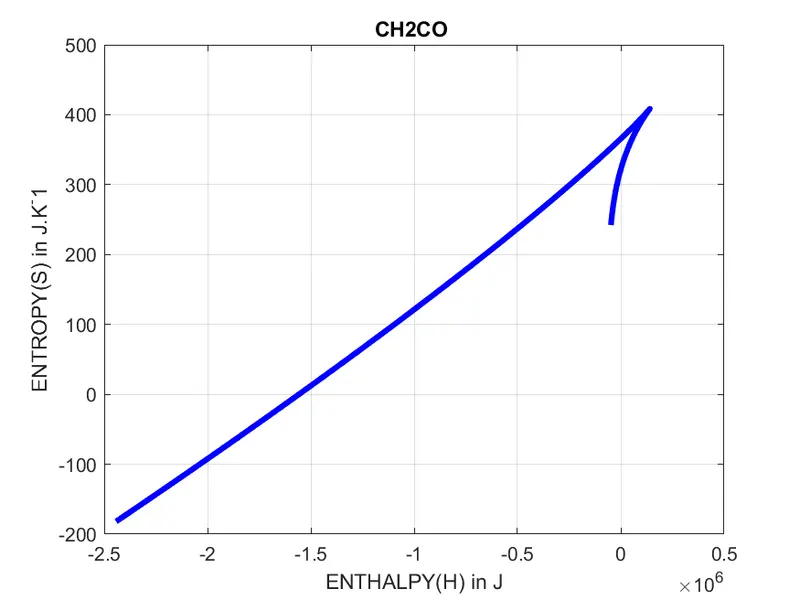
Enthalpy vs Entropy Plot
Following are the plots for 'HCCO' species
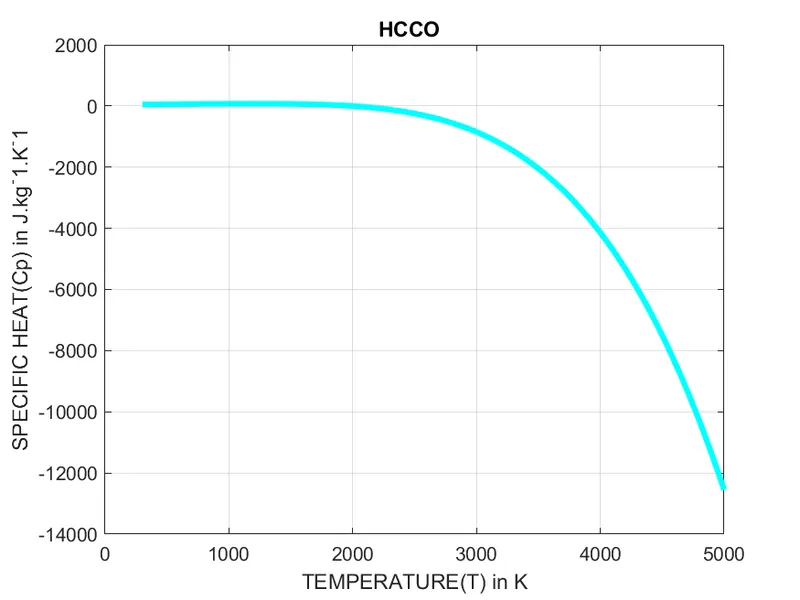
Temperature vs Specific Heat Plot
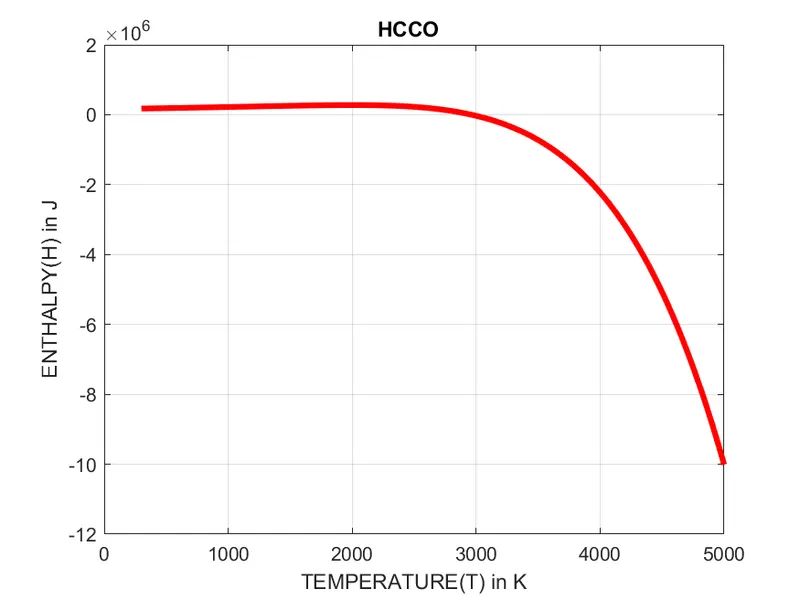
Temperature vs Enthalpy Plot
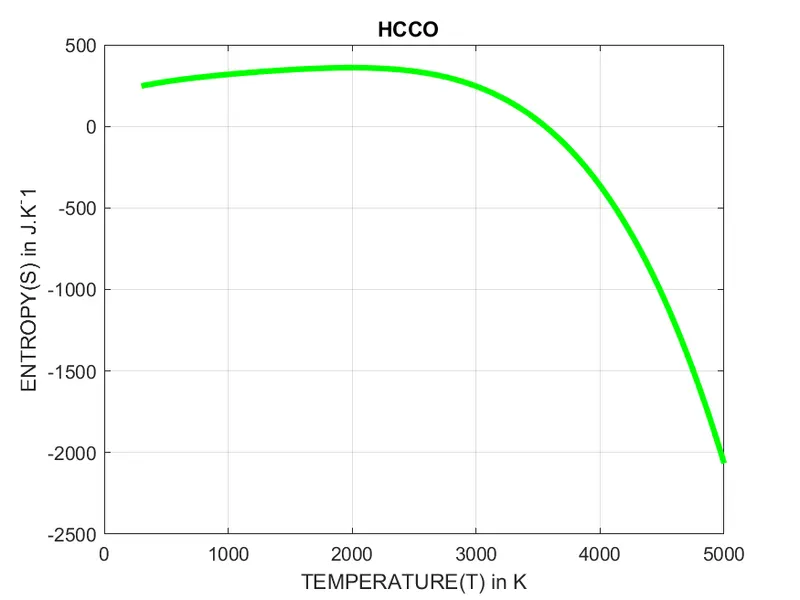
Temeprature vs Entropy Plot
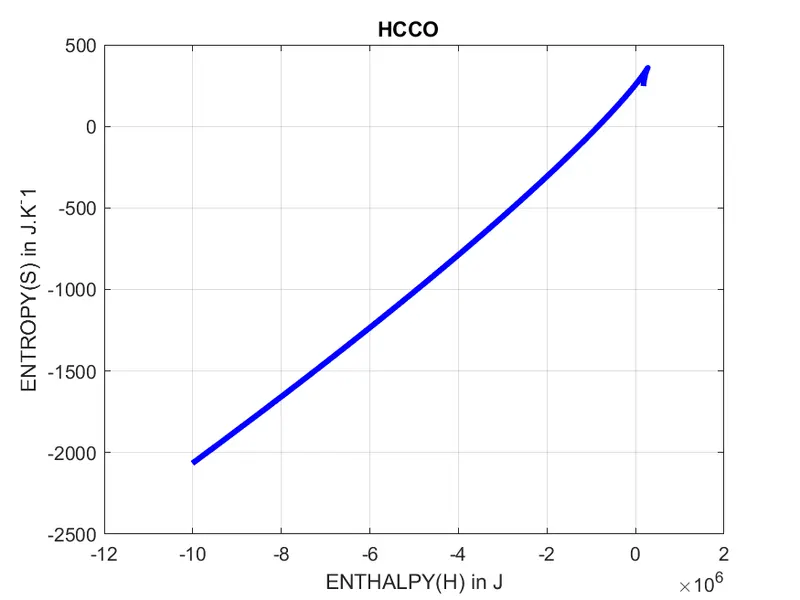
Enthalpy vs Entropy Plot
Following are the plots for 'HCCOH' species
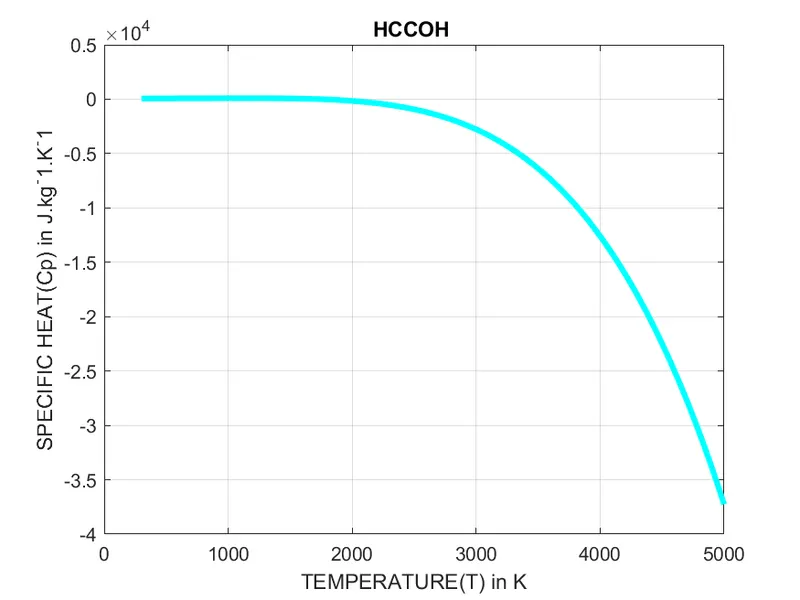
Temperature vs Specific Heat Plot
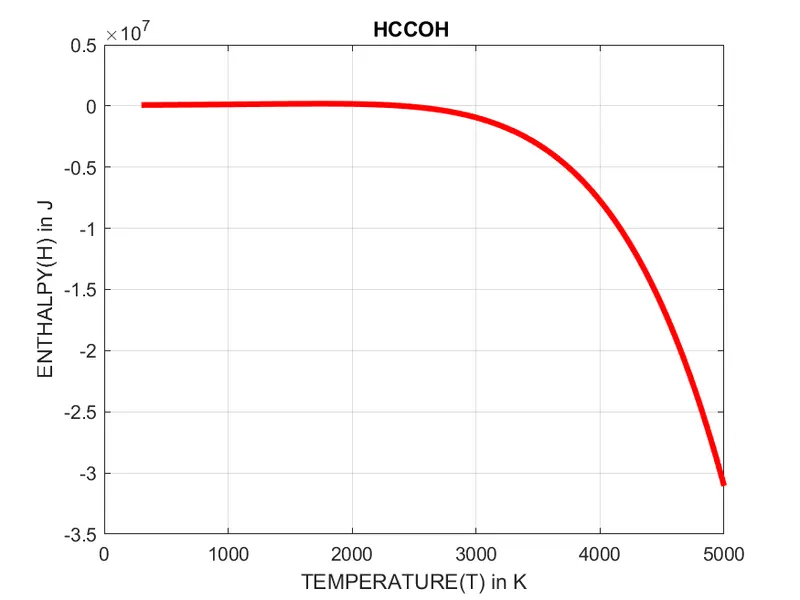
Temperature vs Enthalpy Plot
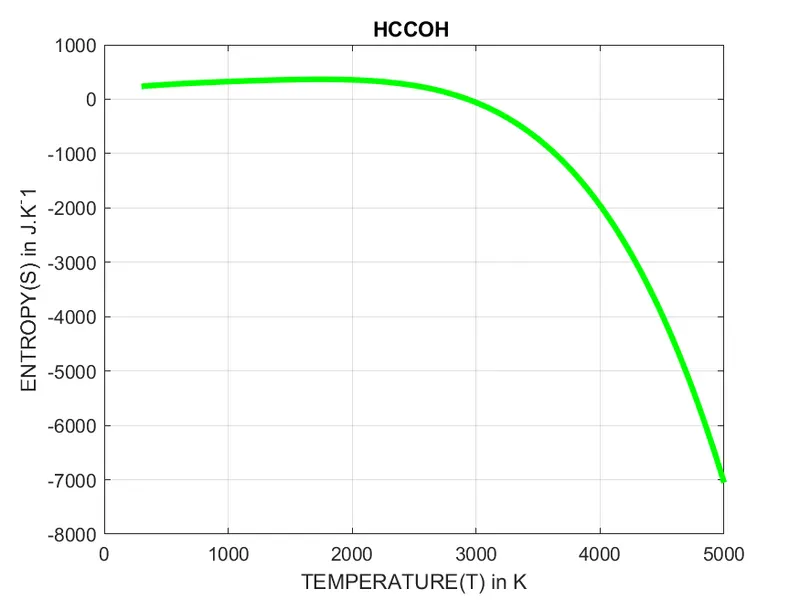
Temeprature vs Entropy Plot
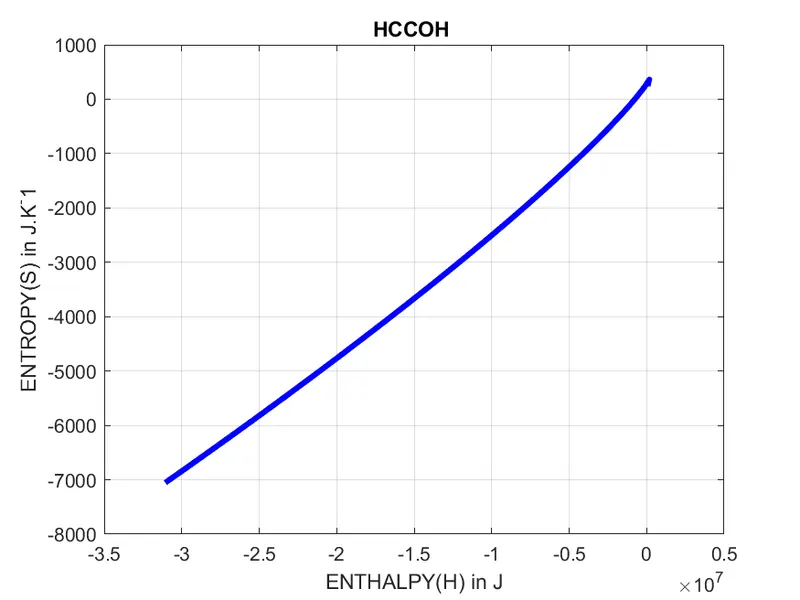
Enthalpy vs Entropy Plot
Following are the plots for 'H2CN' species
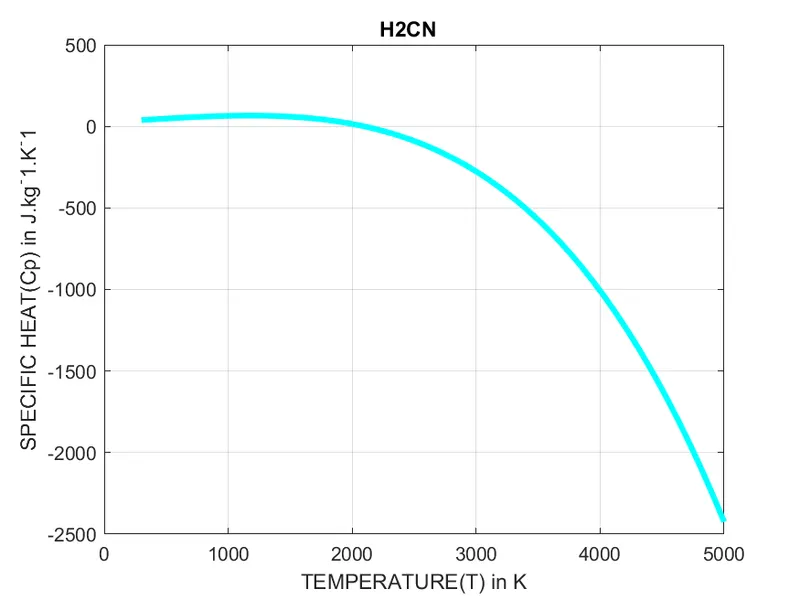
Temperature vs Specific Heat Plot
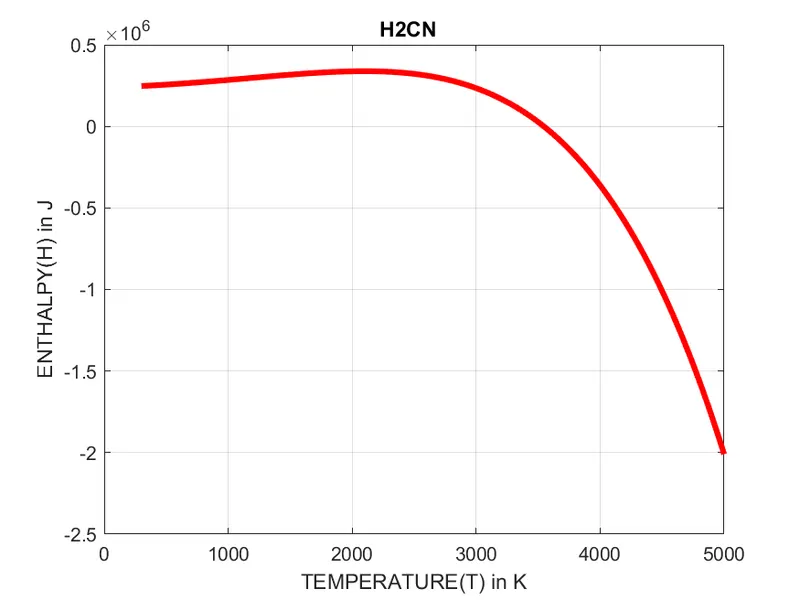
Temperature vs Enthalpy Plot
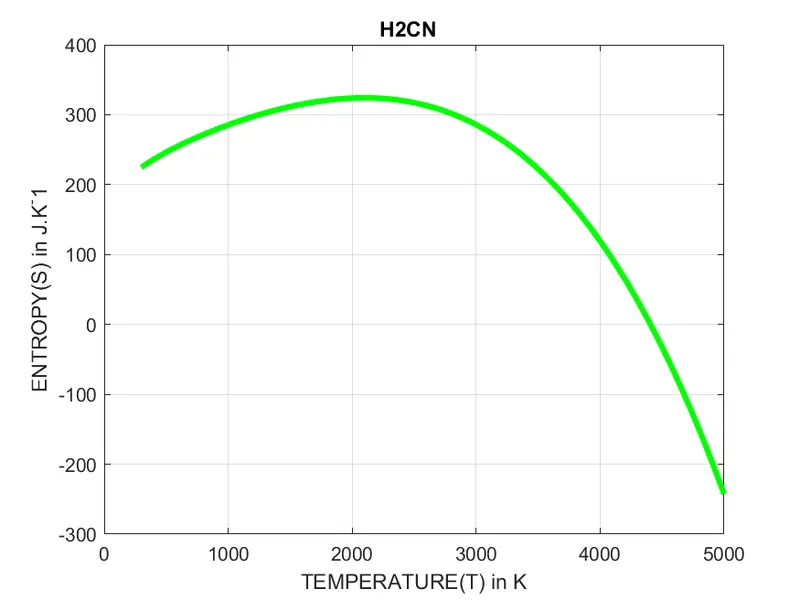
Temeprature vs Entropy Plot
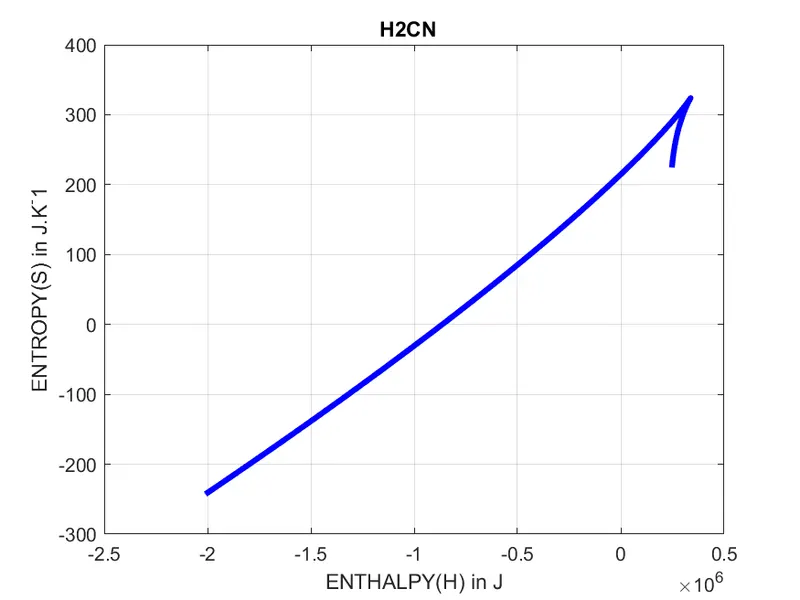
Enthalpy vs Entropy Plot
Following are the plots for 'HCN' species
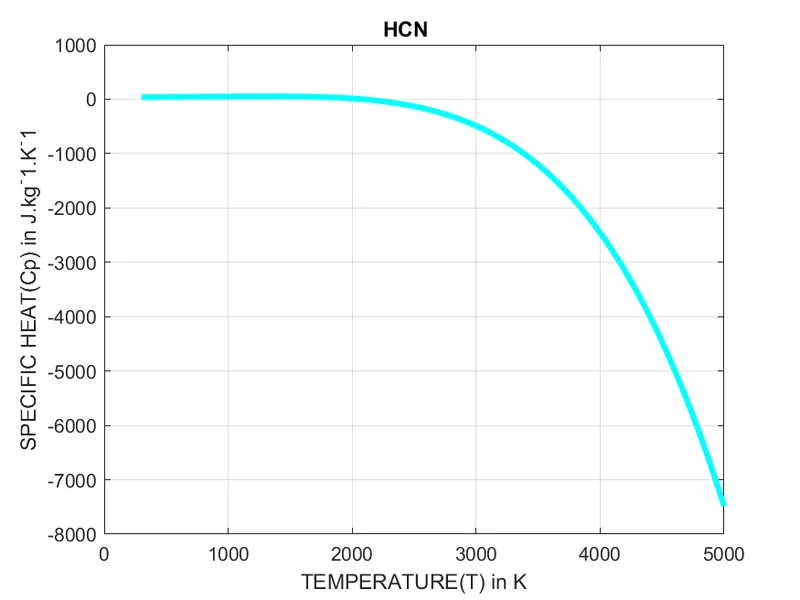
Temperature vs Specific Heat Plot
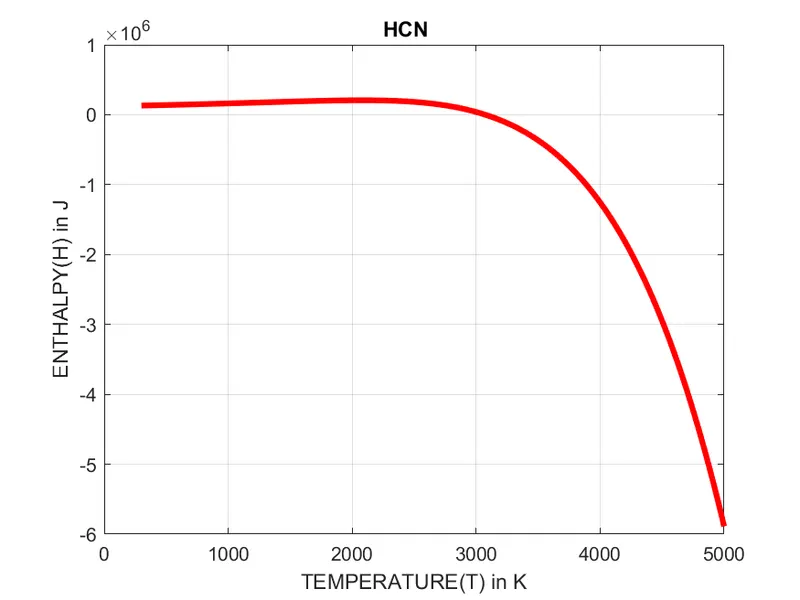
Temperature vs Enthalpy Plot
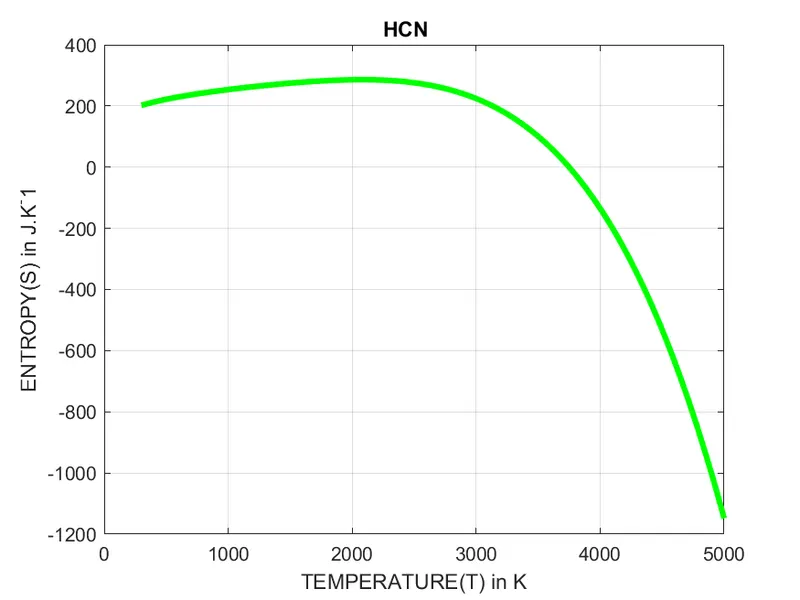
Temeprature vs Entropy Plot
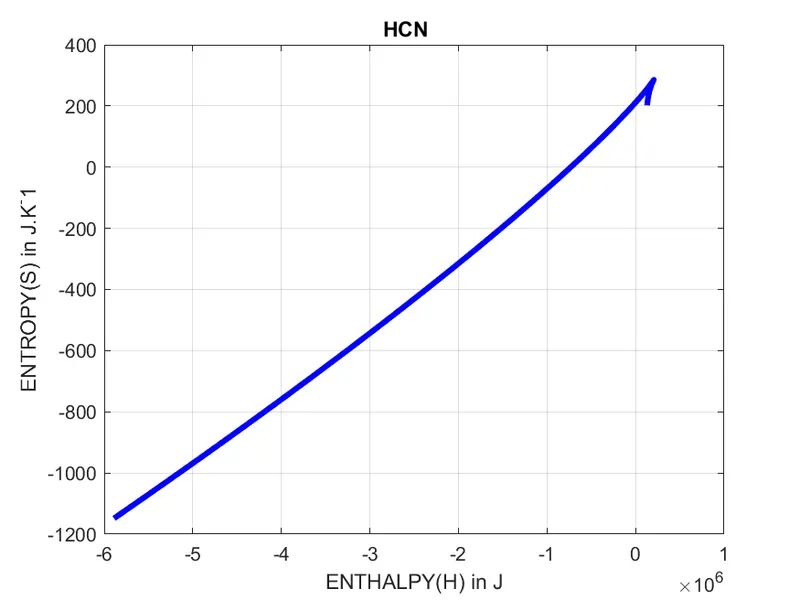
Enthalpy vs Entropy Plot
Following are the plots for 'HNO' species
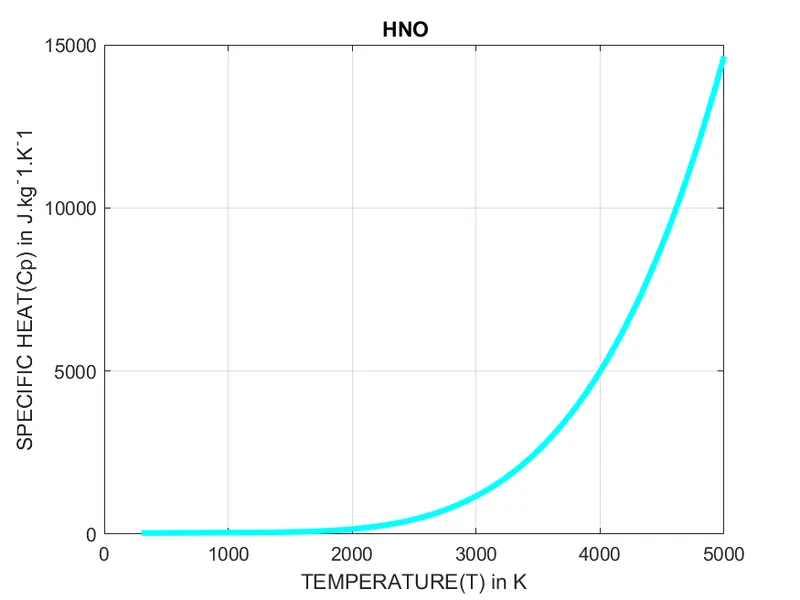
Temperature vs Specific Heat Plot
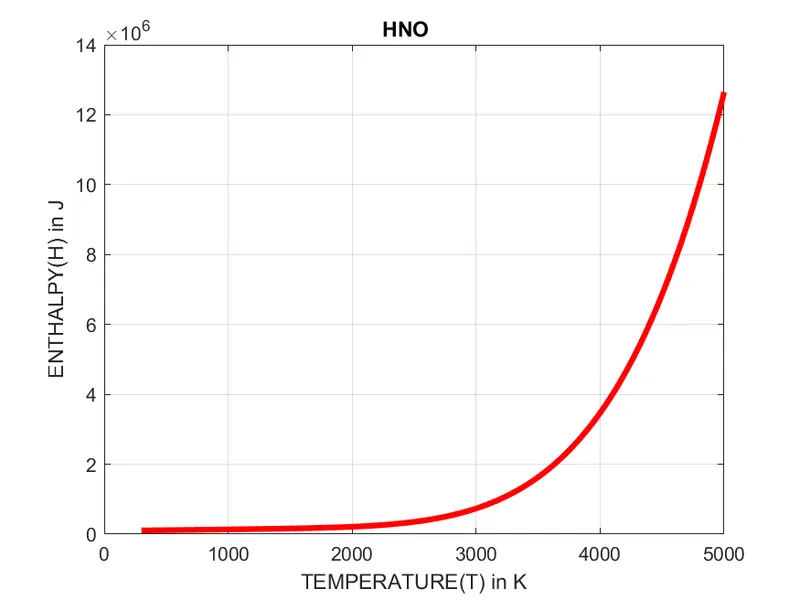
Temperature vs Enthalpy Plot
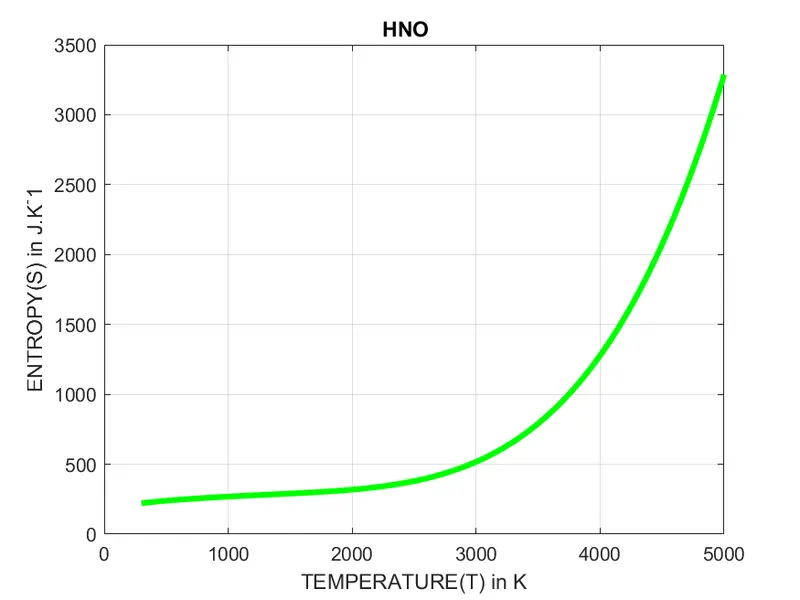
Temeprature vs Entropy Plot
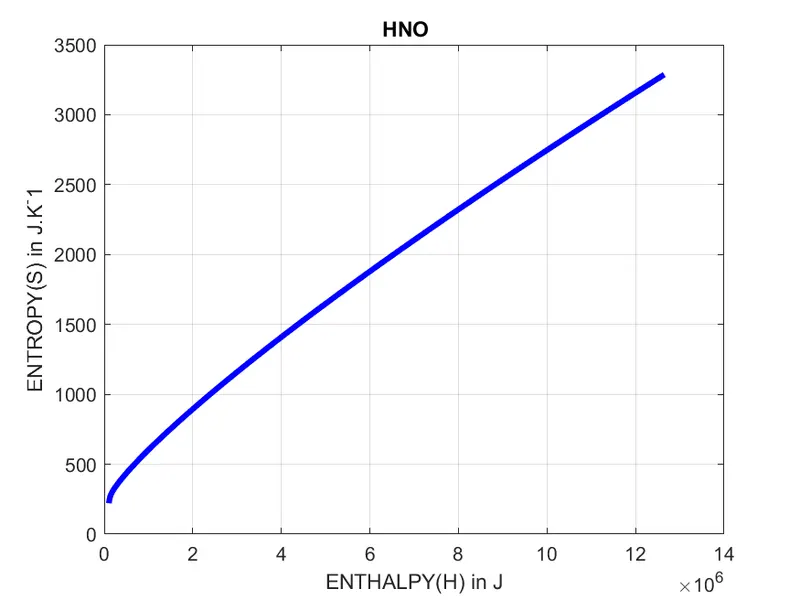
Enthalpy vs Entropy Plot
Following are the plots for 'N' species
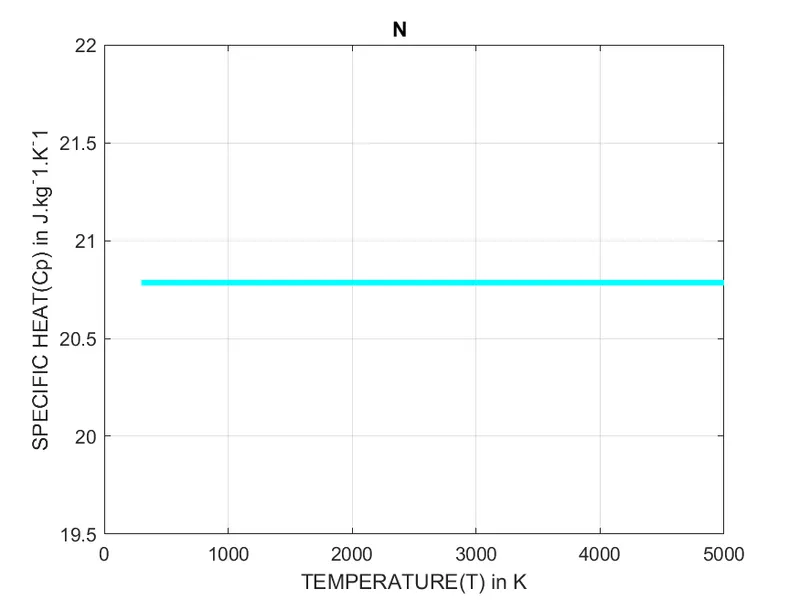
Temperature vs Specific Heat Plot
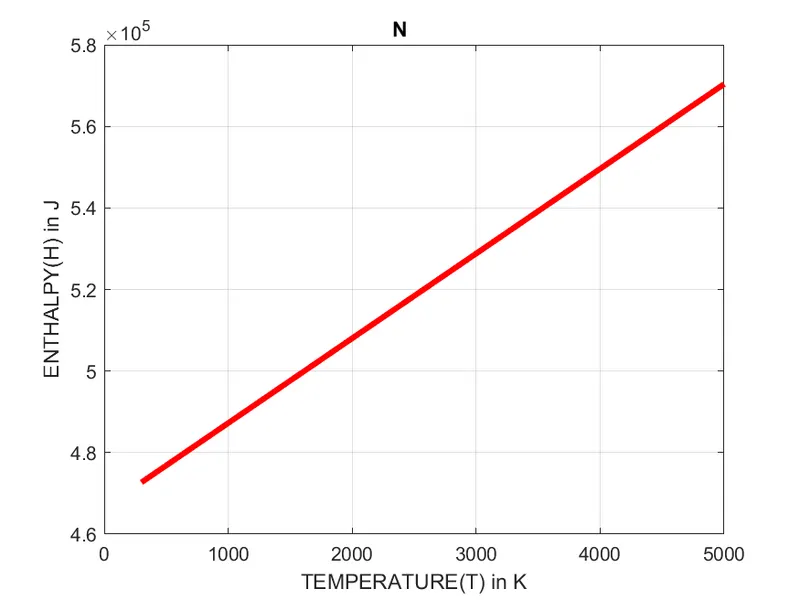
Temperature vs Enthalpy Plot
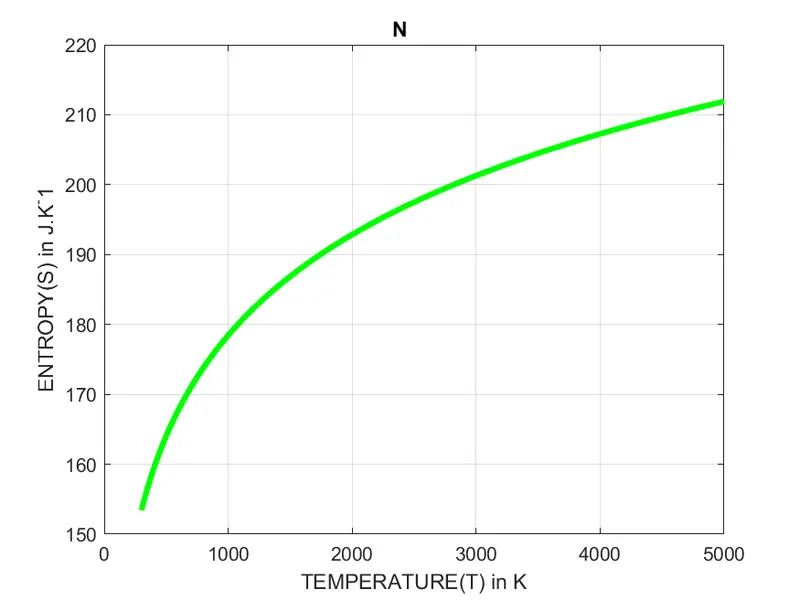
Temeprature vs Entropy Plot
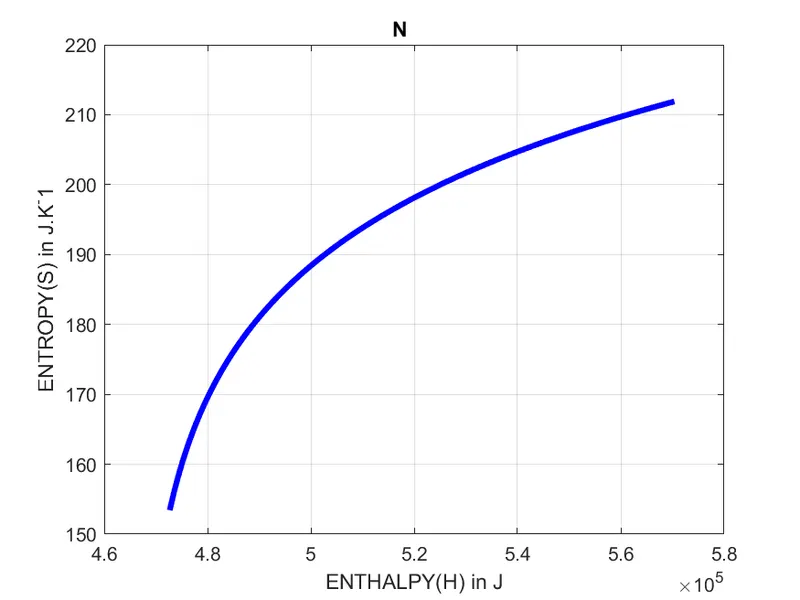
Enthalpy vs Entropy Plot
Following are the plots for 'NNH' species
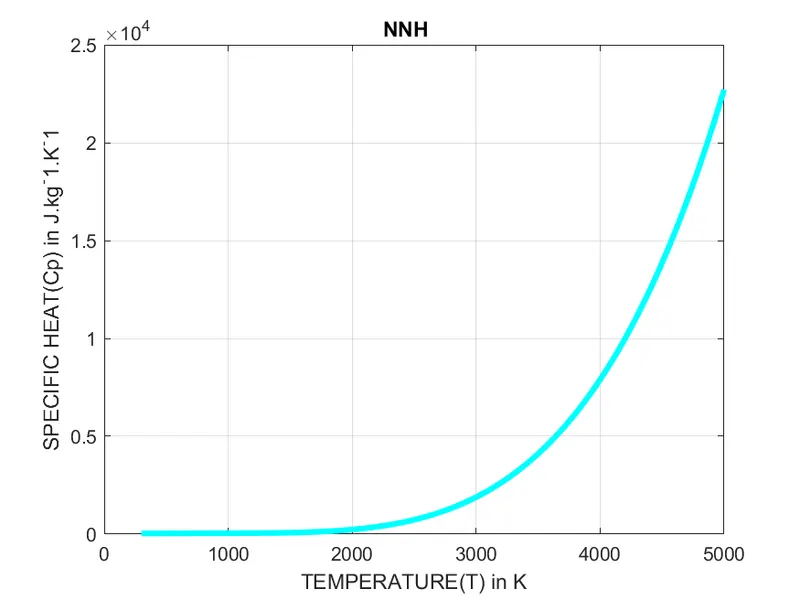
Temperature vs Specific Heat Plot
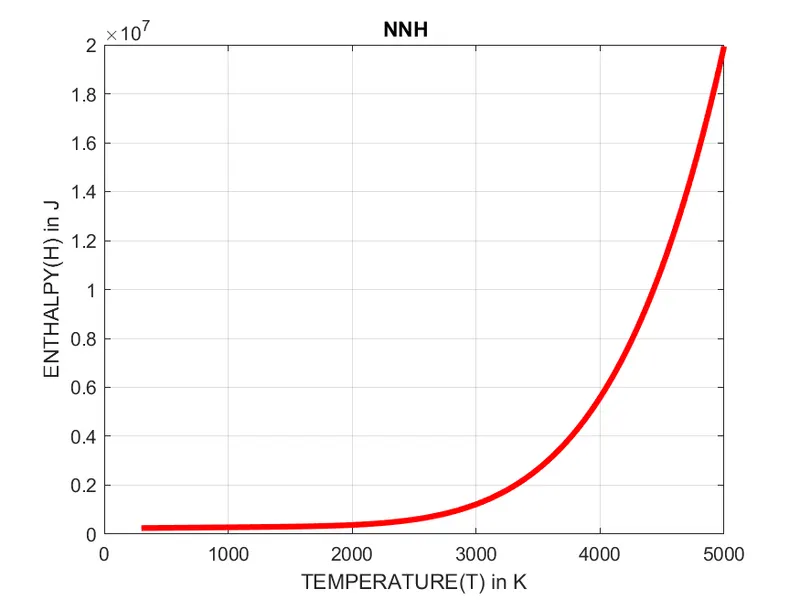
Temperature vs Enthalpy Plot
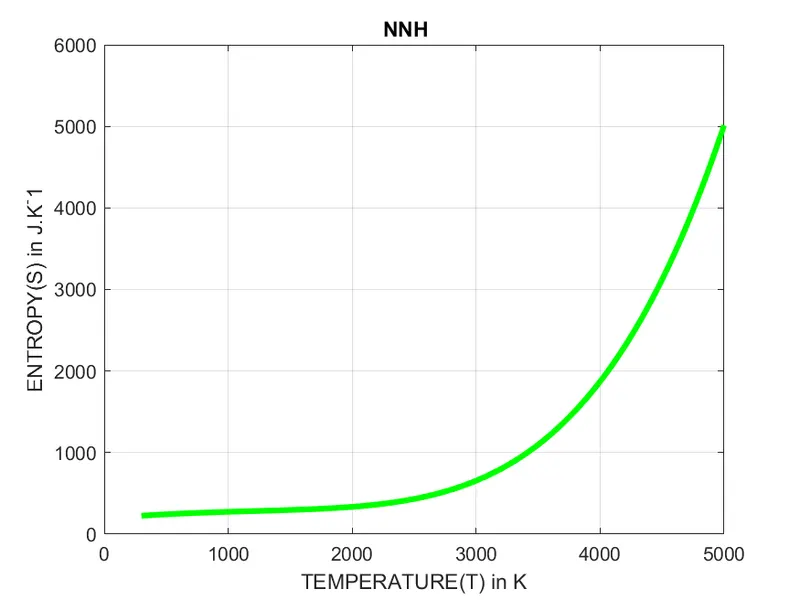
Temeprature vs Entropy Plot
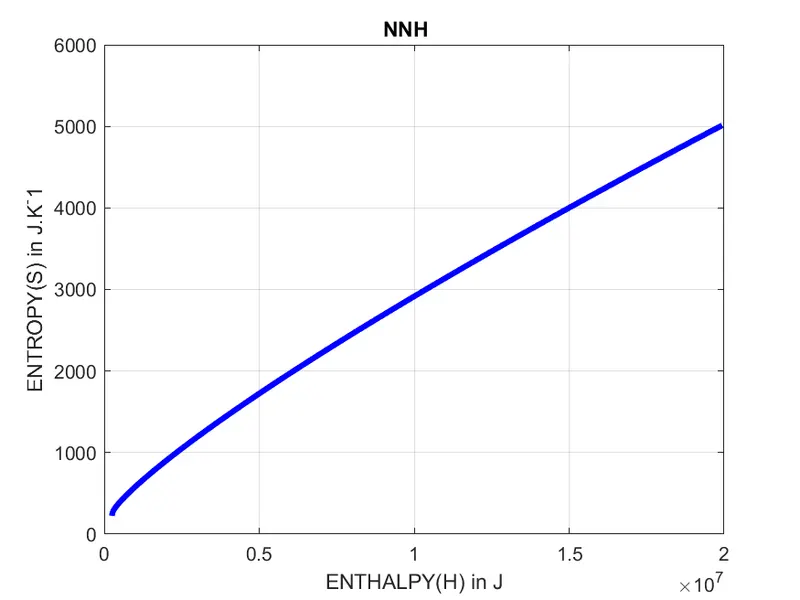
Enthalpy vs Entropy Plot
Following are the plots for 'N2O' species
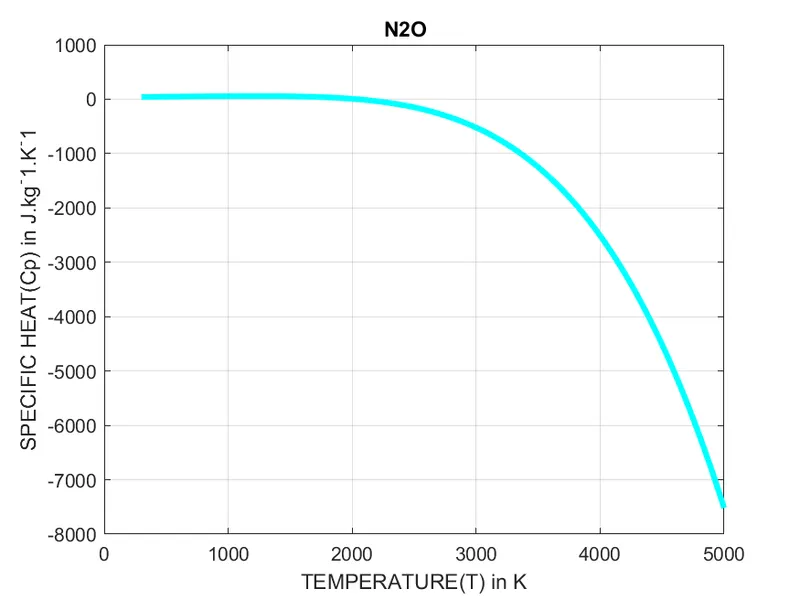
Temperature vs Specific Heat Plot
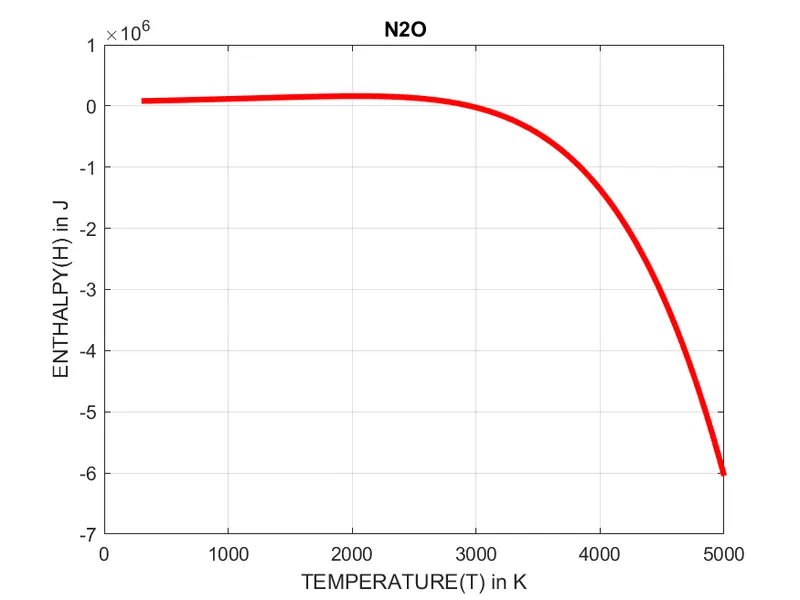
Temperature vs Enthalpy Plot
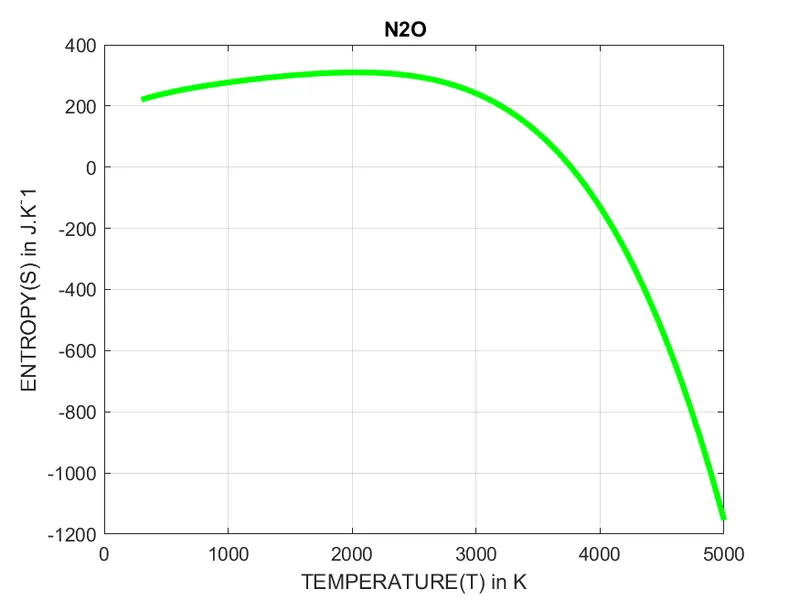
Temeprature vs Entropy Plot
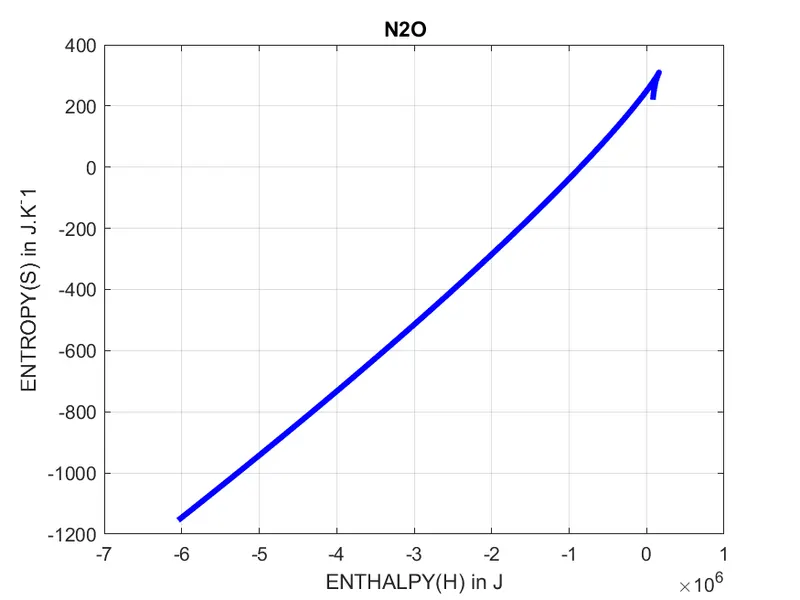
Enthalpy vs Entropy Plot
Following are the plots for 'NH' species
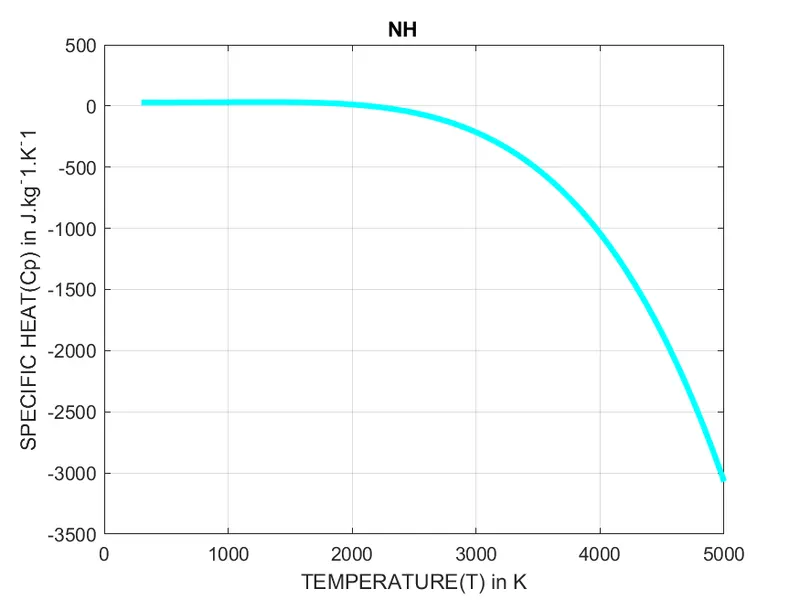
Temperature vs Specific Heat Plot
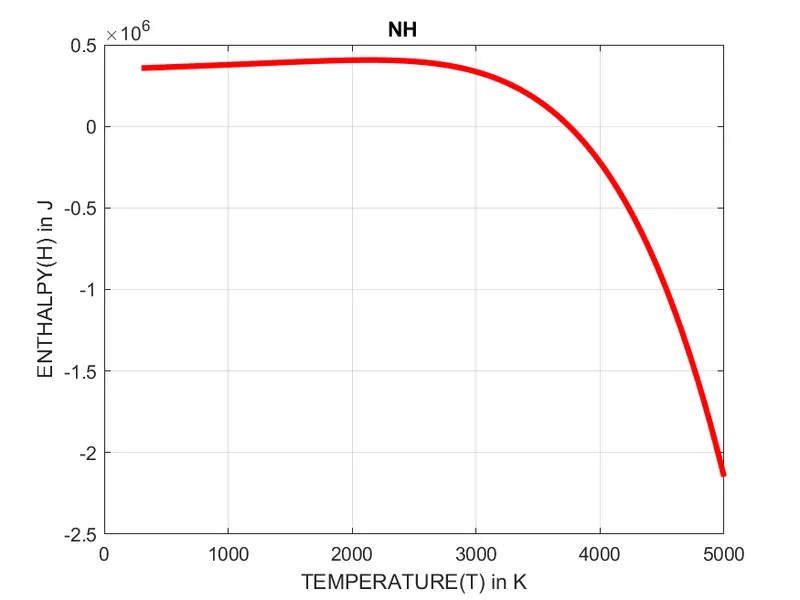
Temperature vs Enthalpy Plot
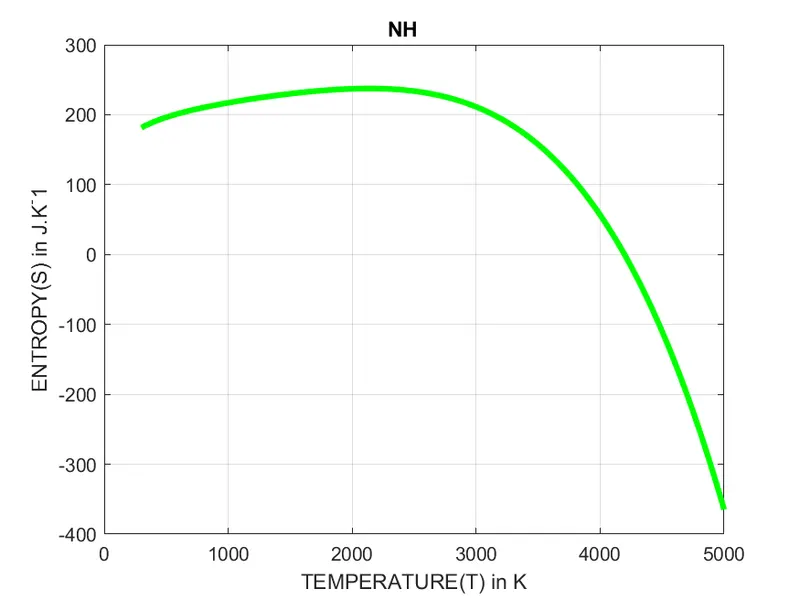
Temeprature vs Entropy Plot
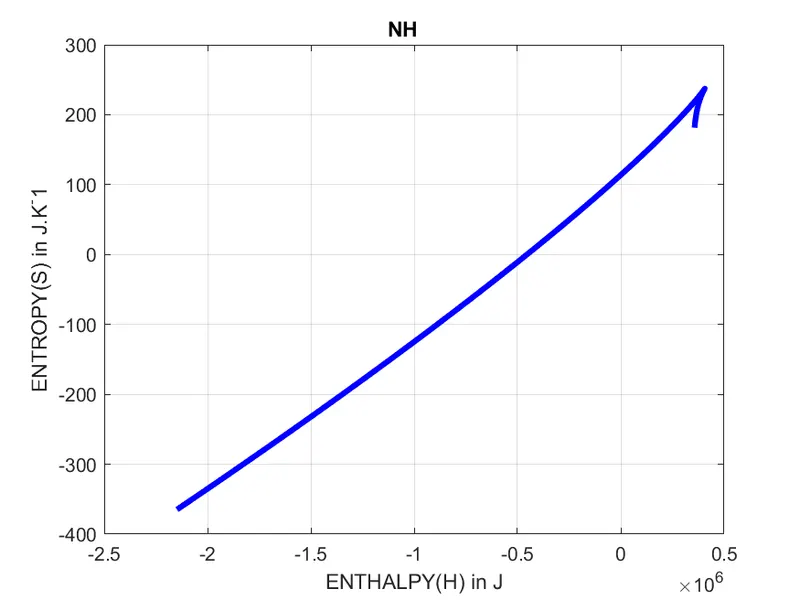
Enthalpy vs Entropy Plot
Following are the plots for 'NH2' species
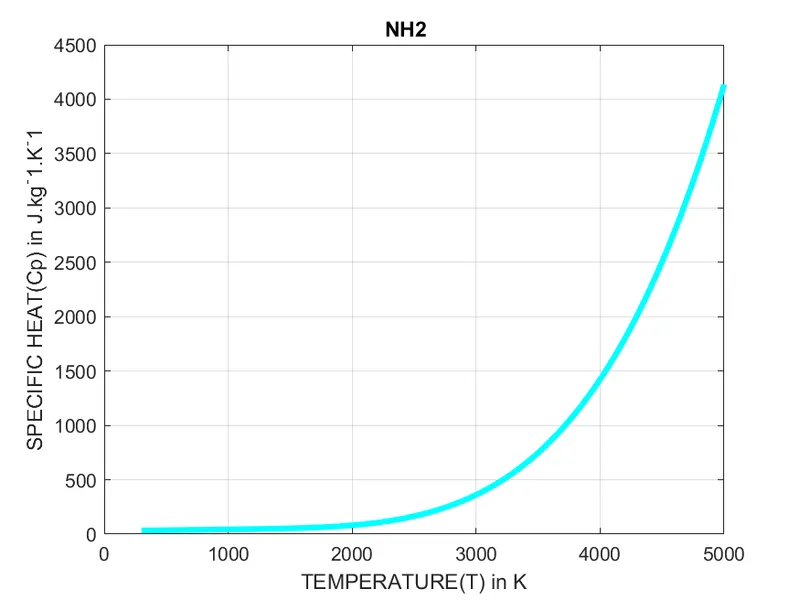
Temperature vs Specific Heat Plot
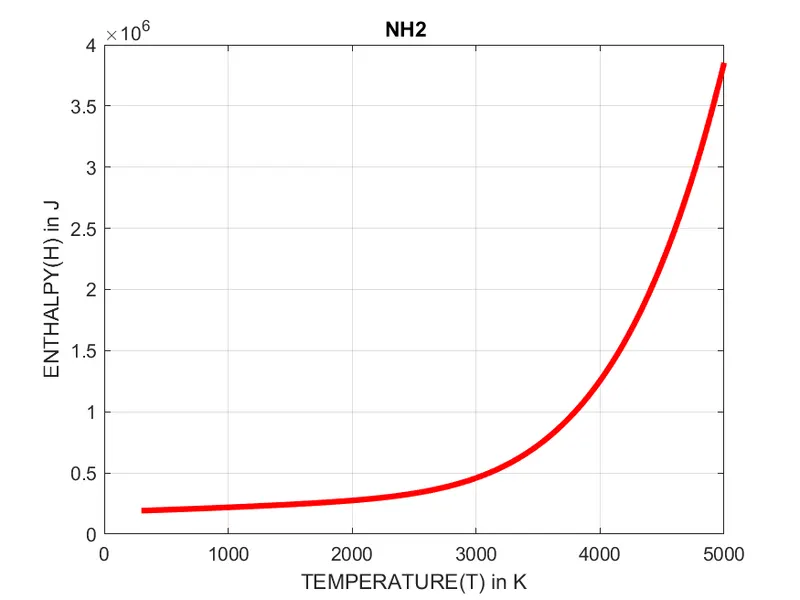
Temperature vs Enthalpy Plot
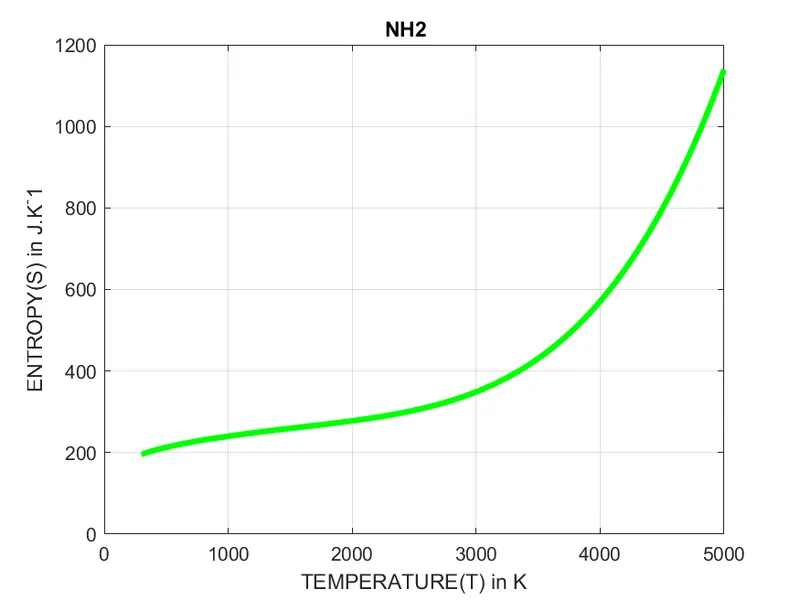
Temeprature vs Entropy Plot
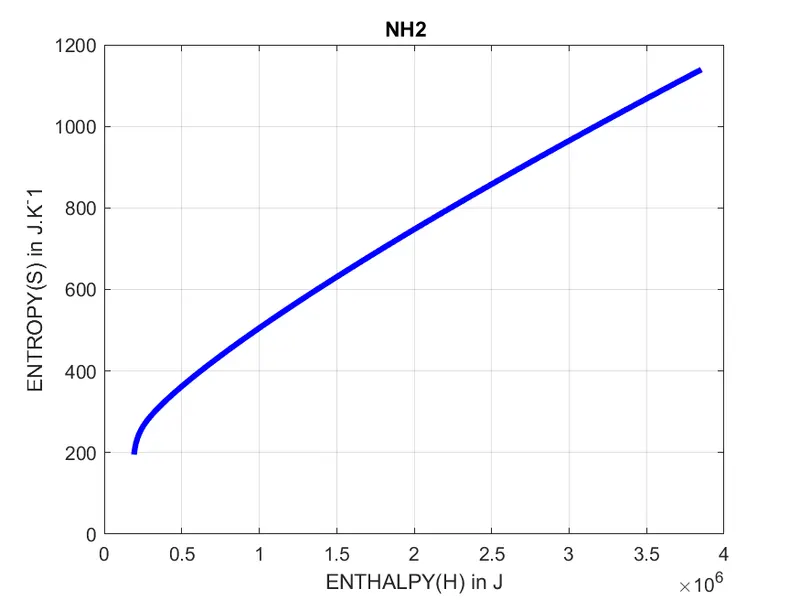
Enthalpy vs Entropy Plot
Following are the plots for 'NH3' species
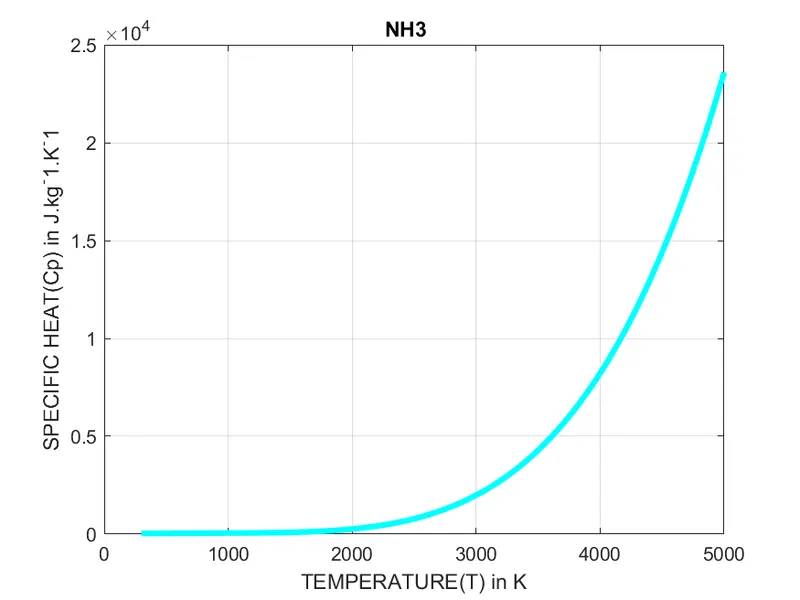
Temperature vs Specific Heat Plot
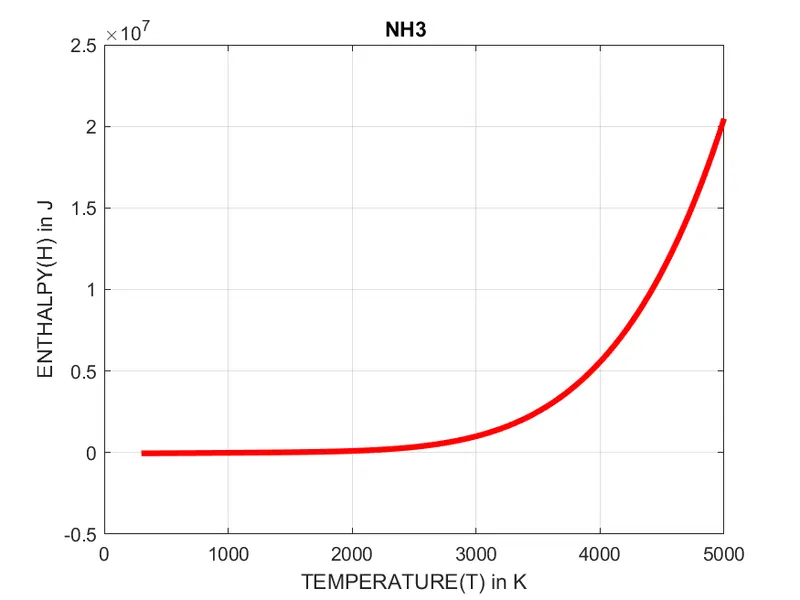
Temperature vs Enthalpy Plot
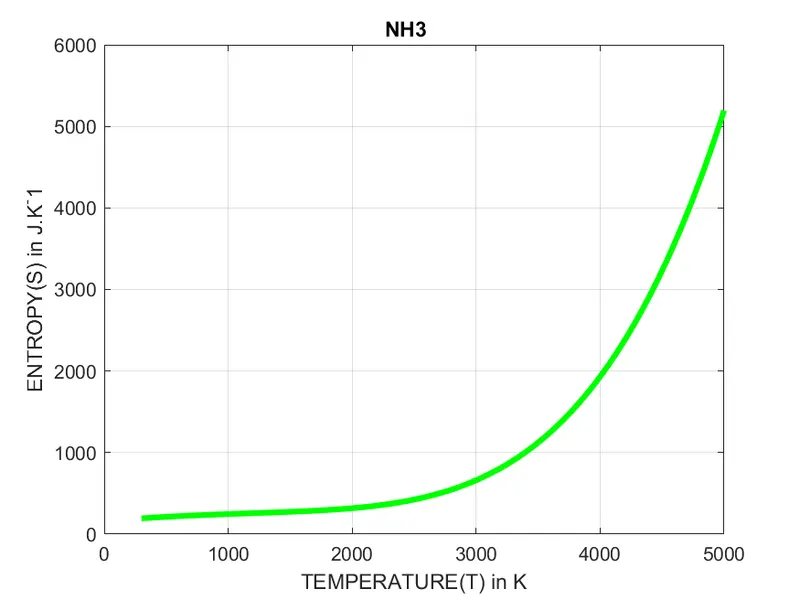
Temeprature vs Entropy Plot
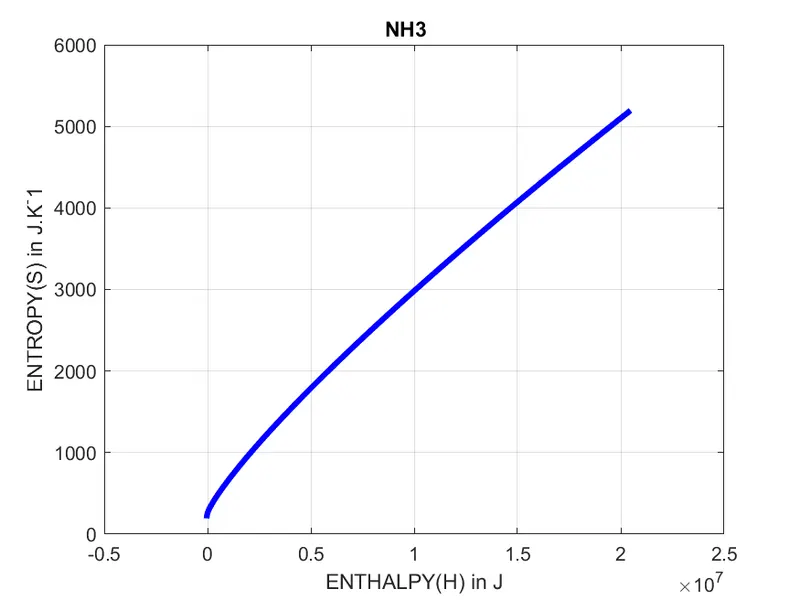
Enthalpy vs Entropy Plot
Following are the plots for 'NO' species
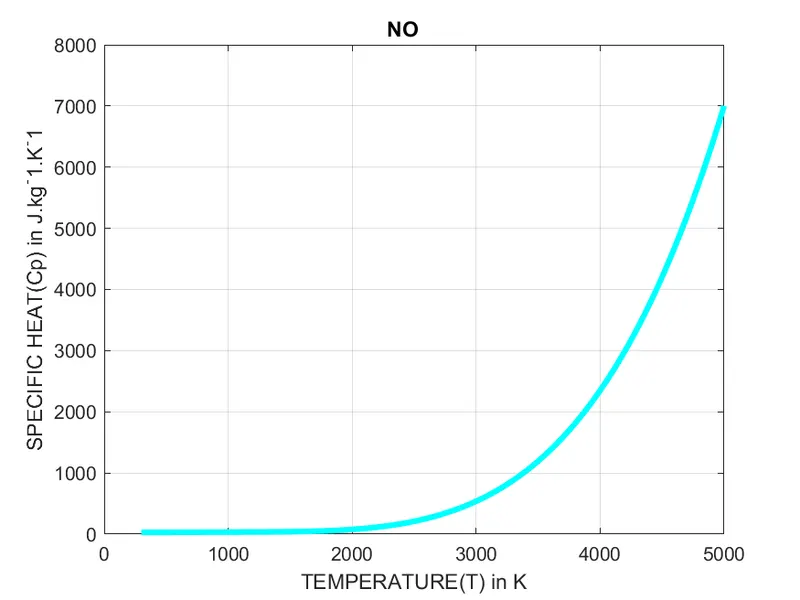
Temperature vs Specific Heat Plot
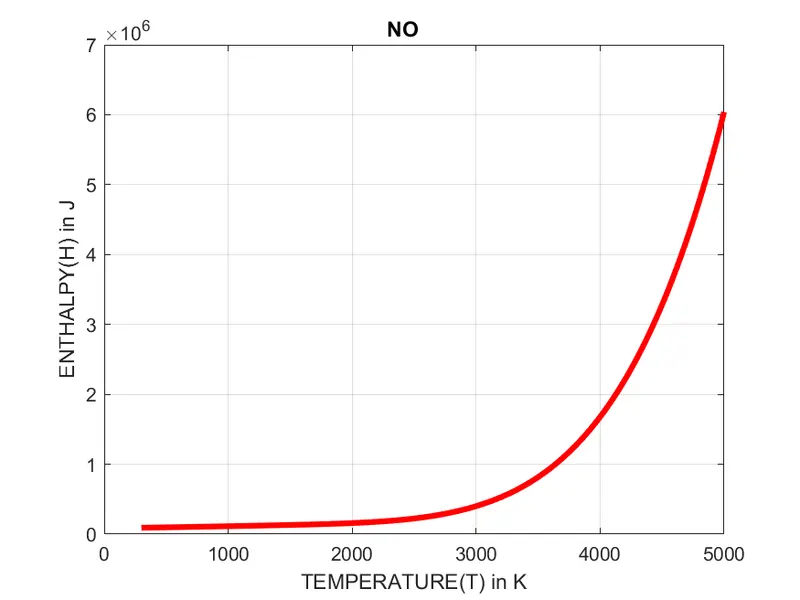
Temperature vs Enthalpy Plot
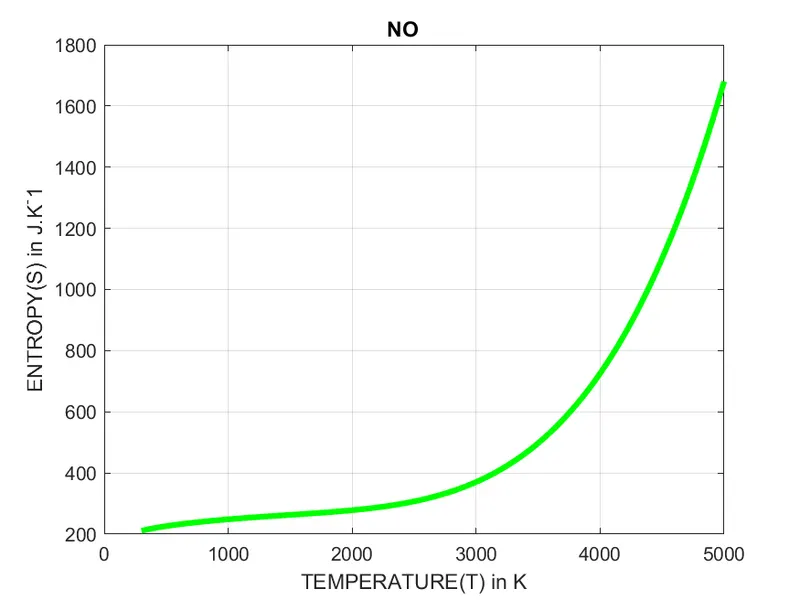
Temeprature vs Entropy Plot
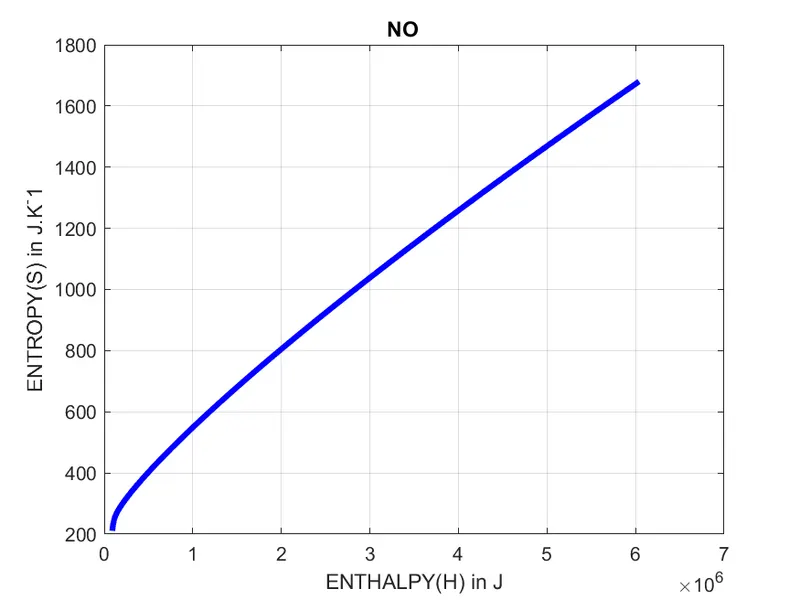
Enthalpy vs Entropy Plot
Following are the plots for 'NO2' species
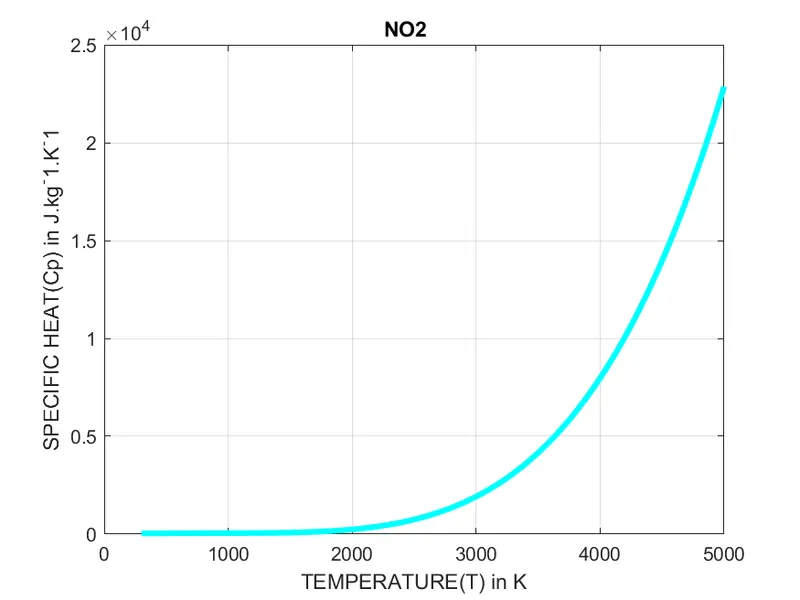
Temperature vs Specific Heat Plot
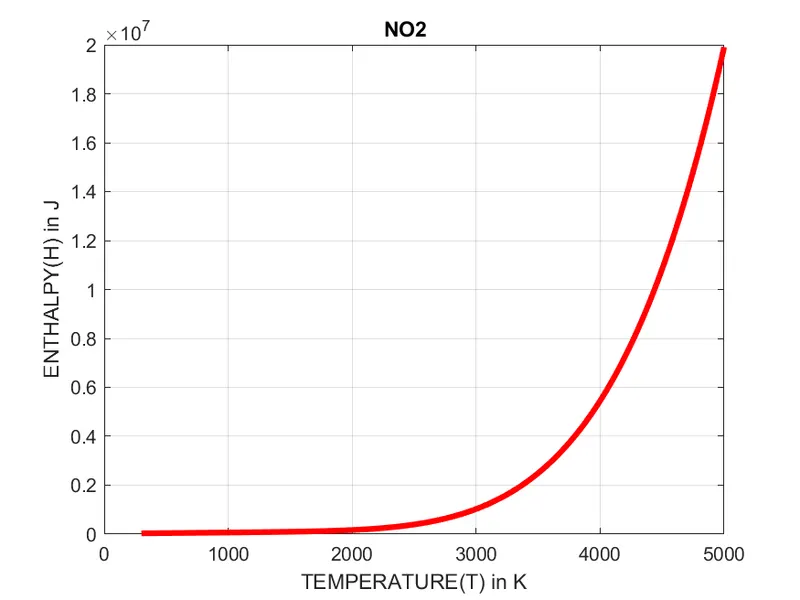
Temperature vs Enthalpy Plot
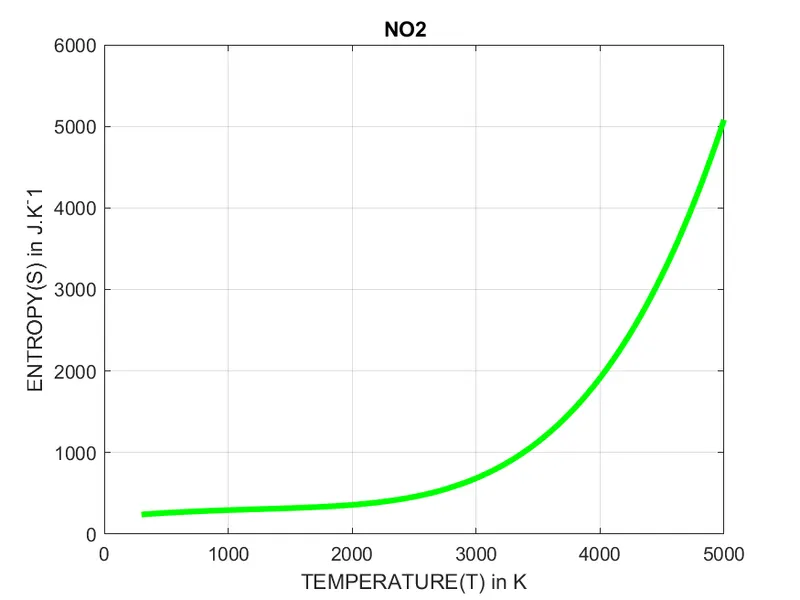
Temeprature vs Entropy Plot
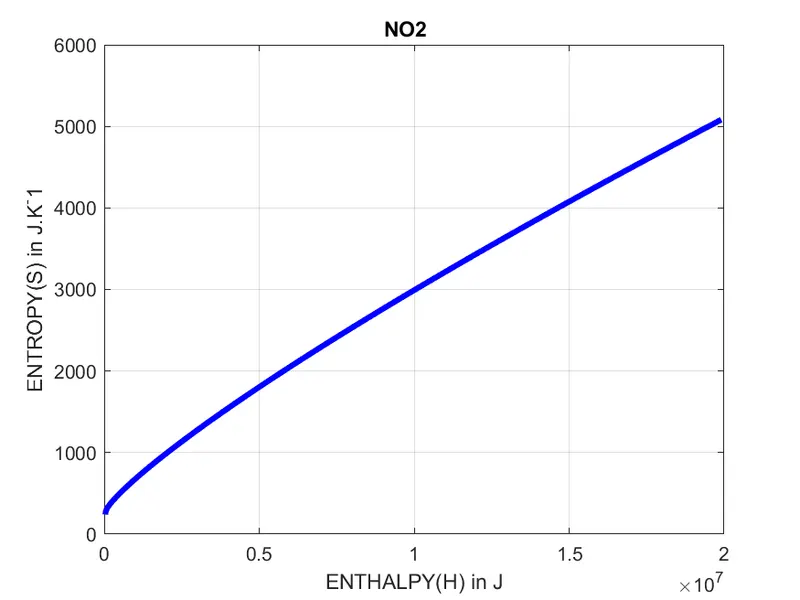
Enthalpy vs Entropy Plot
Following are the plots for 'HCNO' species
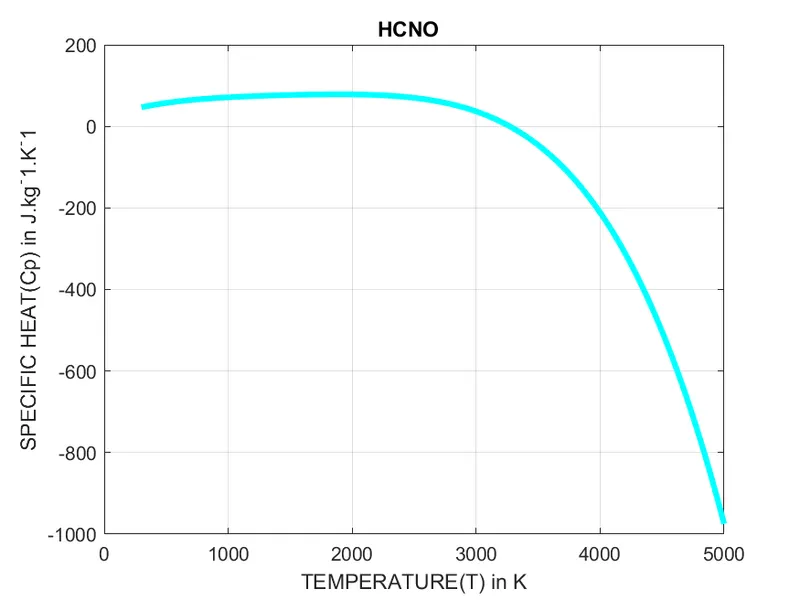
Temperature vs Specific Heat Plot
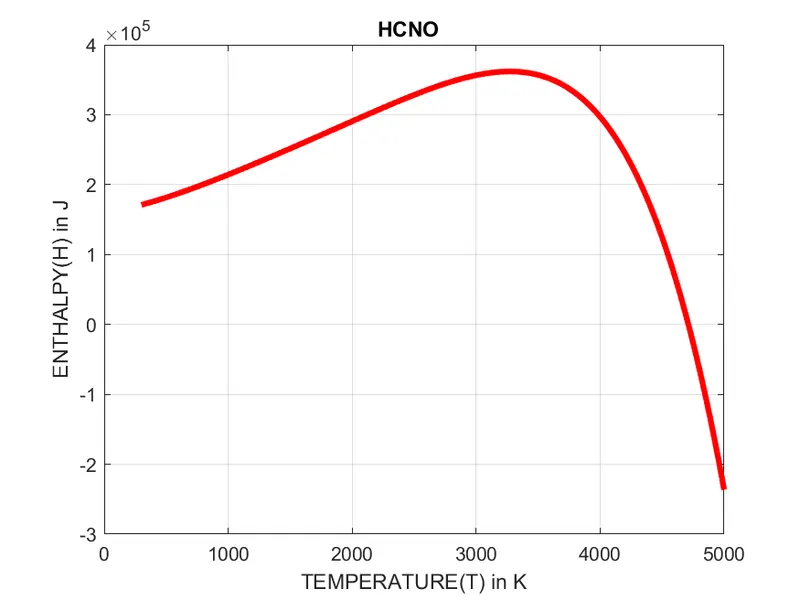
Temperature vs Enthalpy Plot
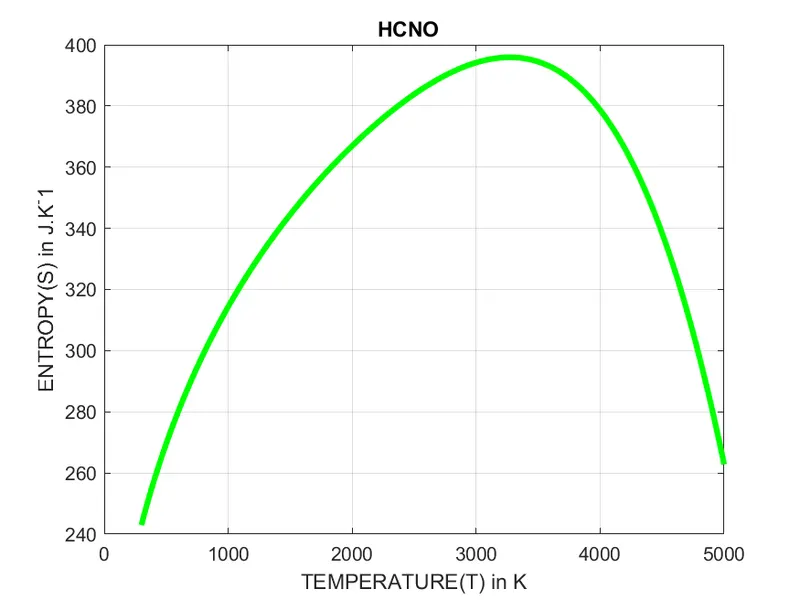
Temeprature vs Entropy Plot
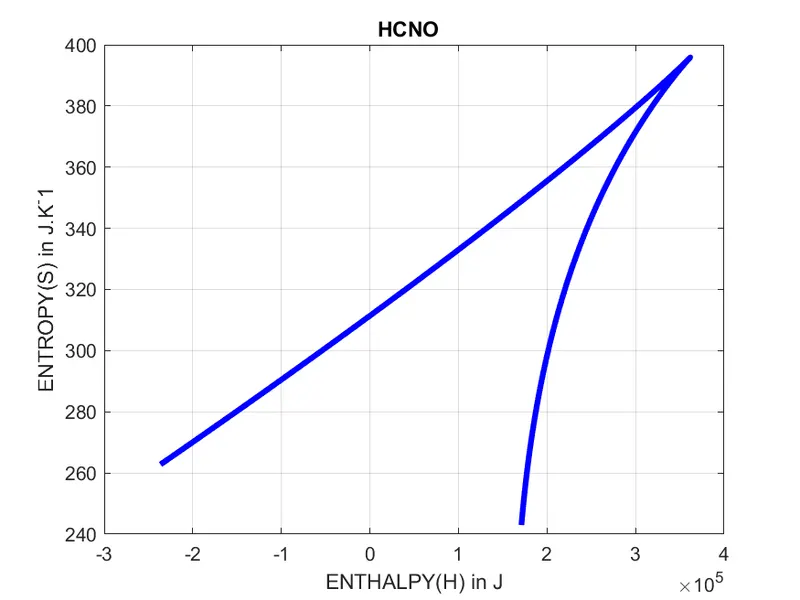
Enthalpy vs Entropy Plot
Following are the plots for 'HOCN' species
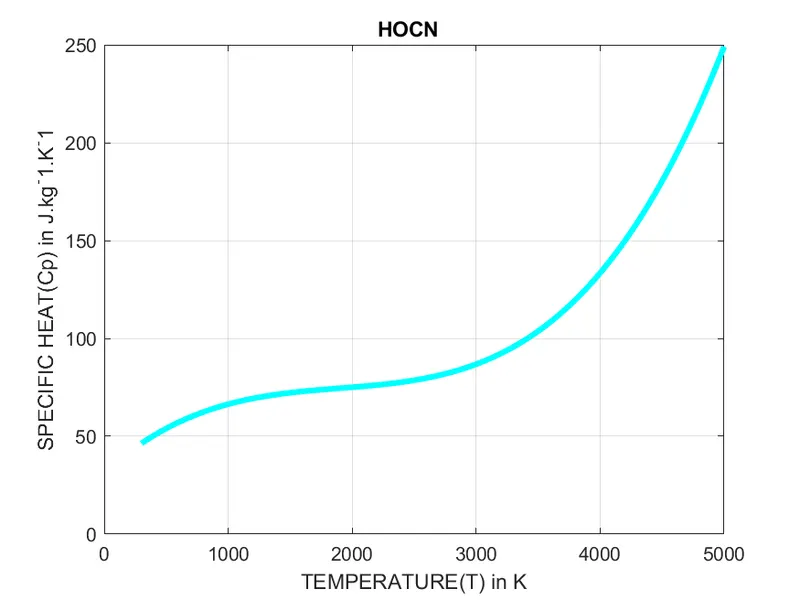
Temperature vs Specific Heat Plot
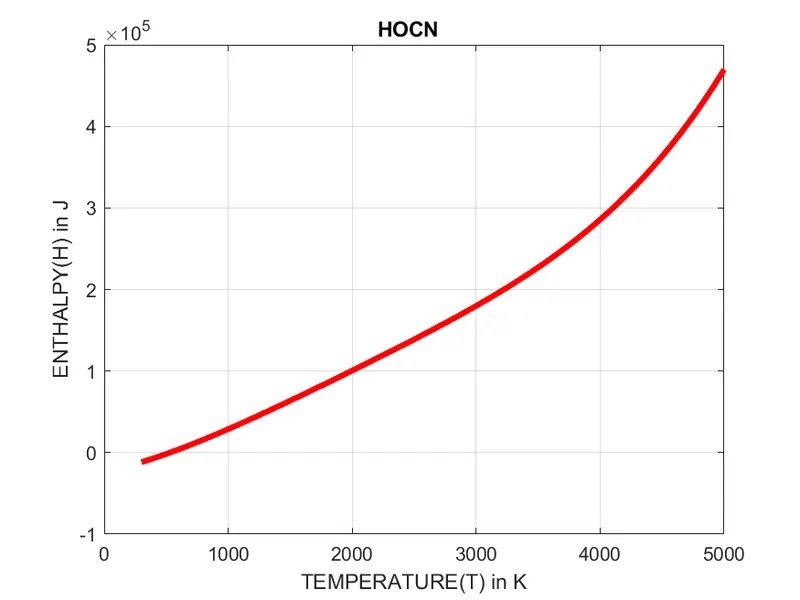
Temperature vs Enthalpy Plot
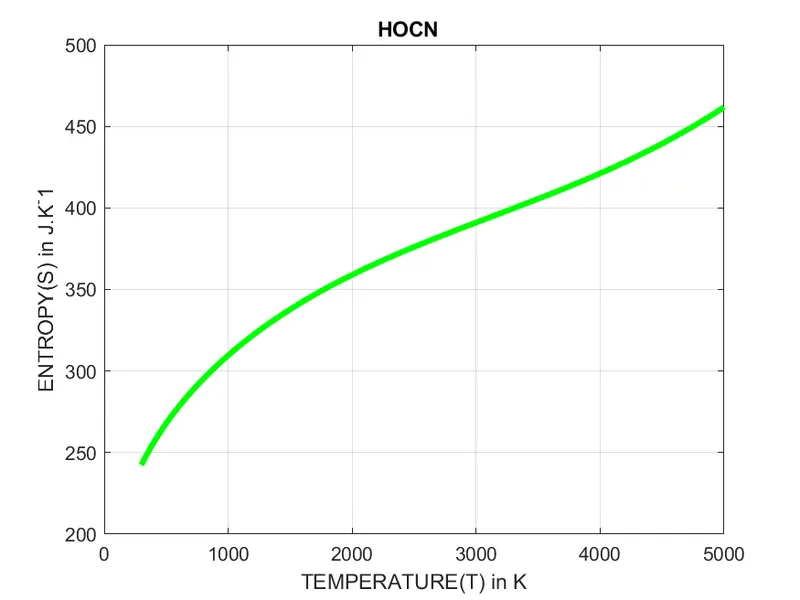
Temeprature vs Entropy Plot
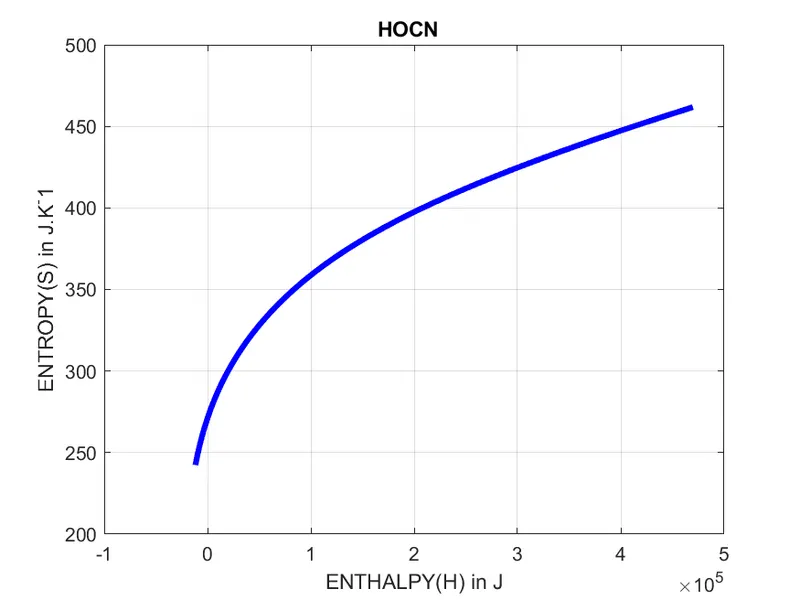
Enthalpy vs Entropy Plot
Following are the plots for 'HNCO' species
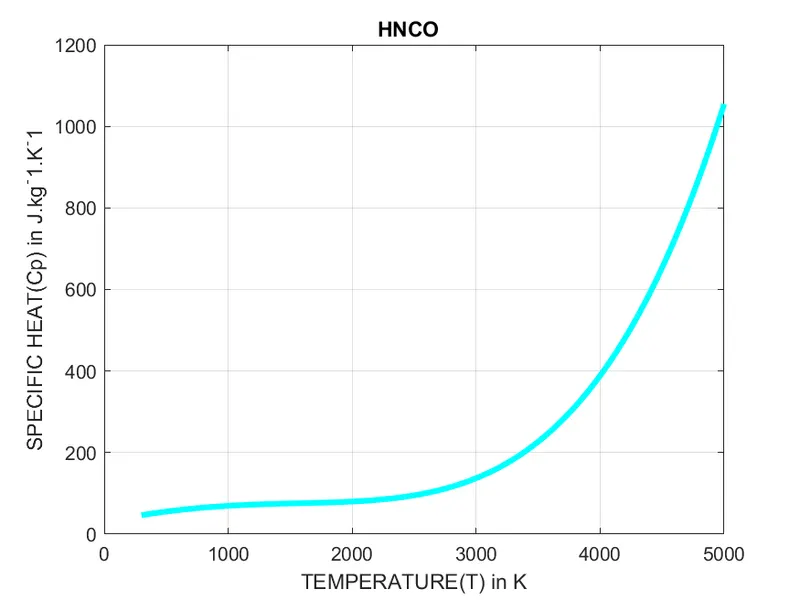
Temperature vs Specific Heat Plot
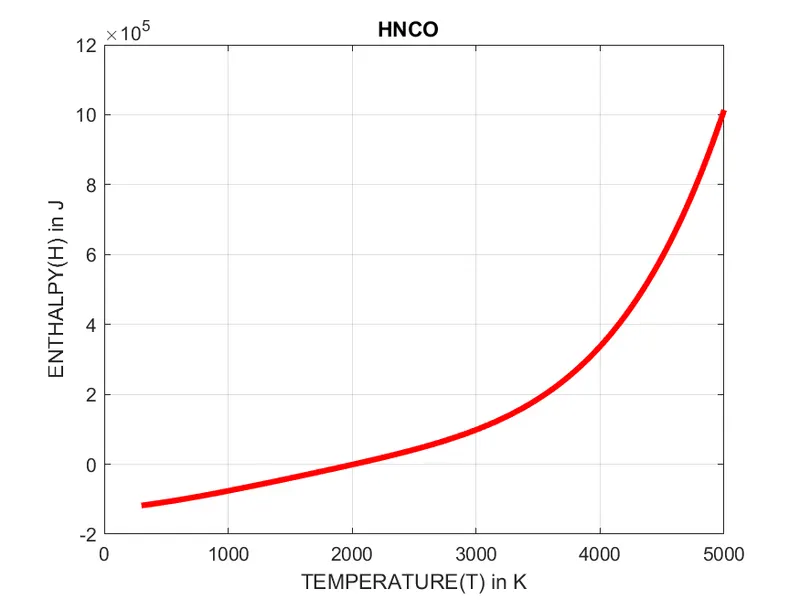
Temperature vs Enthalpy Plot
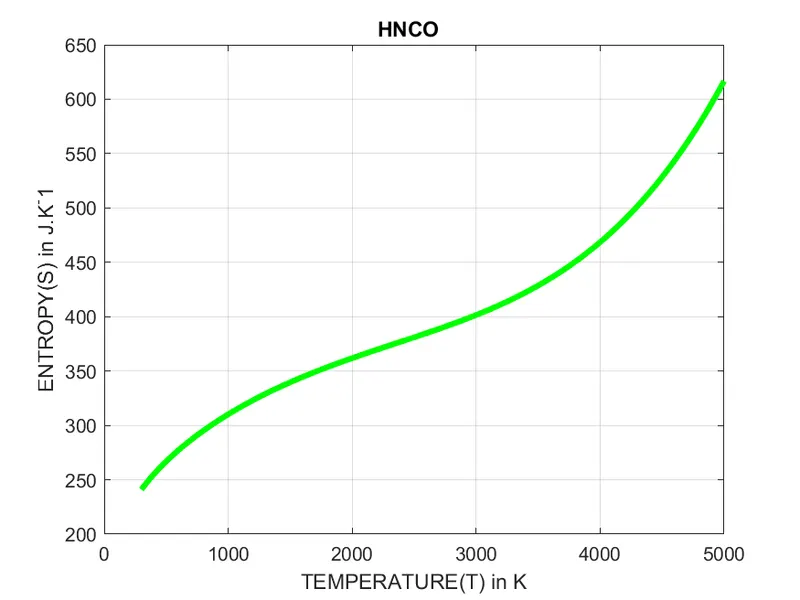
Temeprature vs Entropy Plot
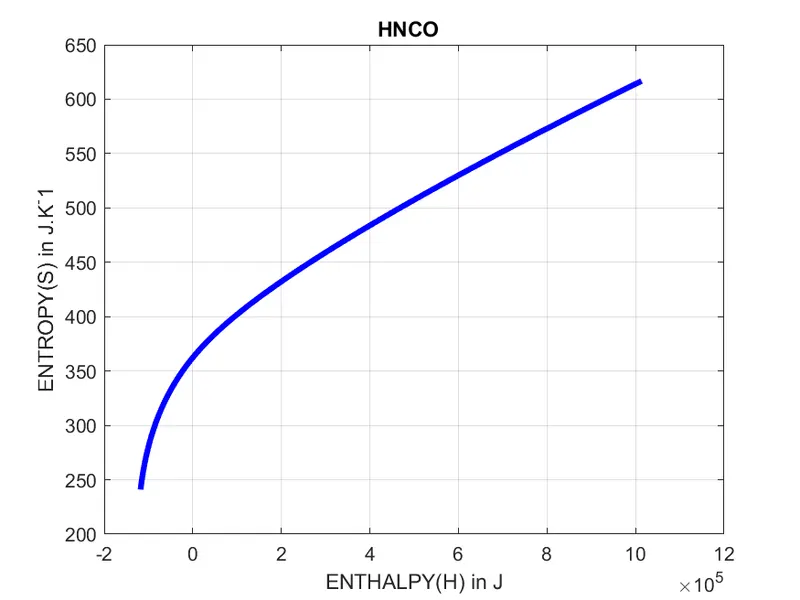
Enthalpy vs Entropy Plot
Following are the plots for 'NCO' species
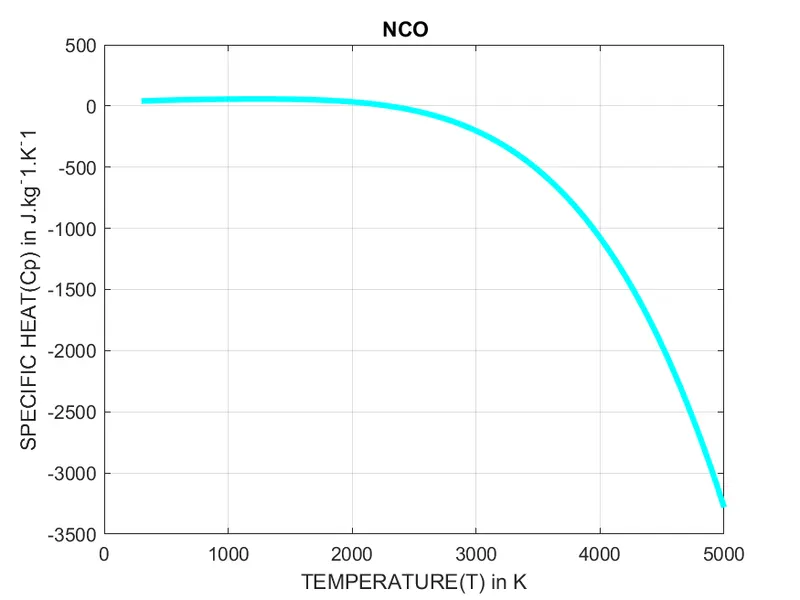
Temperature vs Specific Heat Plot
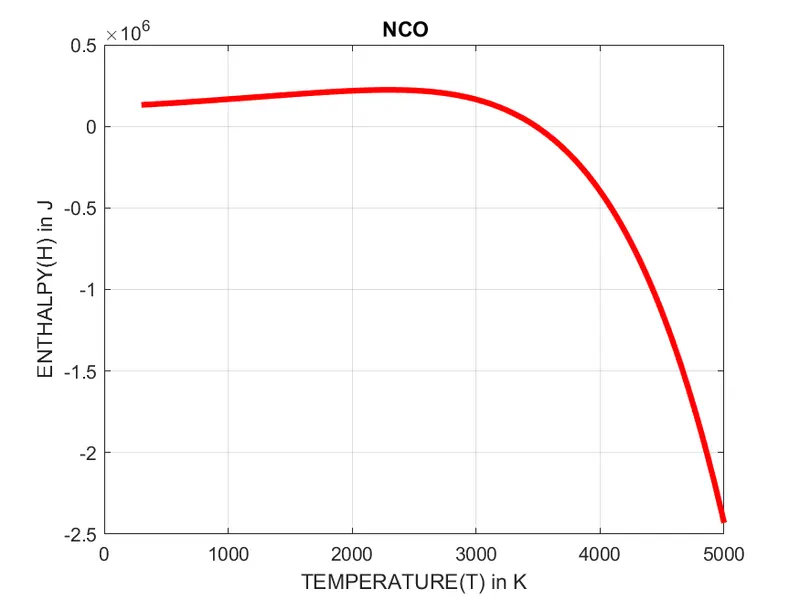
Temperature vs Enthalpy Plot
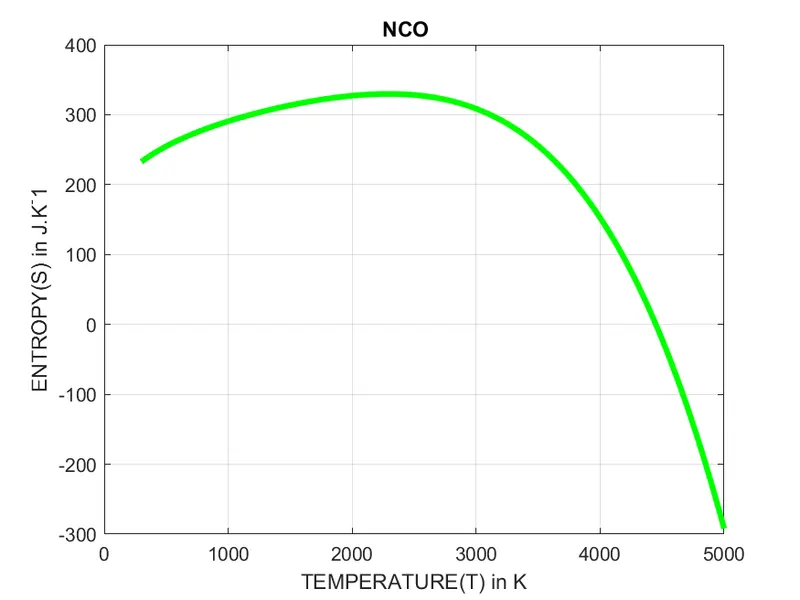
Temeprature vs Entropy Plot
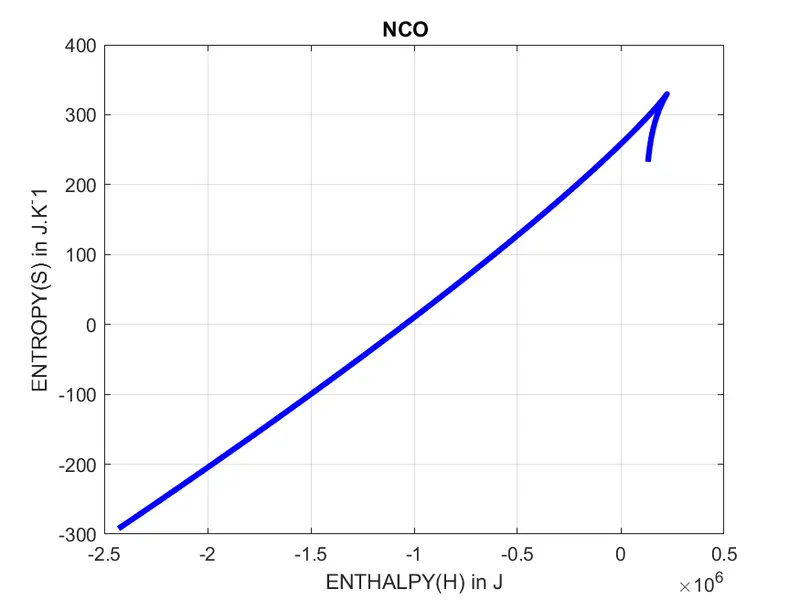
Enthalpy vs Entropy Plot
Following are the plots for 'CN' species
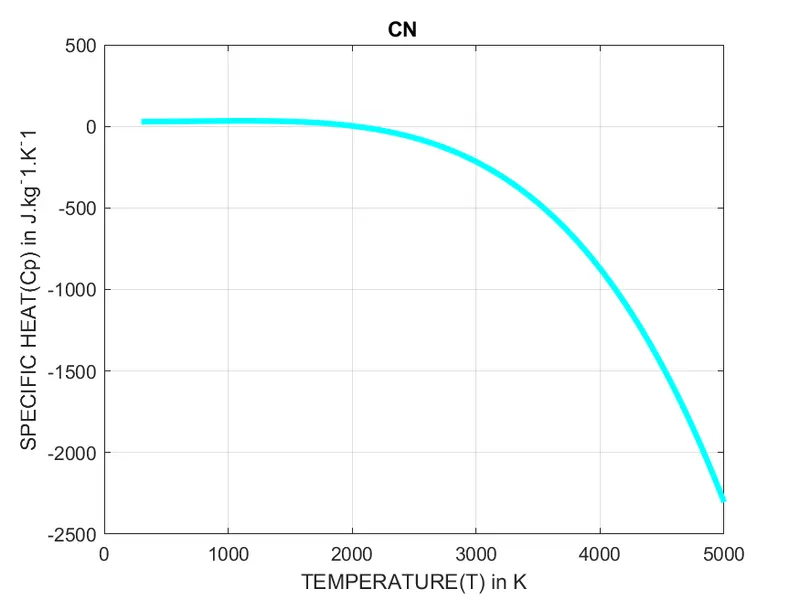
Temperature vs Specific Heat Plot
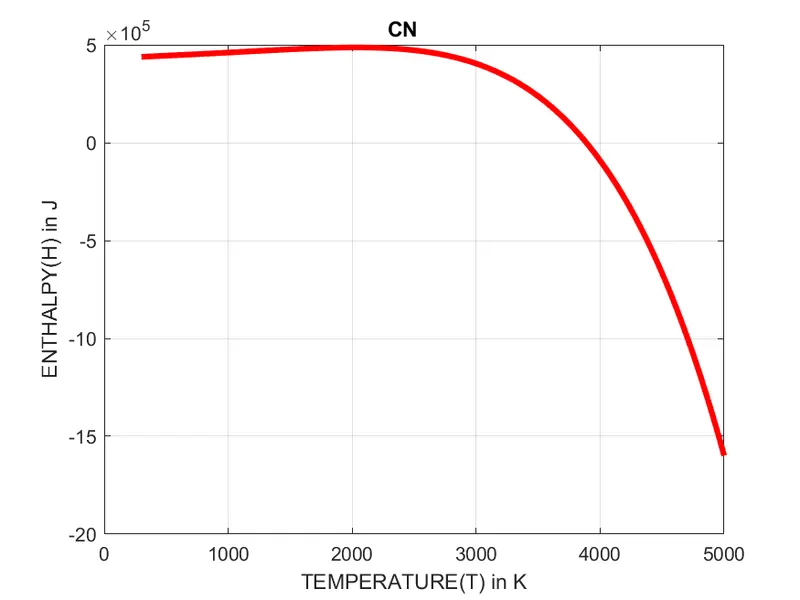
Temperature vs Enthalpy Plot
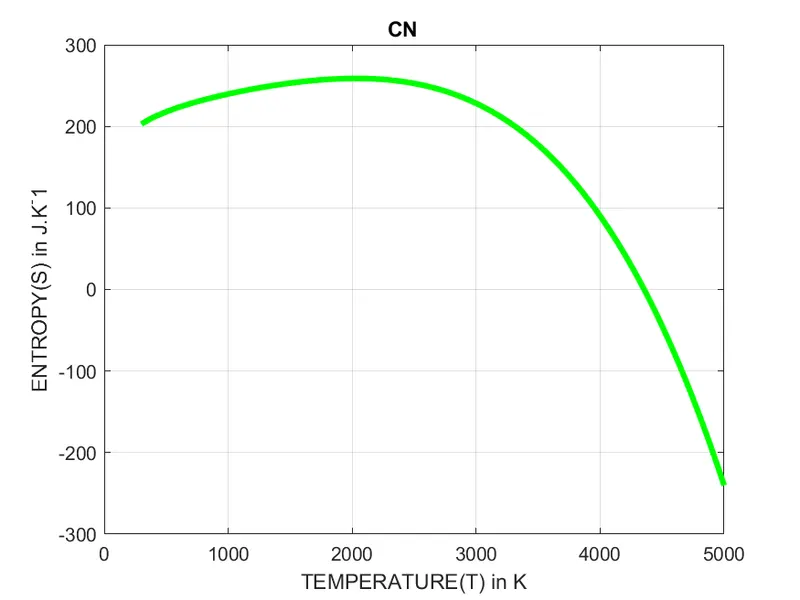
Temeprature vs Entropy Plot
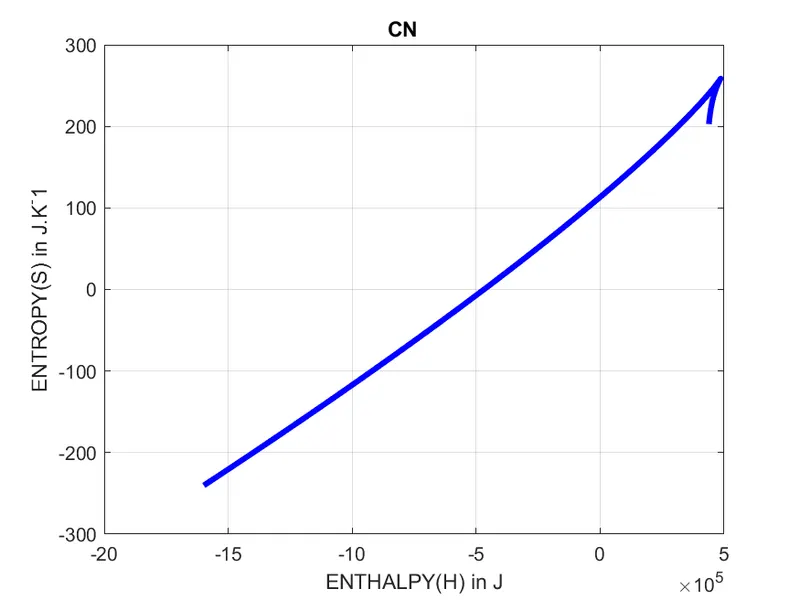
Enthalpy vs Entropy Plot
Following are the plots for 'HCNN' species
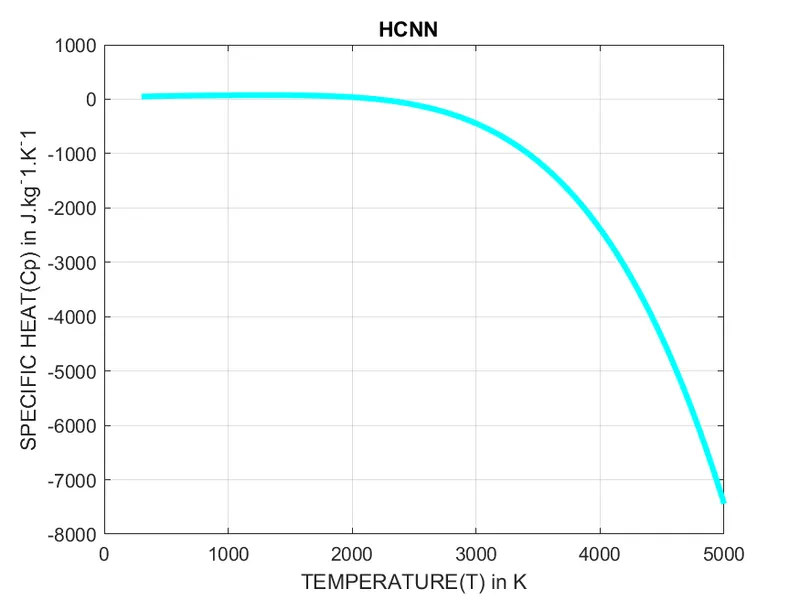
Temperature vs Specific Heat Plot
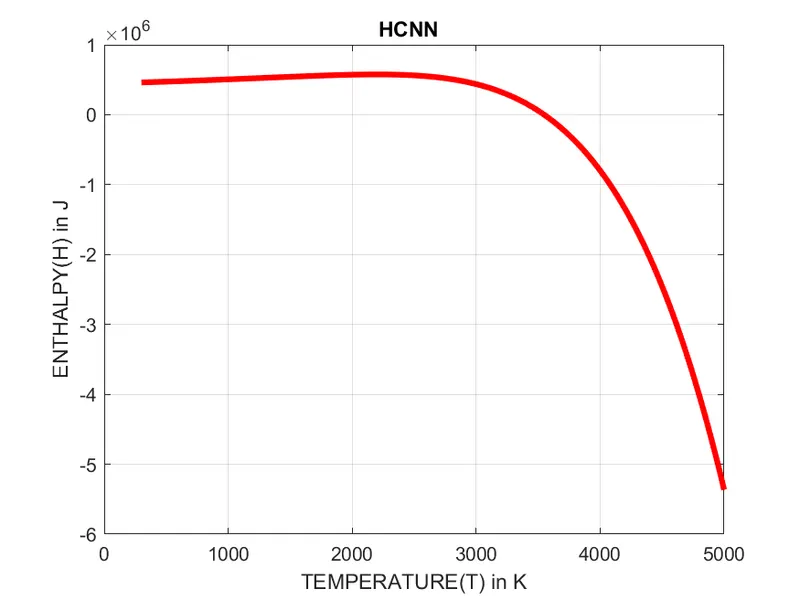
Temperature vs Enthalpy Plot
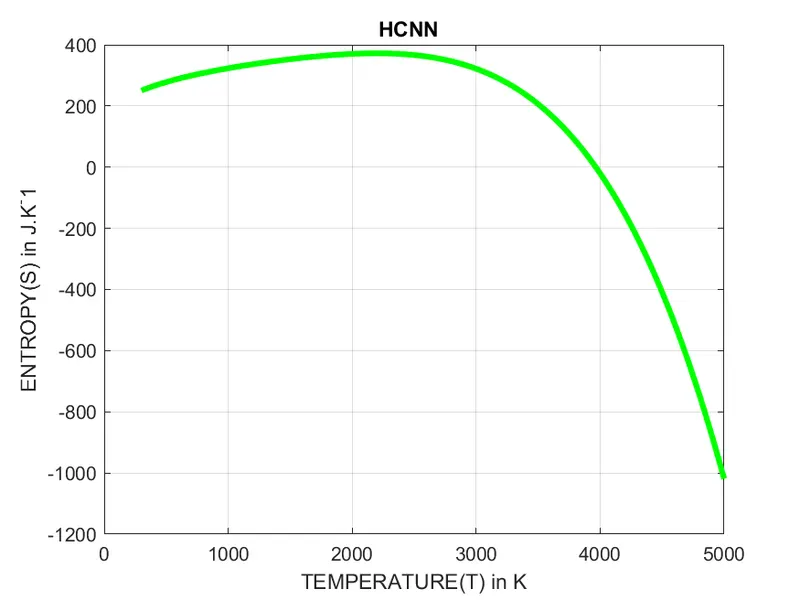
Temeprature vs Entropy Plot
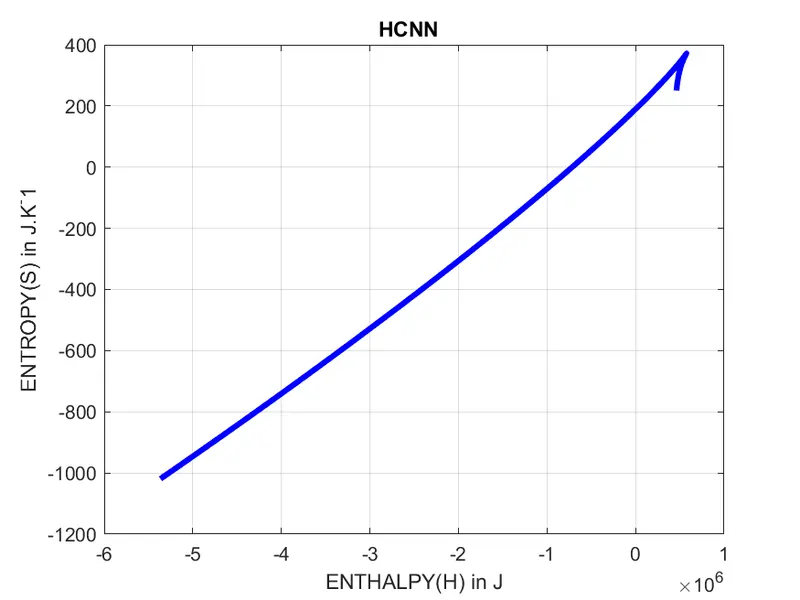
Enthalpy vs Entropy Plot
Following are the plots for 'N2 species
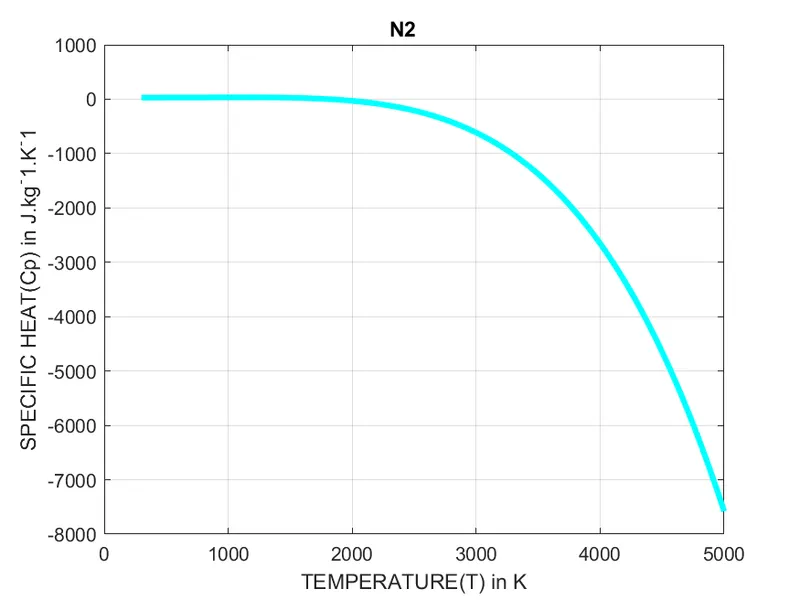
Temperature vs Specific Heat Plot
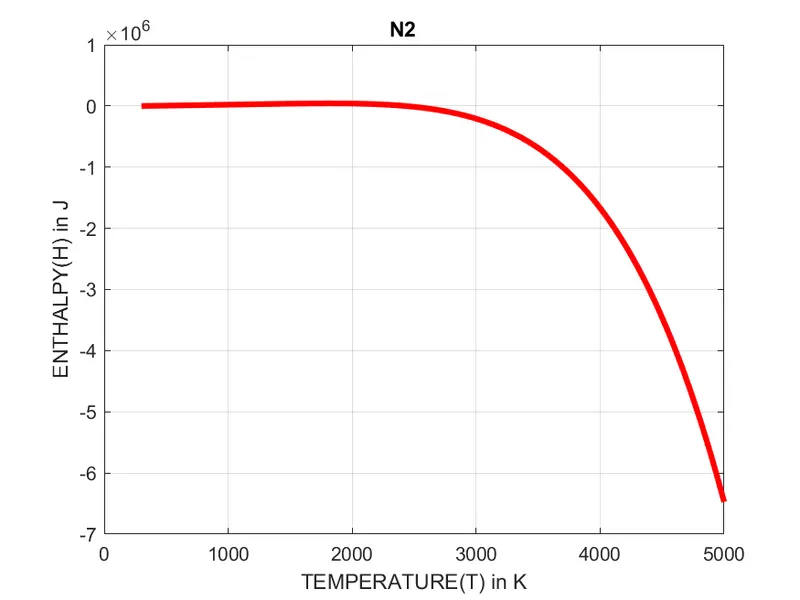
Temperature vs Enthalpy Plot
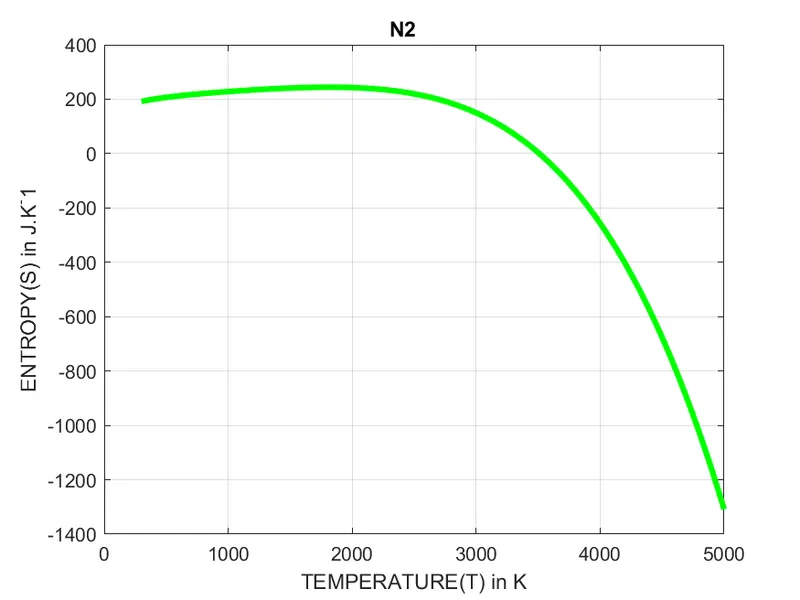
Temeprature vs Entropy Plot
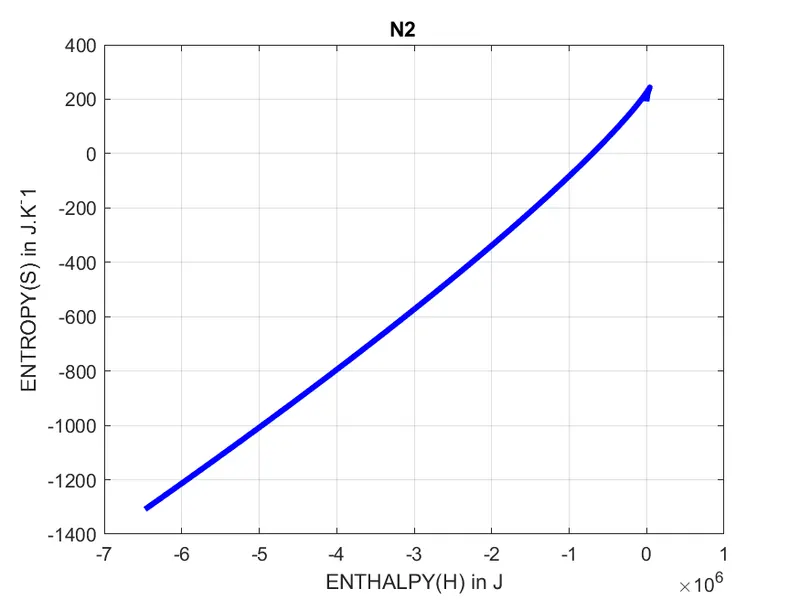
Enthalpy vs Entropy Plot
Following are the plots for 'AR' species
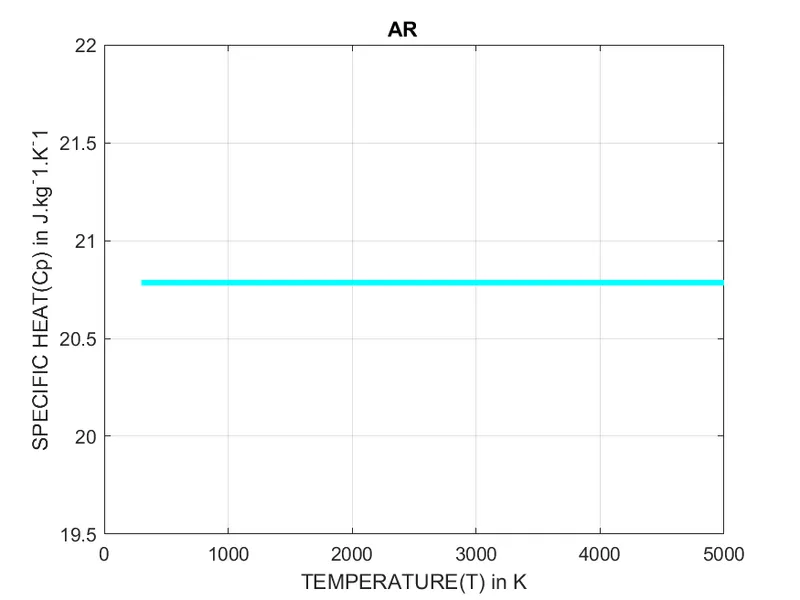
Temperature vs Specific Heat Plot
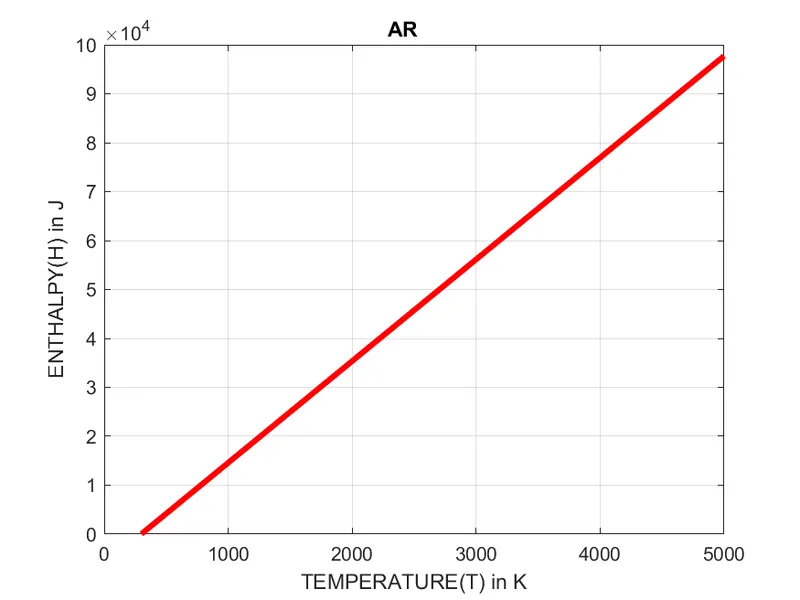
Temperature vs Enthalpy Plot
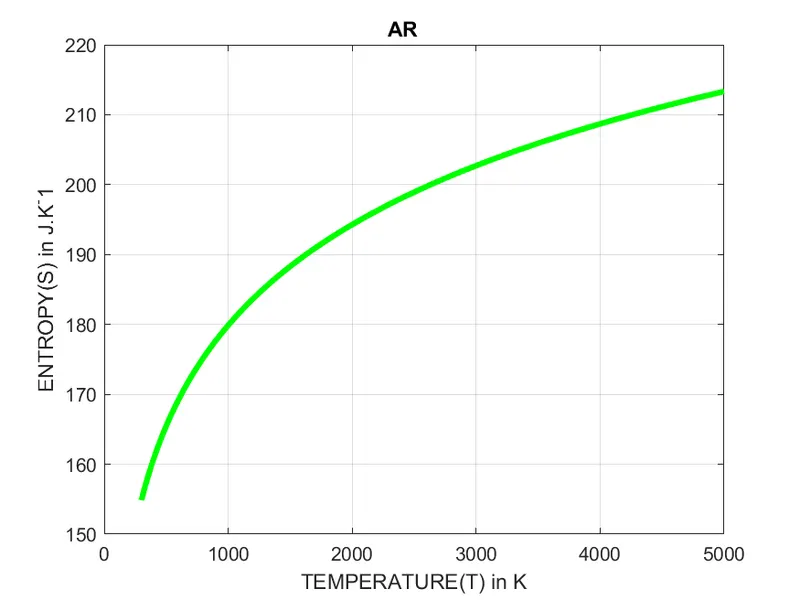
Temeprature vs Entropy Plot
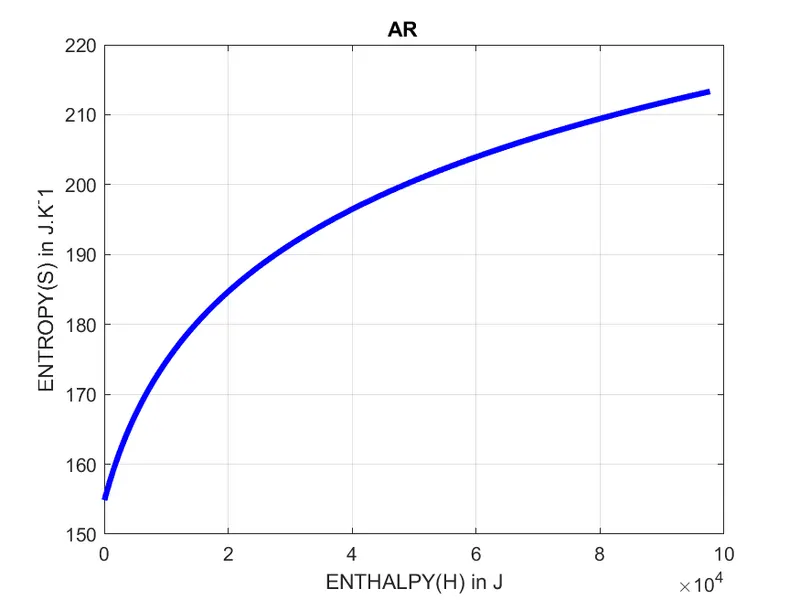
Enthalpy vs Entropy Plot
Following are the plots for 'C3H8' species
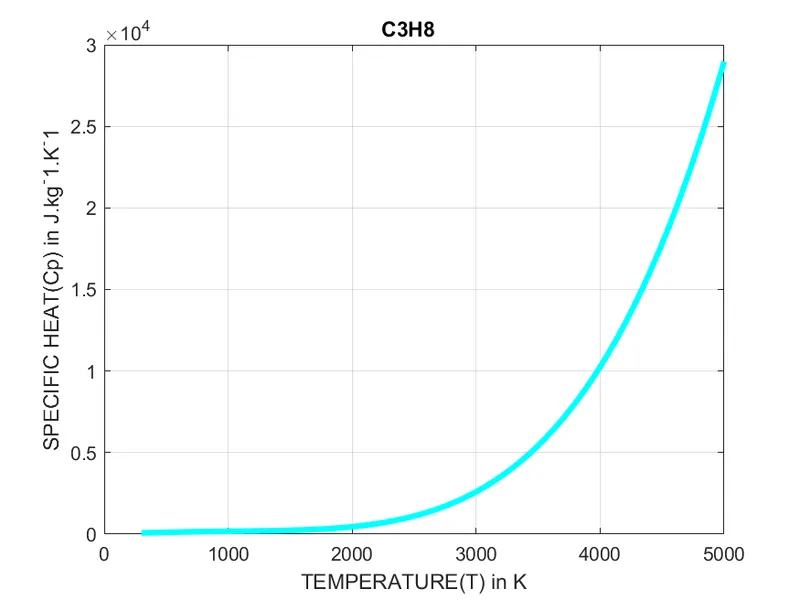
Temperature vs Specific Heat Plot
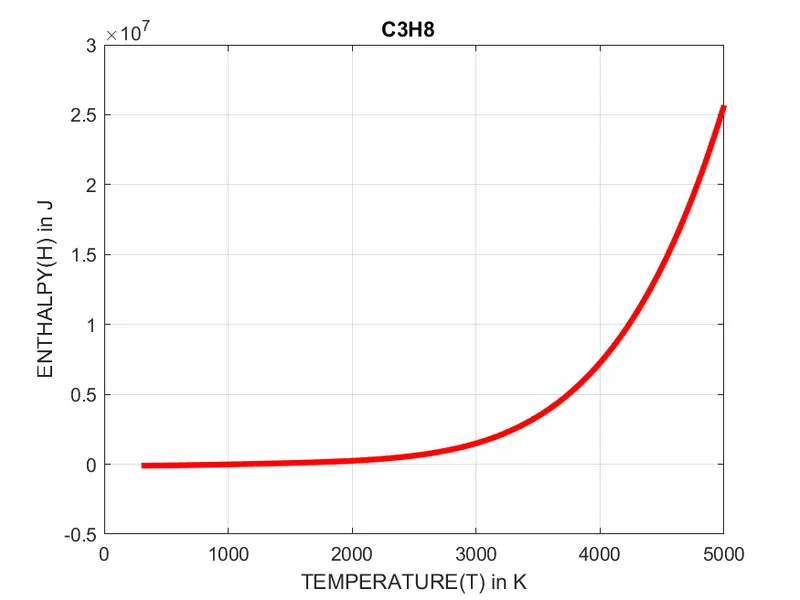
Temperature vs Enthalpy Plot
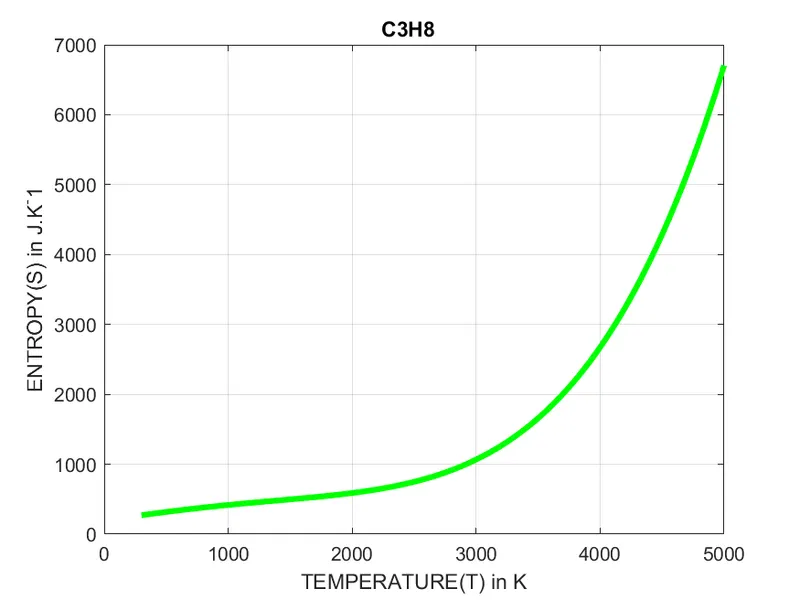
Temeprature vs Entropy Plot
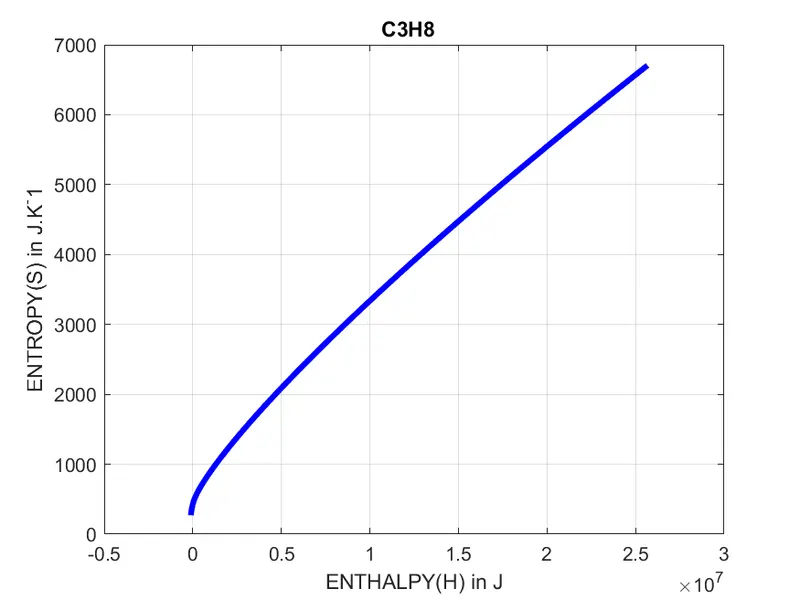
Enthalpy vs Entropy Plot
Following are the plots for 'C3H7' species
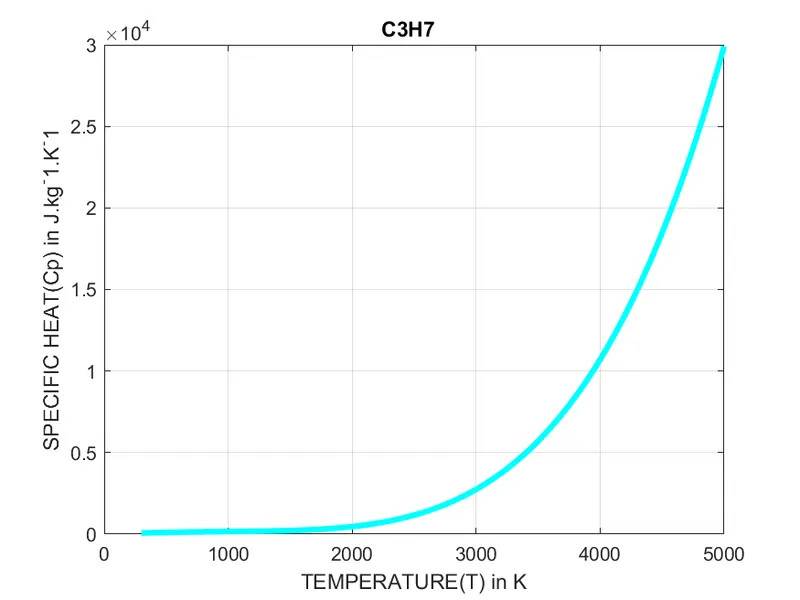
Temperature vs Specific Heat Plot
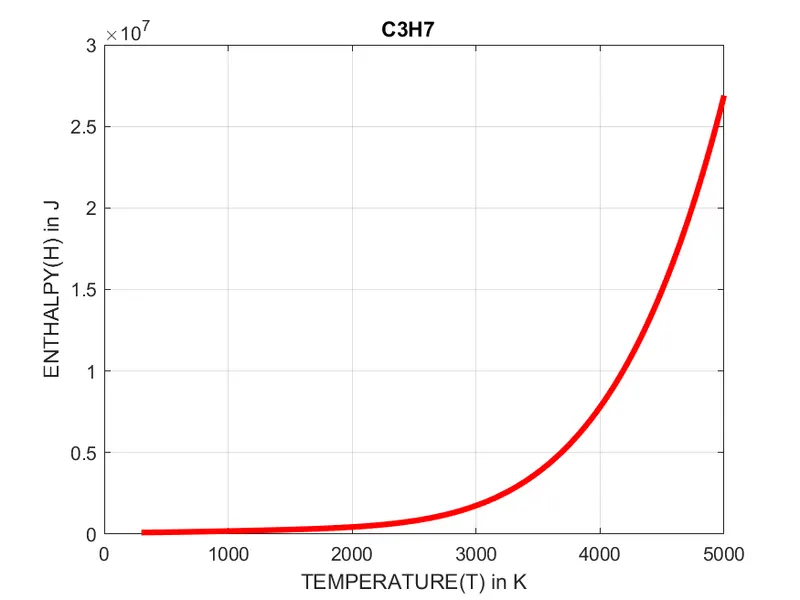
Temperature vs Enthalpy Plot
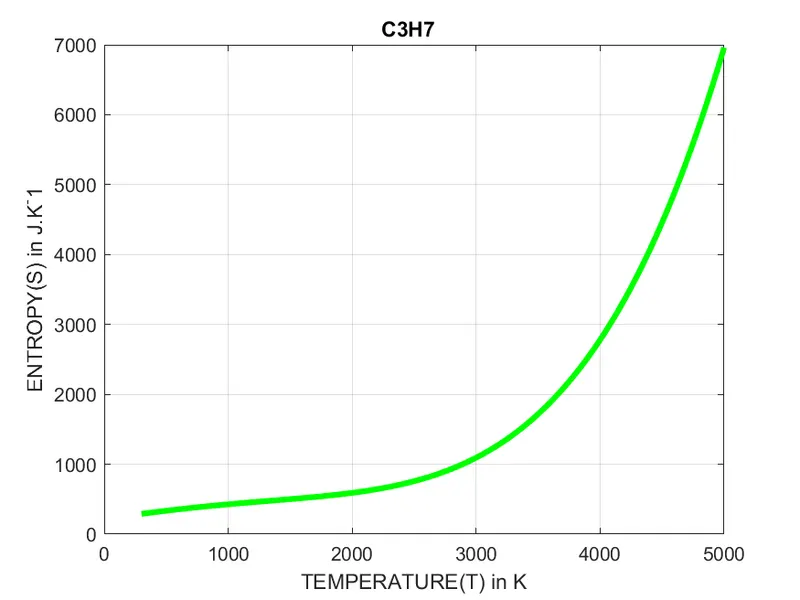
Temeprature vs Entropy Plot
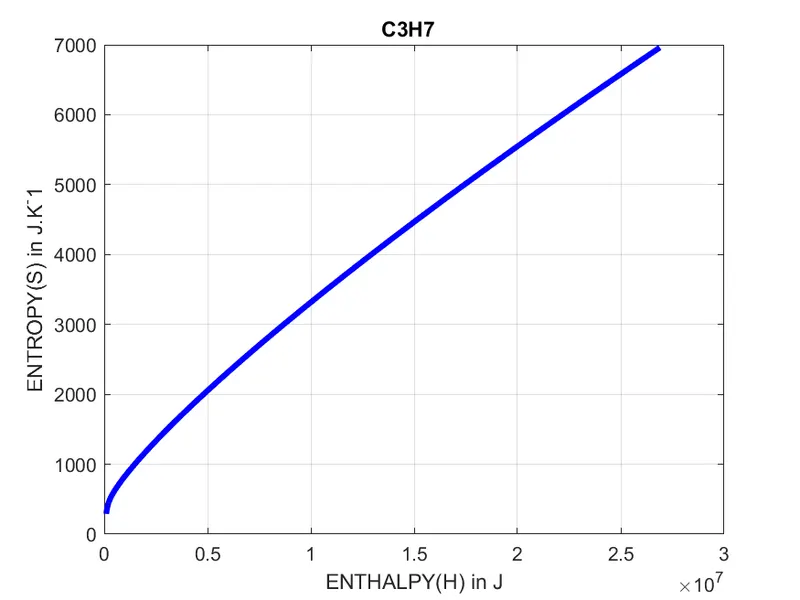
Enthalpy vs Entropy Plot
Following are the plots for 'CH3CHO' species
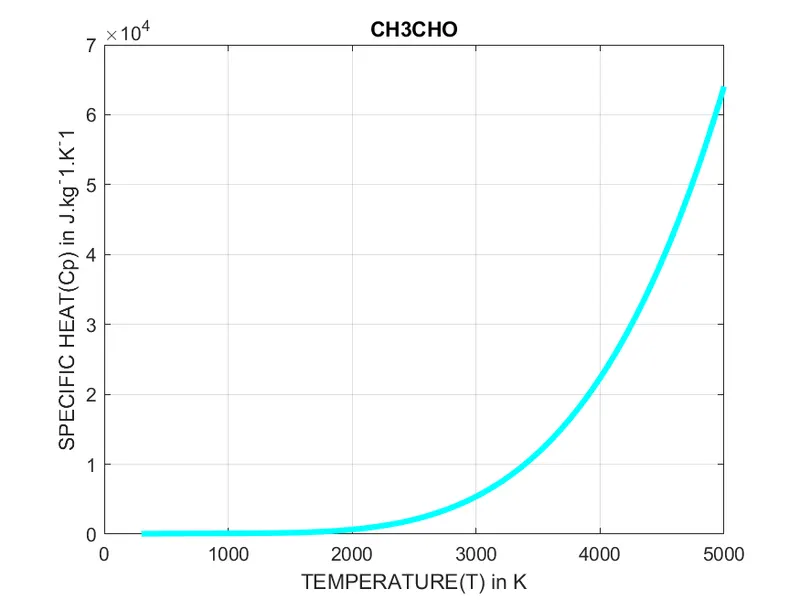
Temperature vs Specific Heat Plot
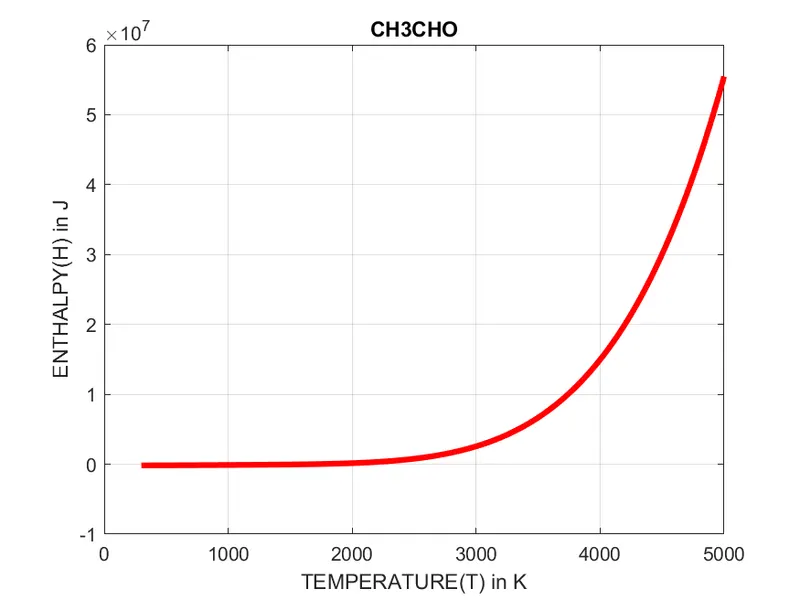
Temperature vs Enthalpy Plot
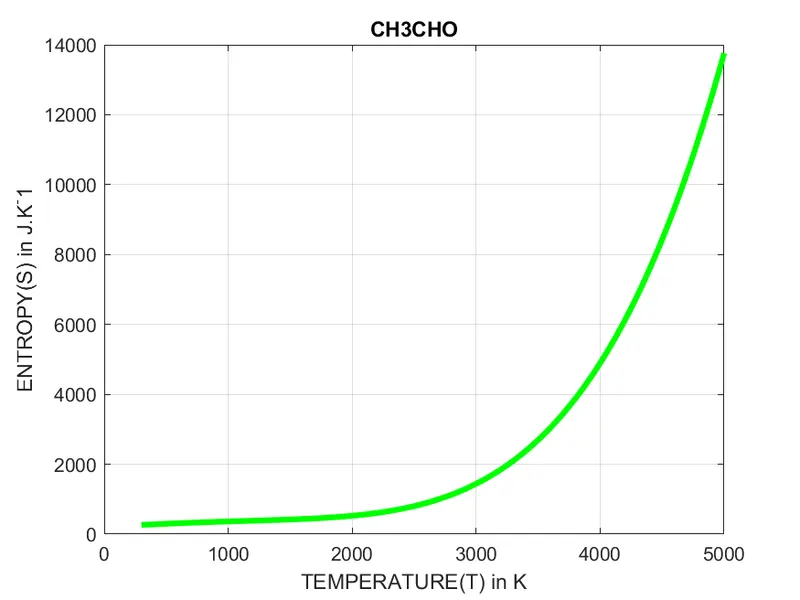
Temeprature vs Entropy Plot
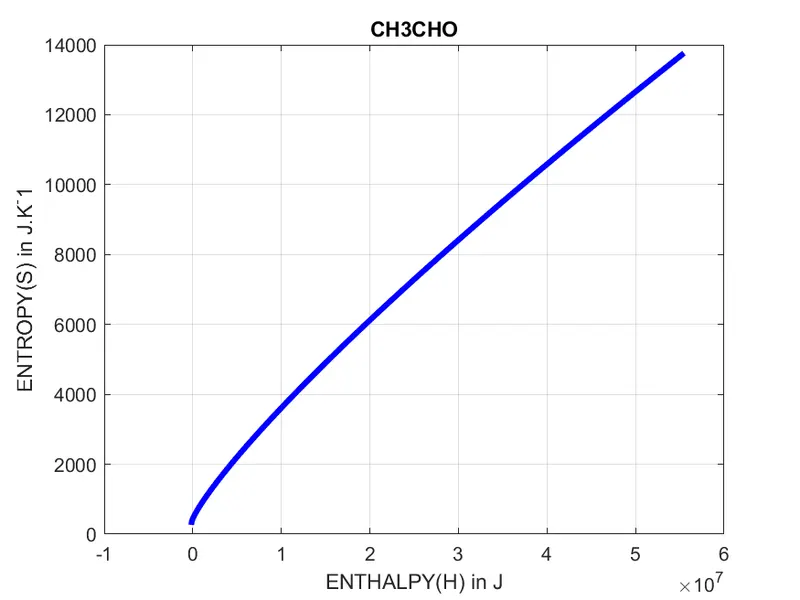
Enthalpy vs Entropy Plot
Following are the plots for 'CH2CHO' species
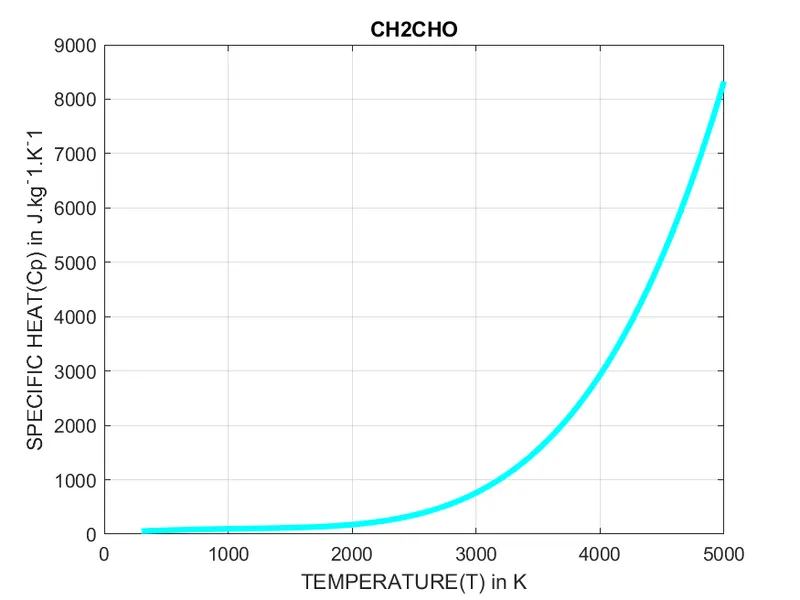
Temperature vs Specific Heat Plot
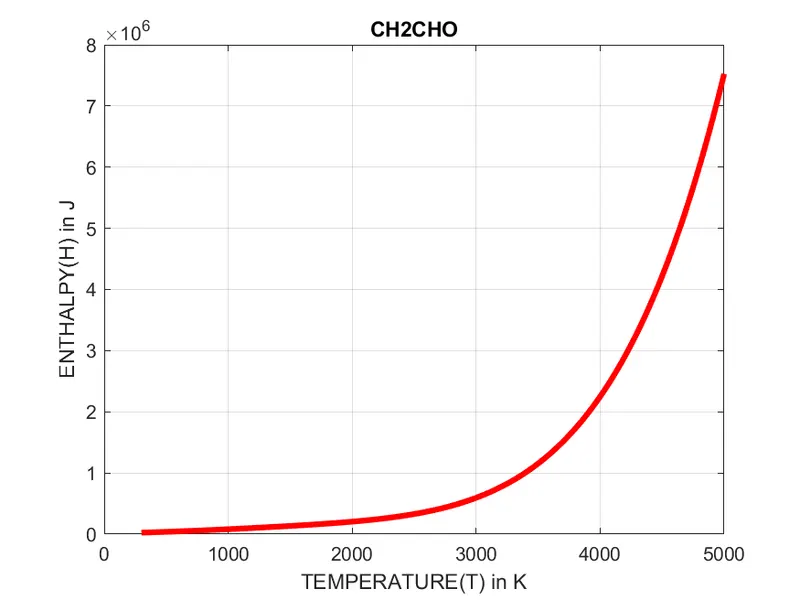
Temperature vs Enthalpy Plot
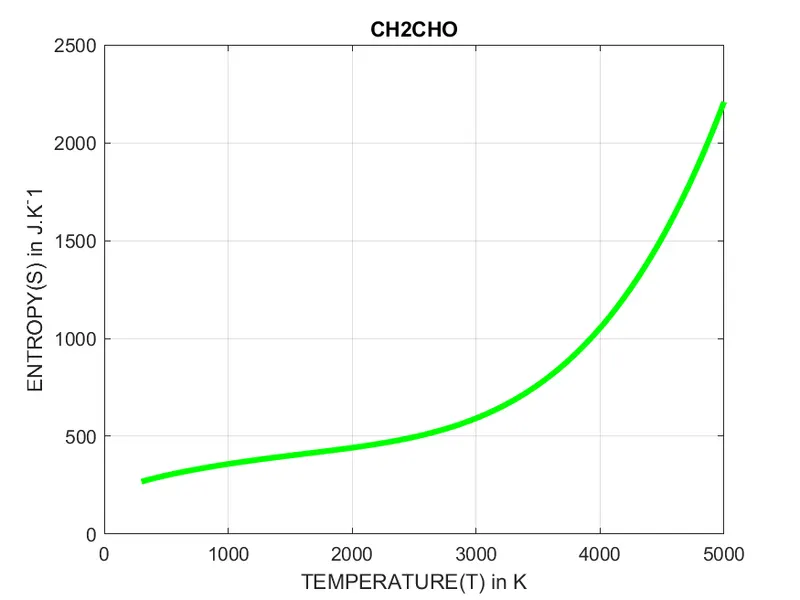
Temeprature vs Entropy Plot
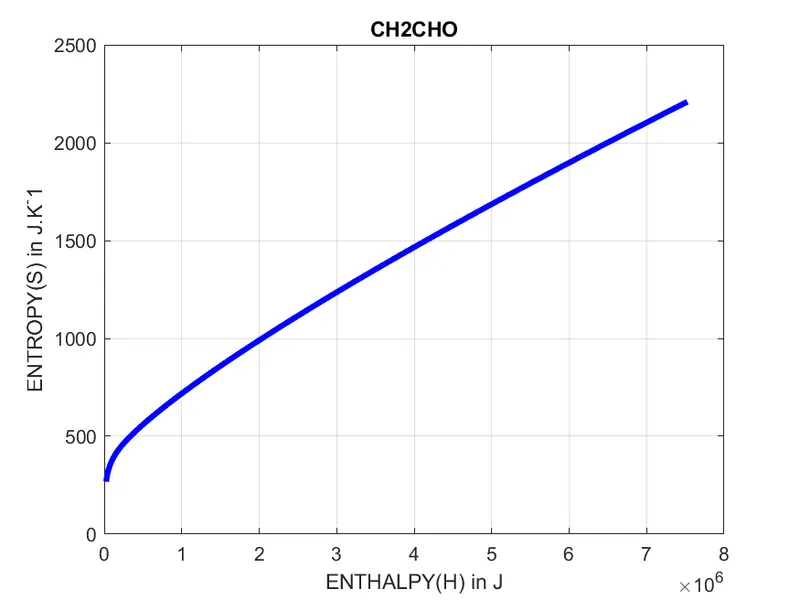
Enthalpy vs Entropy Plot
THe following images show the Molecular weight calculated for each species.
ERRORS:
There were few typo errors which were rectified as they were encountered.
REFERENCES:
https://en.wikipedia.org/wiki/Parsing
https://in.mathworks.com/help/matlab/matlab_prog/parse-function-inputs.html
https://in.mathworks.com/help/matlab/ref/inputparser.h
https://in.mathworks.com/help/matlab/ref/fopen.html
http://in.mathworks.com/help/matlab/ref/fgetl.html
https://in.mathworks.com/help/matlab/ref/strsplit.html
http://in.mathworks.com/help/matlab/ref/str2double.html
https://in.mathworks.com/help/matlab/ref/strfind.html